Airbnb Revenue in Bend: 2026 Short-Term Rental Data & Insights
Use real short-term rental data to evaluate revenue potential, occupancy rates, and the best investment areas in Bend.
Key indicators as of August 2026
| Metric | Market | 1Y Change | 3Y Change |
|---|---|---|---|
| Revenue | $58K/yr | +8.6% | +53.4% |
| Occupancy Rate | 67% | -8.3% | -4.3% |
| Nightly Rate | $223 | +15.0% | +57.5% |
| Active Listings | 1,137 | +16.6% | +31.3% |
| Regulations | Lenient | – | – |
A typical short-term rental in Bend has a median revenue of $58K in September, 2025 - August 2026, with 1,137 active listings and an occupancy rate of 67%.
Short-term rentals combine two key benefits of real estate investing: long-term property appreciation and relatively high rental yields.
Our market investability grade evaluates how attractive a city is for short-term rental investors. The score is based on factors such as short-term rental yields and year-over-year market trends, compared with other similar markets.
This grade is designed specifically for short-term rental investors looking to evaluate market opportunities.
Moderate returns, market dependent for starting an Airbnb.
Bend ranks in the bottom % for short-term rental yield and the bottom % for year-over-year revenue growth.
Regulation
Compared to other markets in United States: top % for revenue, bottom % for ADR, and top % for occupancy.
Percentile rank vs other United States markets
To see the top yield, demand, or growth markets in United States, go to Market Explorer.
Sign up for freeOccupancy
67%
-8.3% 1Y
ADR
$223
+15.0% 1Y
Revenue
$58K/yr
+8.6% 1Y
Listings
1,137
+16.6% 1Y
Seasonality is high; demand peaks in Jul and is weakest in Jan.
Listings near McMenamins Old St. Francis School earn a +7% location premium.
Location, location, location. When it comes to short-term rentals, location plays a crucial role, but often in a different way than in traditional real estate.
For Airbnb properties, being close to tourist attractions, business districts, or popular neighborhoods usually matters more than being in a quiet residential area with good schools.
This is an important distinction for investors. In many cases, relatively affordable properties can perform very well as short-term rentals if they are located in areas with strong travel demand.
2-bedroom properties achieve the highest occupancy rate in Bend, at 69%.
When it comes to property types, the size of the property is usually the biggest factor. This is most commonly represented by the number of bedrooms. In some cases, the number of beds or bathrooms can matter too, but across most markets bedroom count explains demand the best.
The next important factor is amenities. Pools are often the most impactful, followed by views, outdoor space (balcony or terrace), and hot tubs. Depending on the type of guest a property targets, practical amenities such as kitchens, laundry, or parking can also play an important role — especially for longer stays.
Below is how occupancy rates vary by number of bedrooms in Bend.
Looking at property size together with pricing segments (budget / mid-scale / luxury) often reveals what guests are actually looking for in a market. In some markets demand concentrates on large but affordable homes, while in others smaller luxury listings perform better.
Full property type and pricing data is available in the Airbtics app.
Short-term rental occupancy can vary significantly depending on seasonality, day of the week, and major events. Looking at daily data helps reveal these patterns and shows when demand is strongest in a market.
The chart below shows the daily Airbnb occupancy rate in Bend, representing the percentage of listings that were booked on each day.
Inside the Airbtics platform, you can explore nearly five years of historical daily occupancy data, starting from July 2021.
Top-performing Airbnb listings in Bend earn up to $119K per year.
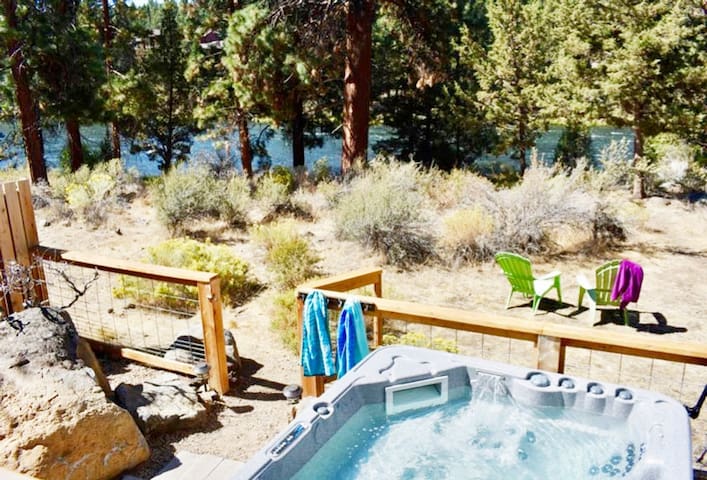
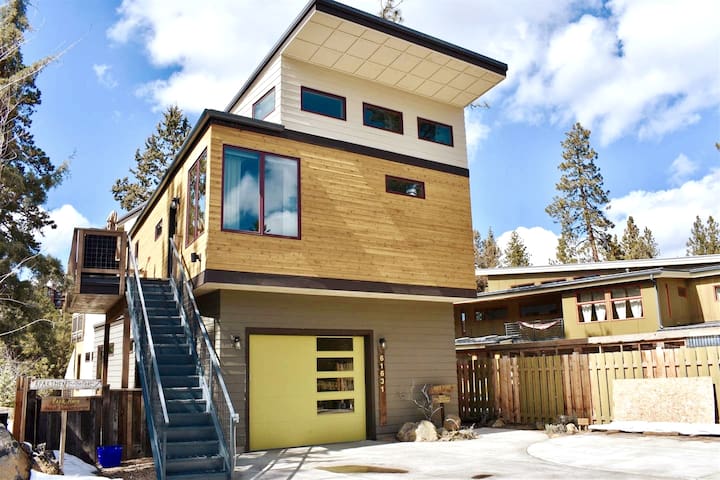
Airbtics has been tracking all Airbnb listings globally since 2019. Below are three of the top guest favorite listings in Bend — properties that guests consistently rate among the best in the market. Go to the app to find detailed information about 1,137 listings.
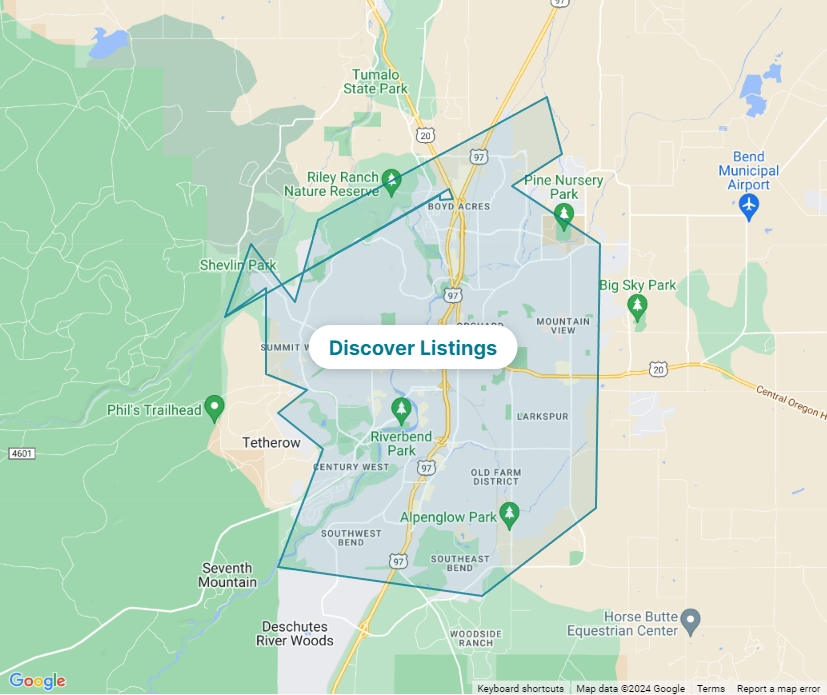
Comparing Bend with nearby markets helps put its performance in context. Some neighboring markets offer higher yields or lower entry prices within a short drive.
Want to go deeper than this report? Our free YouTube course walks you through how to evaluate a short-term rental market step by step — from reading occupancy and revenue data to picking the right property type and location.
The average Bend Airbnb host was able to make $58K in September, 2025 - August 2026. Your actual vacation rental revenue can vary depending on your listing's location, type, size, amenities, target guest persona, property management style, marketing strategy, and other factors. Check out our detailed Bend Airbnb data to see how different factors affect revenue and estimate your potential income.
With an ADR of $223 and a median occupancy rate of 67%, short-term rentals in Bend can be very profitable. However, exactly how much money you can make from Airbnb in Bend is determined by multiple factors. Remember that profitable Airbnb investments start with the best location. Buy an Airbnb property in one of the most profitable locations in Bend.
The return on investment (ROI) on Airbnb properties in Bend depends on factors like the purchase price, rental income, and operating costs. While the exact ROI varies by property, you can get an estimate by using key metrics such as annual rental income, daily rates, and occupancy. In Bend, the annual Airbnb revenue is $58K. To estimate your ROI, compare this income against your property's purchase price and operating expenses. Our Airbnb calculator can help you run the numbers based on your investment and strategy.
The median Airbnb occupancy rate in Bend was 67% in September, 2025 - August 2026. However, your actual occupancy depends on many factors, such as your property type, number of bedrooms, pricing strategy, and marketing efforts.
As of 16th October, 2026, there are 1,137 active listings on the Airbnb platform in Bend.
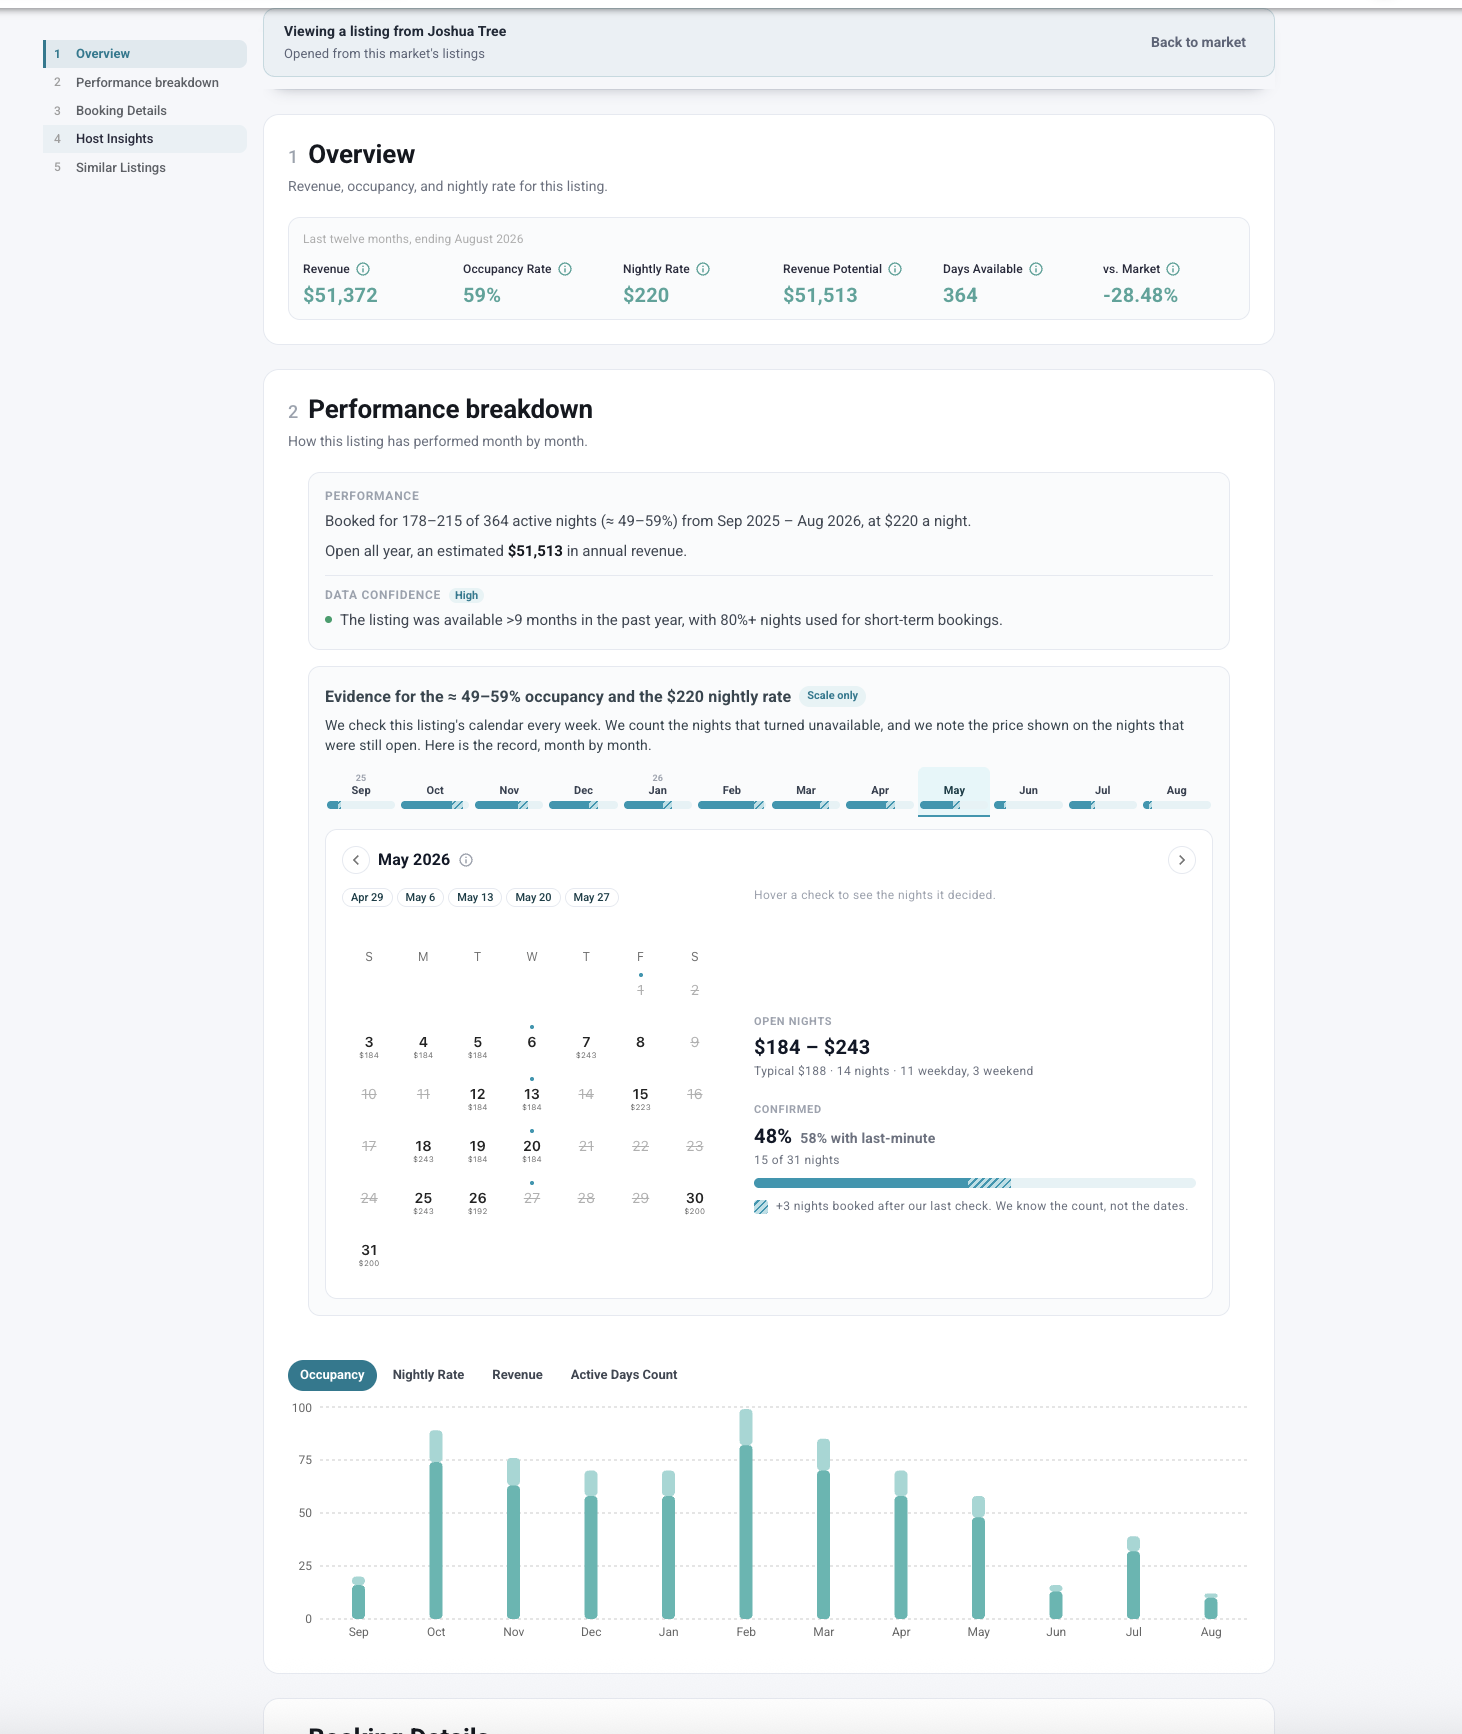
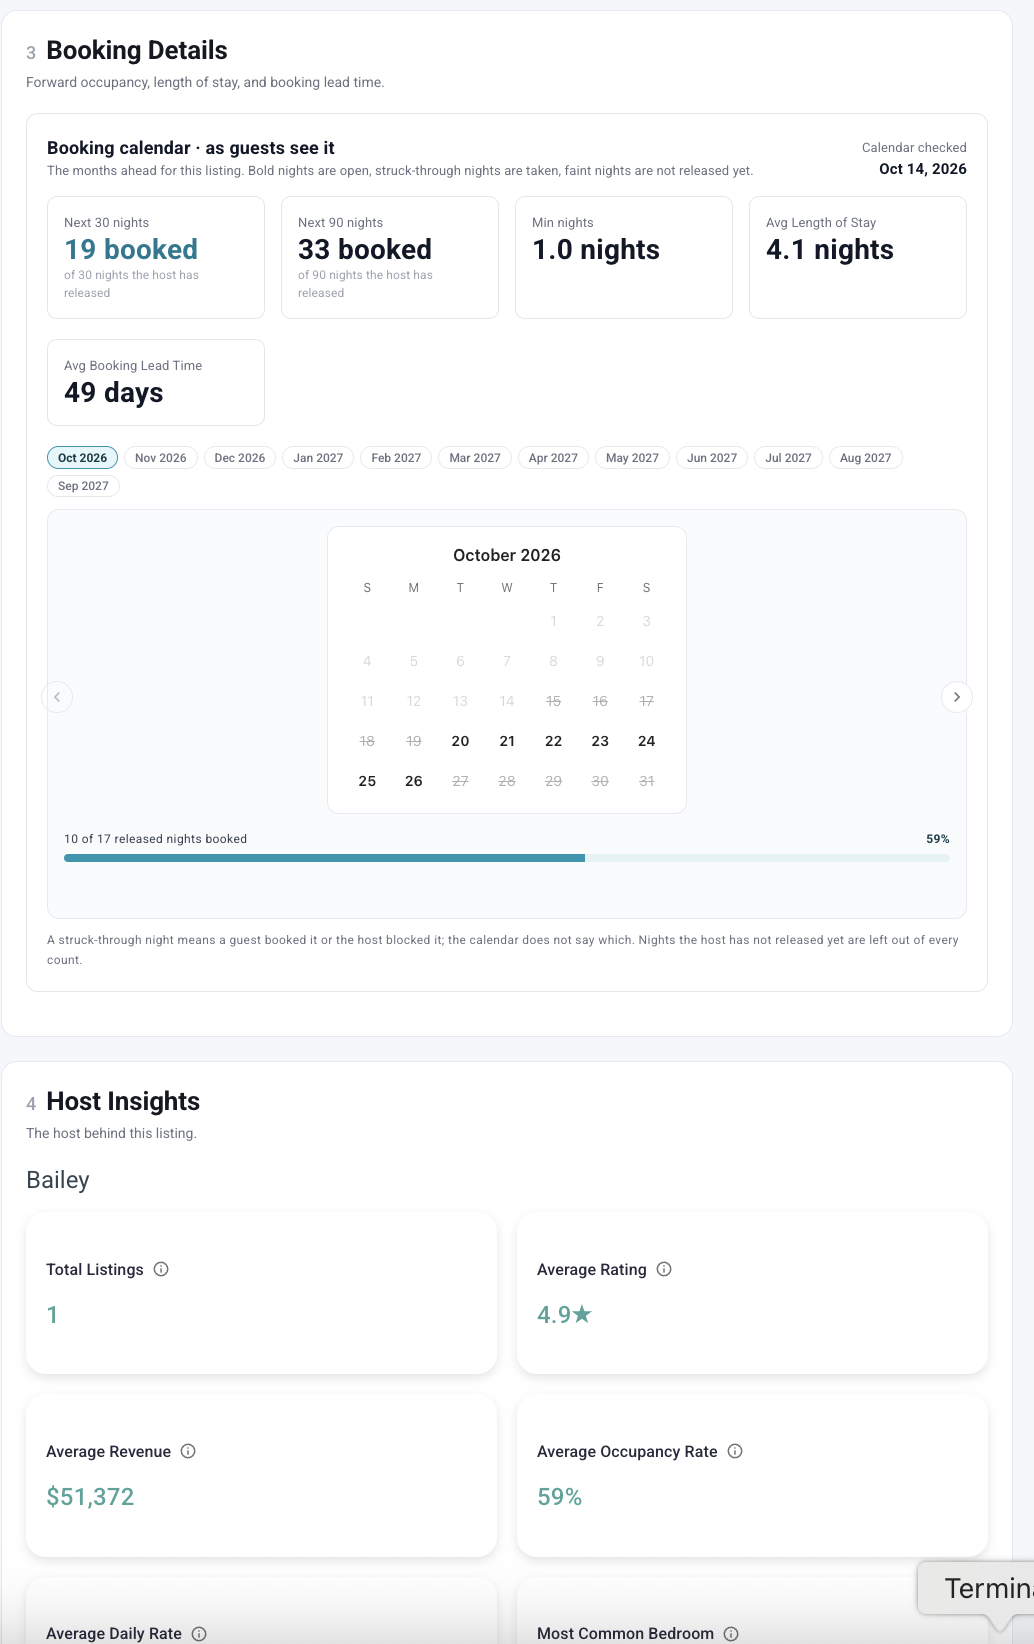
Explore individual Airbnb listings in Bend with historical revenue, occupancy and nightly rates, then look at the evidence behind those estimates. Airbtics lets you inspect weekly calendar snapshots showing which nights were open or unavailable and the prices recorded, so you can assess the assumptions behind the numbers. Compare similar properties and build your investment case on data you can trace.