Is it profitable to do Airbnb in Columbus, The United States?
What is the occupancy rate of Airbnb in Columbus, The United States?
What is the average daily rate of Airbnb in Columbus, The United States?
The United States / Columbus
Columbus, Airbnb Market Statistics & Data, The United States
A typical short-term rental listing in Columbus is booked for 248 nights a year, with a median occupancy rate of 68% and an average daily rate of $89. In 2023, a typical host income (annual revenue) was $22K. As of 12th September, 2024, there are 70 active Airbnb listings.
Average Revenue: $22K/yr
Occupancy Rate
68%
Avg Daily Rate
$89
Budget
No. of Listings
90
Small
YoY Revenue Change
0.74%
Best Month
June
** Period: 2023 Aug - 2024 July | Last Updated on: 12th September, 2024
Revenue By Month
2023-08 - 2024-07
Low
$1,090
Average
$1,796
High
$2,379
Is Airbnb Profitable in Columbus?
Yes, there is good short-term rental demand. A 68% median occupancy rate is considered a good market for Airbnb. The graph below shows the average monthly host income by month.
Tip! investing in a short-term rental can be highly stable and profitable. It’s stable because housing has been one of the most stable asset classes. Also, when you can’t do an Airbnb anymore, you can still rent it out to a long-term tenant with a lower yield. It is highly profitable because the monthly cash flow from short-term rental investment typically is double the amount of traditional rentals.
Starting an Airbnb in Columbus
Short-term rental regulation is lenient in Columbus. Very few Airbnb listing currently have put their license number on their Airbnb listing. This likely means the local government is not strictly enforcing the short-term rental-related regulations.
We made a guide on things you need to know before starting an Airbnb in The United States, learn how much it costs to start an Airbnb and if it’s profitable to start an Airbnb.
Average Airbnb Occupancy Rate in Columbus
A typical listing recorded a 68% average occupancy rate between 2023-08 - 2024-07. In this graph, you can see the occupancy rate distribution. About 3.7% of the guests are international guests, and visitors from United states is the largest group. Learn more about guest origin!.
You can find the distribution graph of daily rate and revenue in our market dashboard.
You can find the distribution graph of daily rate and revenue in our market dashboard.
Occupancy Rate: 68%
70 Active Listings
Signup and check out more in-depth vacation rental data for free.
Explore Columbus's Airbnb Data ⟶
Best Areas in Columbus for Airbnb
Are you wondering where to invest in Columbus? Look no further!
- Short North Arts District
- German Village
- Arena District
- Scioto Mile
- Ohio Statehouse
- Franklin Park Conservatory and Botanical Gardens
- Columbus Zoo and Aquarium
- North Market
- Ohio Stadium
- Easton Town Center
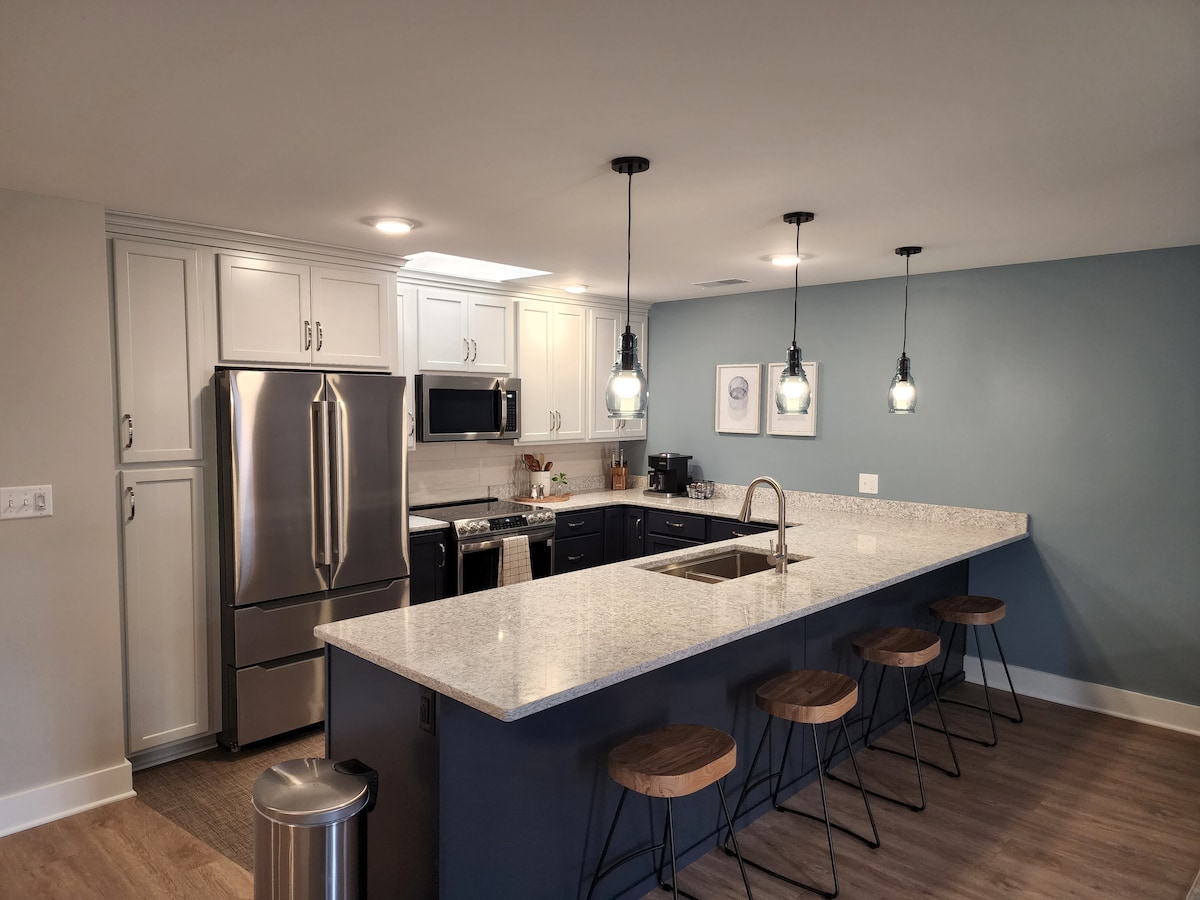
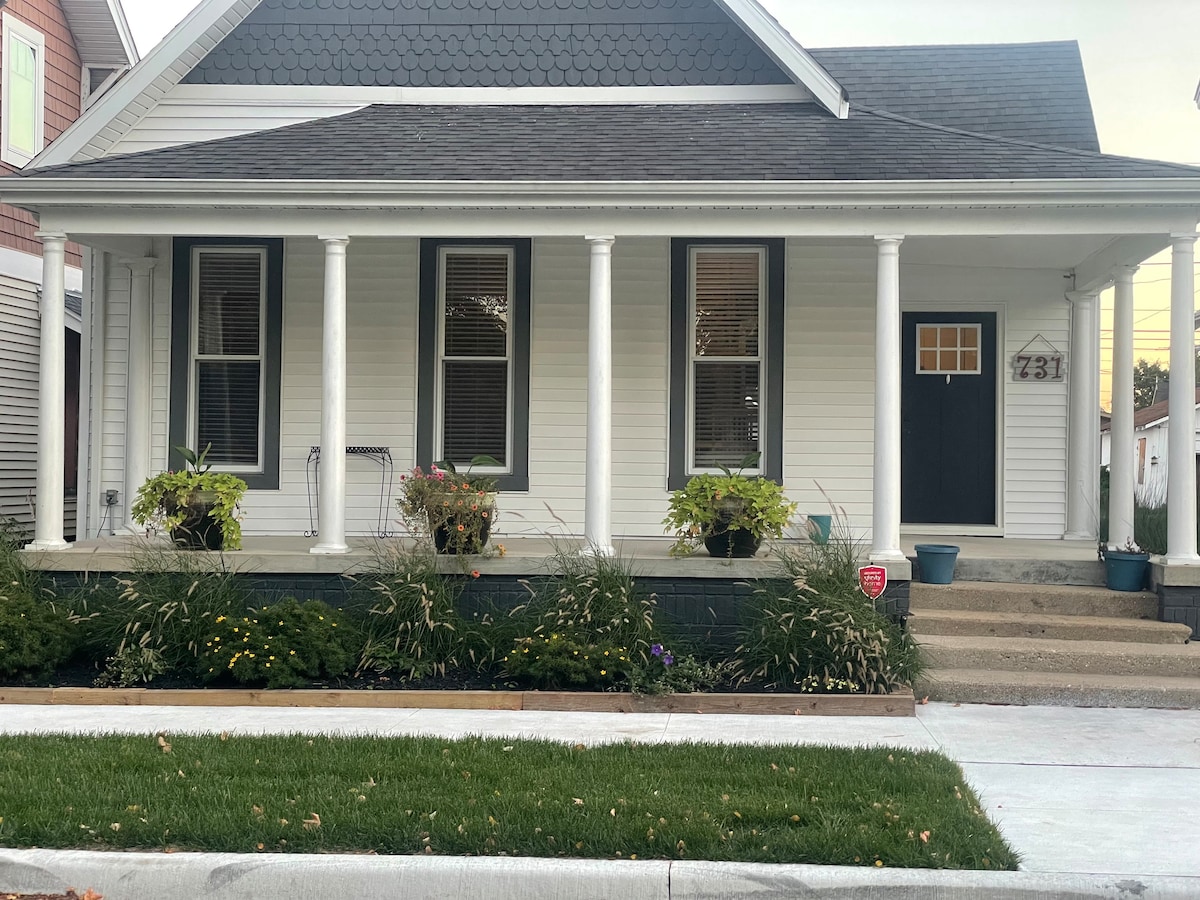
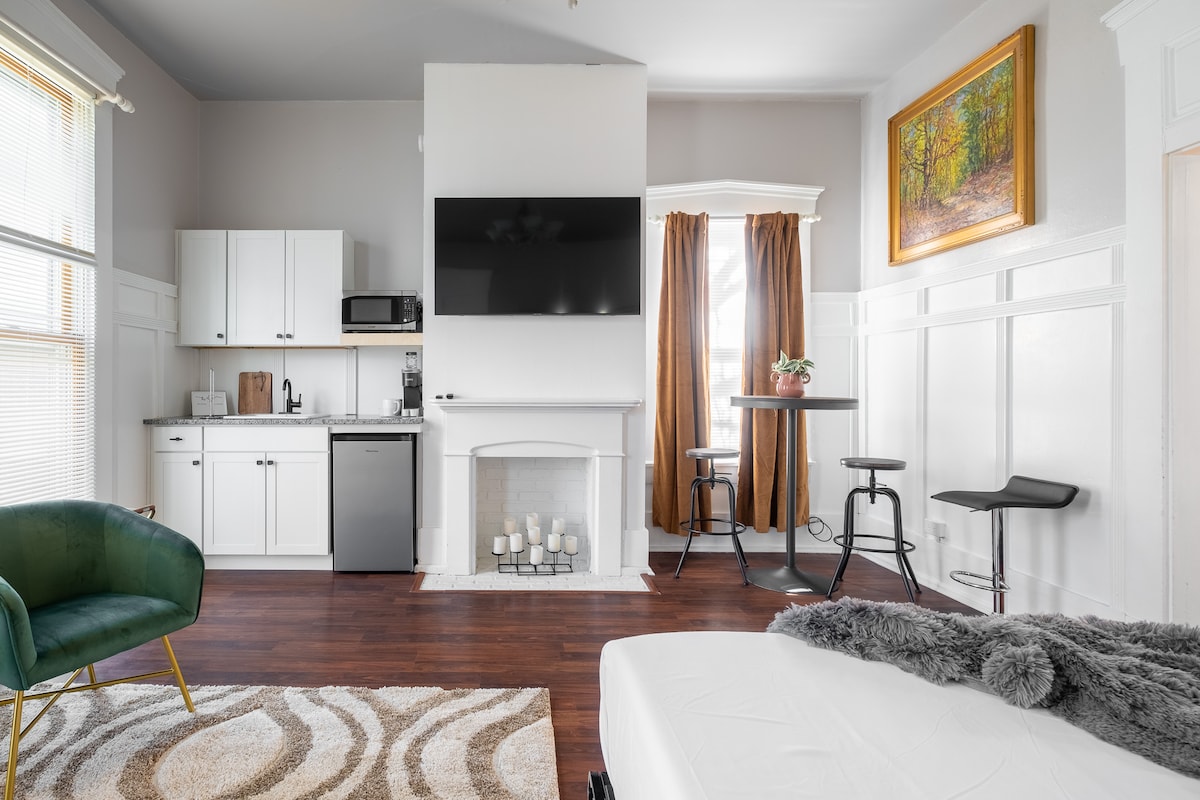
Top demand Airbnb in Columbus
Airbtics has been tracking all Airbnb listings since 2019. This allows us to understand interesting metrics, like which properties earn the most in the market. Here are our top picks. Go to the app to find detailed information about 70 listings.


See 70 listing Statistics
Professional Short-term rental property managers in Columbus
We've compiled a list of host profiles that manage the most Airbnb properties in Columbus. The dashboard shows their average occupancy rate, revenue, and year-over-year changes.
Other short-term rental market data in Columbus
Here is a breakdown of short-let properties in Columbus. You might wonder about more specific data before buying an Airbnb property. For example, how much can an average listing with 4 bedrooms and a pool make? Or, what is the seasonality in booking? When is the peak month? Click the below button and check out more in-depth vacation rental data for free.
Property Size
Amenities
Property Type
Cancelation Policy Type
By Channel Type