Airbnb Revenue in Miami: 2026 Short-Term Rental Data & Insights
Use real short-term rental data to evaluate revenue potential, occupancy rates, and the best investment areas in Miami.
Key indicators as of January 2026
| Metric | Market | 1Y Change | 3Y Change |
|---|---|---|---|
| Revenue | $52K/yr | +16.2% | +22.8% |
| Occupancy Rate | 69% | -4.2% | -1.4% |
| Nightly Rate | $199 | +21.6% | +27.7% |
| Active Listings | 7,236 | +26.2% | +88.5% |
| Regulations | Lenient | – | – |
A typical short-term rental in Miami has a median revenue of $52K in February, 2025 - January 2026, with 7,236 active listings and an occupancy rate of 69%.
Short-term rentals combine two key benefits of real estate investing: long-term property appreciation and relatively high rental yields.
Our market investability grade evaluates how attractive a city is for short-term rental investors. The score is based on factors such as short-term rental yields and year-over-year market trends, compared with other similar markets.
This grade is designed specifically for short-term rental investors looking to evaluate market opportunities.
Miami ranks in the lowest 42% for short-term rental yield nationally.
Location, location, location. When it comes to short-term rentals, location plays a crucial role, but often in a different way than in traditional real estate.
For Airbnb properties, being close to tourist attractions, business districts, or popular neighborhoods usually matters more than being in a quiet residential area with good schools.
This is an important distinction for investors. In many cases, relatively affordable properties can perform very well as short-term rentals if they are located in areas with strong travel demand.
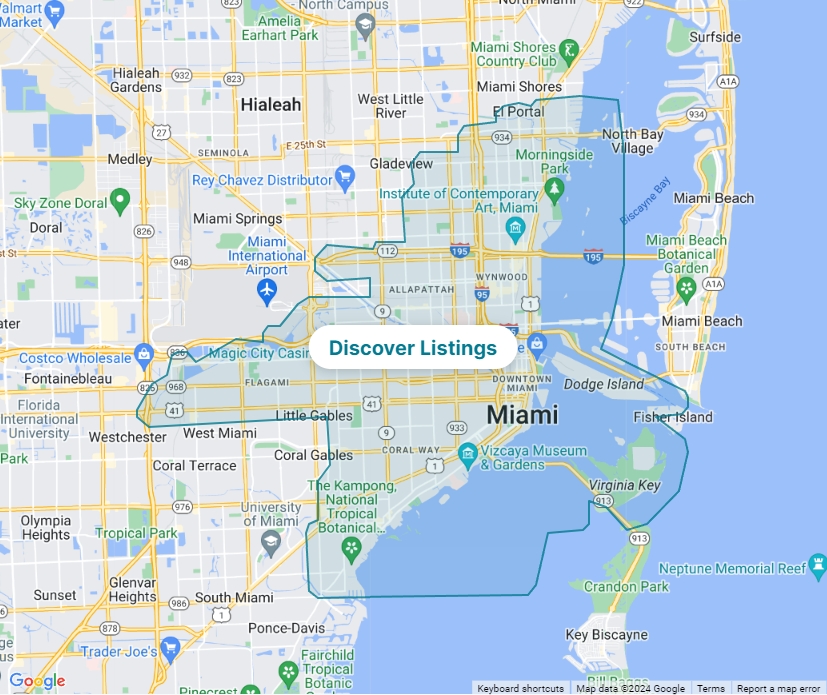
Below are some of the neighborhoods in Miami with active Airbnb markets and strong hosting activity.
Top Airbnb markets in Miami include:
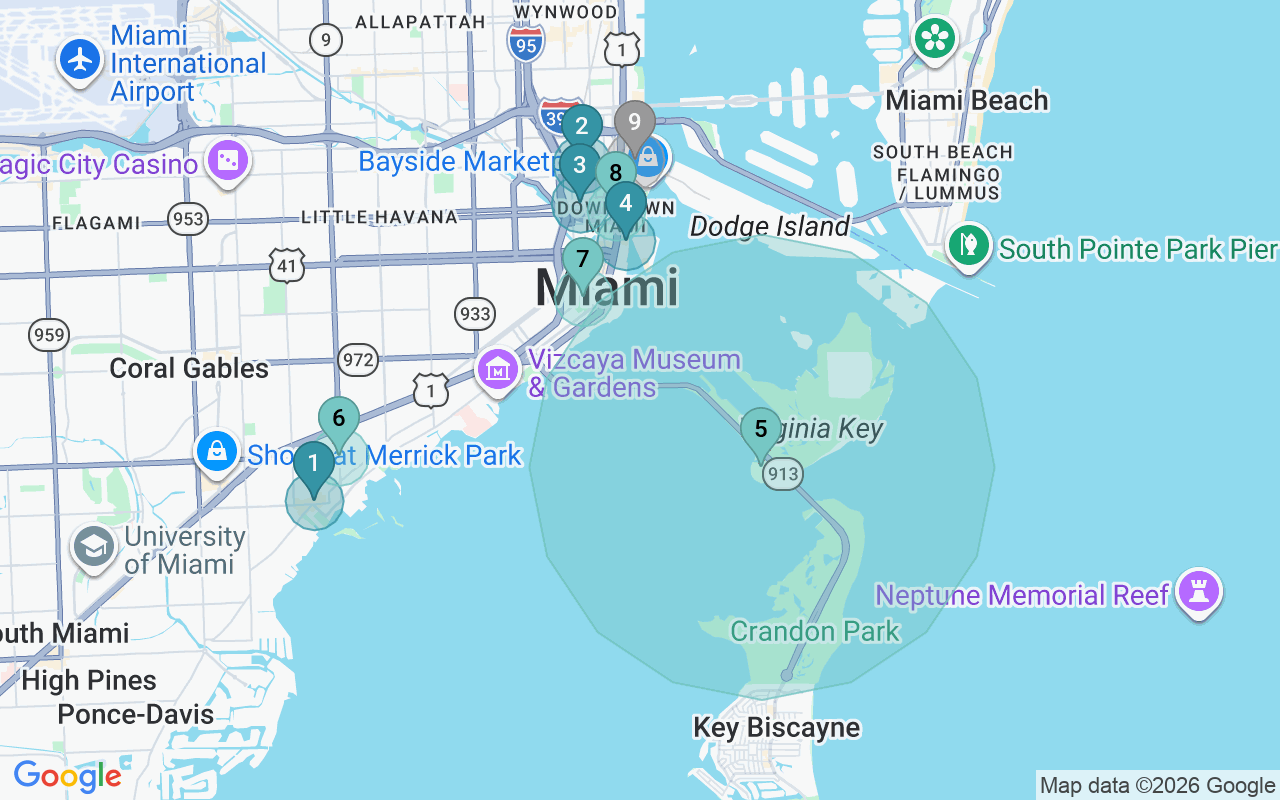
From Airbnb guest reviews, we identified 23 hotspots in Miami: places guests mention when they stay nearby. For each one, we measured the location premium, the extra revenue listings near the hotspot earn compared to similar listings elsewhere in the market.
The strongest hotspot is CocoWalk with a +21% location premium across 270 nearby listings.
| # | Hotspot | Category | Listings | Premium |
|---|---|---|---|---|
| 1 | CocoWalk | Shopping & Retail | 270 | +21% |
| 2 | Brightline Miami | Transport Hubs | 285 | +20% |
| 3 | HistoryMiami Museum | Culture & History | 89 | +20% |
| 4 | Cipriani Downtown Miami | Restaurants & Cafes | 465 | |
| 5 | Miami Seaquarium | Theme Parks & Family | 544 | |
| 6 | Coconut Grove | Neighborhood Areas | 29 | |
| 7 | Brickell | Neighborhood Areas | 210 | |
| 8 | Downtown Miami | Downtown & City Centers | 461 | |
| 9 | Kaseya Center | Sports & Events | 543 | |
| 10 | PortMiami | Transport Hubs | 31 | |
| 11 | Vizcaya Museum and Gardens | Culture & History | 33 | |
| 12 | Venetian Causeway | Landmarks & Attractions | 49 | |
| 13 | South Beach | Beaches & Coastlines | 315 | |
| 14 | Wynwood | Neighborhood Areas | 118 | |
| 15 | Miami River | Lakes, Rivers & Waterfronts | 60 | |
| 16 | Little Havana | Neighborhood Areas | 34 | |
| 17 | Edgewater | Neighborhood Areas | 92 | |
| 18 | Adrienne Arsht Center | Culture & History | 64 | |
| 19 | Flagami | Neighborhood Areas | 39 | |
| 20 | Miami Metrorail | Transport Hubs | 22 | |
| 21 | Versailles Restaurant | Restaurants & Cafes | 45 | |
| 22 | Miami International Airport | Airport | 29 | |
| 23 | Allapattah | Neighborhood Areas | 24 |
Premiums for all 23 hotspots are available in the Airbtics dashboard for Miami.
When it comes to property types, the size of the property is usually the biggest factor. This is most commonly represented by the number of bedrooms. In some cases, the number of beds or bathrooms can matter too, but across most markets bedroom count explains demand the best.
The next important factor is amenities. Pools are often the most impactful, followed by views, outdoor space (balcony or terrace), and hot tubs. Depending on the type of guest a property targets, practical amenities such as kitchens, laundry, or parking can also play an important role — especially for longer stays.
Below is how occupancy rates vary by number of bedrooms in Miami.
Looking at property size together with pricing segments (budget / mid-scale / luxury) often reveals what guests are actually looking for in a market. In some markets demand concentrates on large but affordable homes, while in others smaller luxury listings perform better.
Full property type and pricing data is available in the Airbtics app.
Short-term rental occupancy can vary significantly depending on seasonality, day of the week, and major events. Looking at daily data helps reveal these patterns and shows when demand is strongest in a market.
The chart below shows the daily Airbnb occupancy rate in Miami, representing the percentage of listings that were booked on each day.
Inside the Airbtics platform, you can explore nearly five years of historical daily occupancy data, starting from July 2021.
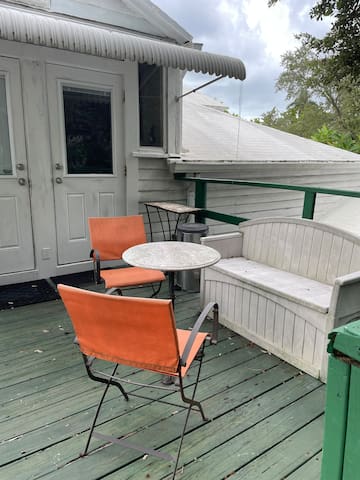
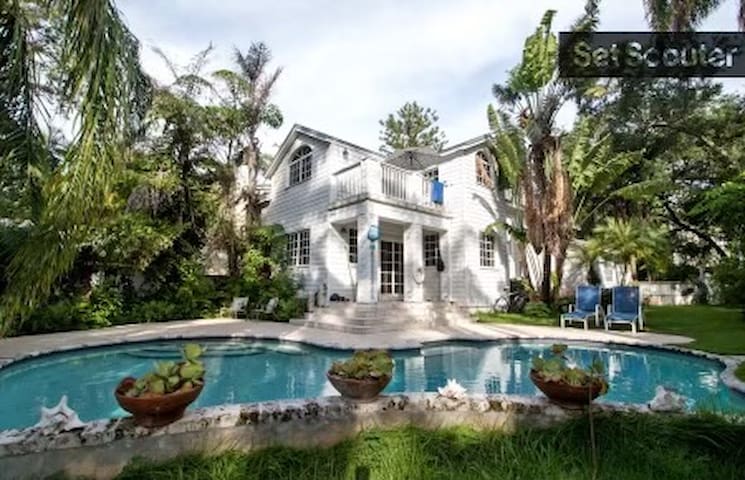
Airbtics has been tracking all Airbnb listings globally since 2019. This allows us to understand interesting metrics, like which properties earn the most in the market. Here are our top picks. Go to the app to find detailed information about 7,236 listings.

The average Miami Airbnb host was able to make $52K in February, 2025 - January 2026. Your actual vacation rental revenue can vary depending on your listing's location, type, size, amenities, target guest persona, property management style, marketing strategy, and other factors. Check out our detailed Miami Airbnb data to see how different factors affect revenue and estimate your potential income.
With an ADR of $199 and a median occupancy rate of 69%, short-term rentals in Miami can be very profitable. However, exactly how much money you can make from Airbnb in Miami is determined by multiple factors. Remember that profitable Airbnb investments start with the best location. Buy an Airbnb property in one of the most profitable locations in Miami.
The return on investment (ROI) on Airbnb properties in Miami depends on factors like the purchase price, rental income, and operating costs. While the exact ROI varies by property, you can get an estimate by using key metrics such as annual rental income, daily rates, and occupancy. In Miami, the annual Airbnb revenue is $52K. To estimate your ROI, compare this income against your property's purchase price and operating expenses. Our Airbnb calculator can help you run the numbers based on your investment and strategy.
The median Airbnb occupancy rate in Miami was 69% in February, 2025 - January 2026. However, your actual occupancy depends on many factors, such as your property type, number of bedrooms, pricing strategy, and marketing efforts.
As of 2026-03-12, there are 7,236 active listings on the Airbnb platform in Miami.