Is it profitable to do Airbnb in Nieuwpoort, Belgium?
What is the occupancy rate of Airbnb in Nieuwpoort, Belgium?
What is the average daily rate of Airbnb in Nieuwpoort, Belgium?
Airbnb Revenue in Nieuwpoort, Belgium: 2025 Short-Term Rental Data & Insights
Average Airbnb Revenue in Nieuwpoort
A typical short-term rental in Nieuwpoort is booked for 197 nights per year, generating a medium Airbnb occupancy rate of 54% and an average daily rate (ADR) of €179 ($193). In September, 2024 - August, 2025, the average annual short-term rental revenue in Nieuwpoort was €34K ($37K). As of 3rd October, 2025, there are 83 active Airbnb listings in Nieuwpoort.
Nieuwpoort Airbnb Income Data Summary
Nieuwpoort Average Monthly Revenue
€2,884 ($3,102)
Nieuwpoort YoY Revenue Change
21.69%
Nieuwpoort Average Airbnb Occupancy Rate
54%
Nieuwpoort Average Daily Rate
€179 ($193)
Mid Scale
Nieuwpoort Number of Listings
83
Small
Airbnb Seasonality in Nieuwpoort
Strong
Most Profitable Month for Airbnb in Nieuwpoort
August
** Period: September, 2024 - August, 2025 | Last Updated on: 3rd October, 2025
Nieuwpoort Airbnb Revenue by Month
September, 2024 - August, 2025
Low
€1,459
Average
€2,816
High
€5,496
Is Airbnb Profitable in Nieuwpoort, Belgium?
Yes, starting an Airbnb business in Nieuwpoort can be very profitable as there is strong short-term rental demand. An average vacation rental revenue of €34,625 ($37,232) and a median occupancy rate of 54% are considered good in the hospitality space. With 83 active listings, the Nieuwpoort Airbnb market is strong but not oversaturated.
Tip: Investing in a short-term rental can be both stable and highly profitable.
Stability: Vacation rentals in a market like Nieuwpoort are a stable investment strategy because they combine investing in real estate and in hospitality. While many potential investors worry about increasingly stricter Airbnb laws, if you can no longer rent out your property on Airbnb, you can convert it into a long-term rental and lease it to tenants on a monthly basis. Monthly rentals yield less, but they are less heavily regulated and even more stable than short-term rentals.
Profitability: Buying an Airbnb property in a city like Nieuwpoort is highly profitable because the monthly cash flow from a short-term rental investment is typically double the rental rate of traditional rentals.
As a Nieuwpoort Airbnb host, you can boost the performance of your short-term rental by choosing the optimal property type and the right property size and furnishing your listing with the most demanded amenities in the area.
Demand by Amenities
Average Airbnb Occupancy Rate in Nieuwpoort
You can find the distribution graph of daily rate and revenue in our market dashboard. A typical Nieuwpoort listing recorded a 54% average short-term rental occupancy between September, 2024 - August, 2025. The Nieuwpoort vacation rental market has Strong seasonality, with August and July being the busiest months for Airbnb hosts.
About 42.67% of Nieuwpoort Airbnb guests are international guests, and visitors from Belgium constitute the largest group. Learn more about guest origin to inform your vacation rental marketing strategy.
On the graph below, you can see the occupancy rate distribution per number of listings.
To view the distribution of average daily rates and annual revenue, refer to our Nieuwpoort market dashboard.
Occupancy Rate: 54%
83 Active Listings
Starting an Airbnb in Nieuwpoort: Short-Term Rental Regulations
Before launching an Airbnb in Nieuwpoort, it's important to understand the local short-term rental rules and regulations. While Airbnb, Vrbo, and similar listing platforms are widely used in Nieuwpoort, the legal landscape can be complex, especially for a beginner host.
In general, Nieuwpoort Airbnb regulations are lenient at the city level, but zoning regulations might apply to some parts of the market. Hosts might be required to register their short-term rentals with local authorities, and there might be limitations on the number of licenses that a single host can hold. You also need to pay applicable Airbnb taxes to make your Nieuwpoort vacation rental business legally compliant.
In general, Nieuwpoort Airbnb regulations are lenient at the city level, but zoning regulations might apply to some parts of the market. Hosts might be required to register their short-term rentals with local authorities, and there might be limitations on the number of licenses that a single host can hold. You also need to pay applicable Airbnb taxes to make your Nieuwpoort vacation rental business legally compliant.
Signup and check out more in-depth vacation rental data for free.
Explore Nieuwpoort's Airbnb Data ⟶
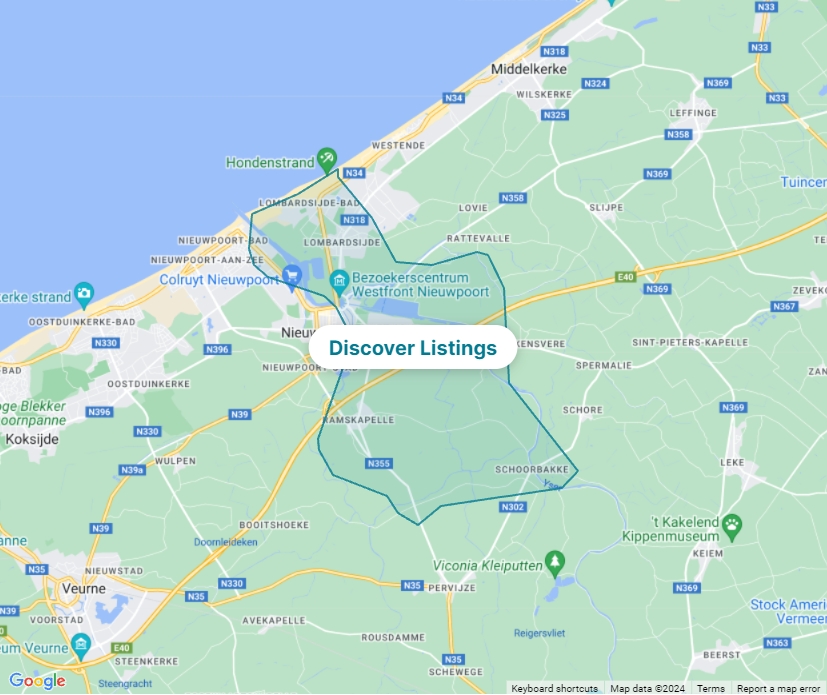
Most Profitable Areas for Vacation Rentals in Nieuwpoort
Wondering where to invest in Nieuwpoort for the best Airbnb returns? Look no further!
The best Airbnb markets in Nieuwpoort are:
The best Airbnb markets in Nieuwpoort are:
- Sint-Joris
- Airbnb Annual Revenue: €35,942 ($38,648)
- Airbnb Occupancy Rate: 52%
- Airbnb Average Daily Rate: €186 ($200)
Find the top Airbnb location in Nieuwpoort for your specific needs and aspirations.
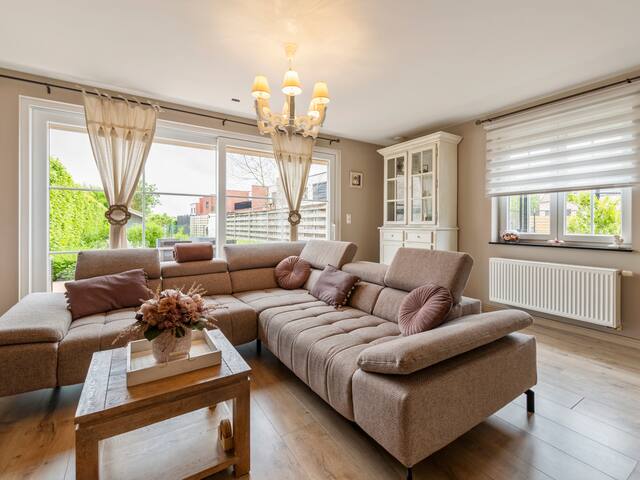
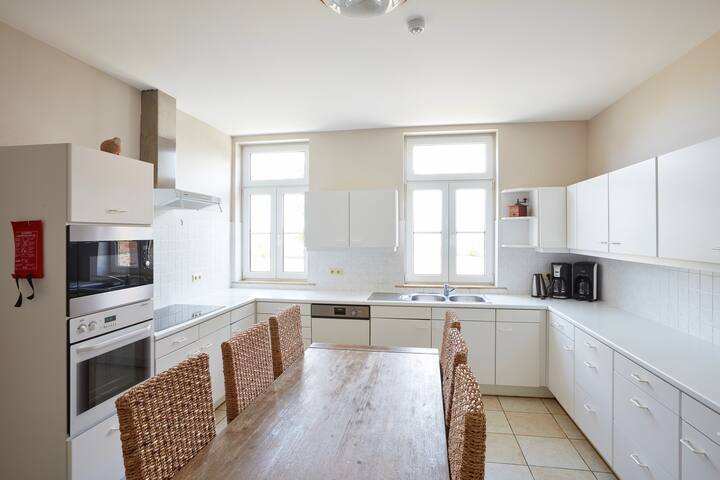
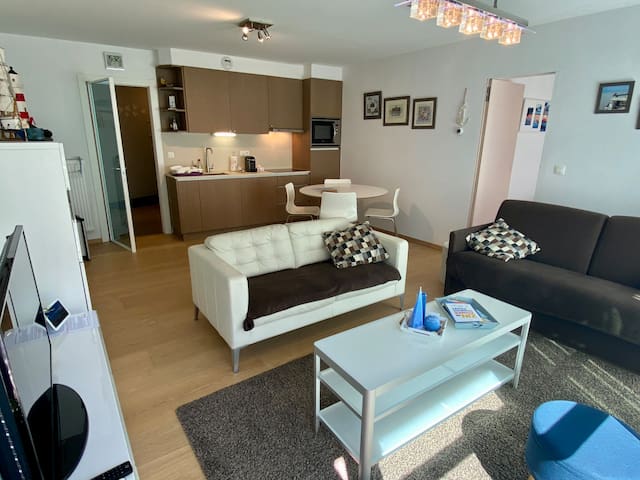
Most Popular Airbnbs in Nieuwpoort
Airbtics has been tracking all Airbnb listings since 2019. This allows us to understand interesting metrics, like which properties earn the most in the market. Here are our top picks. Go to the app to find detailed information about 83 listings.
See Airbnb Statistics on All 83 Listings
Professional Airbnb Property Managers in Nieuwpoort
You can turn your Nieuwpoort Airbnb investment into a source of passive income and navigate the short-term rental regulatory framework easily by hiring one of the best Airbnb property management companies in the area.
To help you get started, we’ve compiled a list of the professional short-term rental property managers in Nieuwpoort with the most Airbnb properties.
To help you get started, we’ve compiled a list of the professional short-term rental property managers in Nieuwpoort with the most Airbnb properties.
| Name | Listings | Rating | Revenue |
|---|---|---|---|
| World Of Superhost | 52 | 4.6★ | $1,23,234 |
| Holiday Suites | 47 | 4.3★ | $1,23,234 |
| Novasol | 499 | 4.4★ | $1,23,234 |
| Novasol | 248 | 4.7★ | $1,23,234 |
Find out the top Airbnb management company in Nieuwpoort, Belgium for your needs.
Other short-term rental market data in Nieuwpoort
Here is a breakdown of short-let properties in Nieuwpoort. You might wonder about more specific data before buying an Airbnb property. For example, how much can an average listing with 4 bedrooms and a pool make? Or, what is the seasonality in booking? When is the peak month? Click the below button and check out more in-depth vacation rental data for free.
Nieuwpoort Airbnb Listings by Property Size
Nieuwpoort Airbnb Listings by Property Type
Nieuwpoort Airbnb Listings by Cancelation Policy Type
Nieuwpoort Vacation Rentals by Channel
Estimate Your Potential Earnings in Nieuwpoort with the Airbtics Airbnb Calculator
Ready to start looking for the most profitable Airbnb investment opportunities in Nieuwpoort?
Use our Airbnb income calculator to instantly get an accurate estimate of the earning potential of any neighborhood and area.
Use our Airbnb income calculator to instantly get an accurate estimate of the earning potential of any neighborhood and area.
Nieuwpoort Airbnb FAQs
How Much Can You Make on Airbnb in Nieuwpoort, Belgium?
The average Nieuwpoort Airbnb host was able to make €34K ($37K) in September, 2024 - August, 2025. Your actual vacation rental revenue can vary depending on your listing's location, type, size, amenities, target guest persona, property management style, marketing strategy, and other factors. Check out our detailed Nieuwpoort Airbnb data to see how different factors affect revenue and estimate your potential income.
How Profitable Is Airbnb in Nieuwpoort?
With an ADR of €179 ($193) and a median occupancy rate of 54%, short-term rentals in Nieuwpoort can be very profitable. However, exactly how much money you can make from Airbnb in Nieuwpoort is determined by multiple factors. Remember that profitable Airbnb investments start with the best location. Buy an Airbnb property in one of the most profitable locations in Nieuwpoort.
What Is the ROI on Airbnb in Nieuwpoort?
The return on investment (ROI) on Airbnb properties in Nieuwpoort depends on factors like the purchase price, rental income, and operating costs. While the exact ROI varies by property, you can get an estimate by using key metrics such as annual rental income, daily rates, and occupancy.In Nieuwpoort, the annual Airbnb revenue is €34K ($37K). To estimate your ROI, compare this income against your property's purchase price and operating expenses. Our Airbnb calculator can help you run the numbers based on your investment and strategy.
What Is the Average Occupancy Rate for Airbnb in Nieuwpoort?
The median Airbnb occupancy rate in Nieuwpoort was 54% in September, 2024 - August, 2025. However, your actual occupancy depends on many factors, such as your property type, number of bedrooms, pricing strategy, and marketing efforts.
How Many Airbnbs Are There in Nieuwpoort?
As of March 2025, there are 83 active listings on the Airbnb platform in Nieuwpoort.