Is it profitable to do Airbnb in Aventura, United States?
What is the occupancy rate of Airbnb in Aventura, United States?
What is the average daily rate of Airbnb in Aventura, United States?
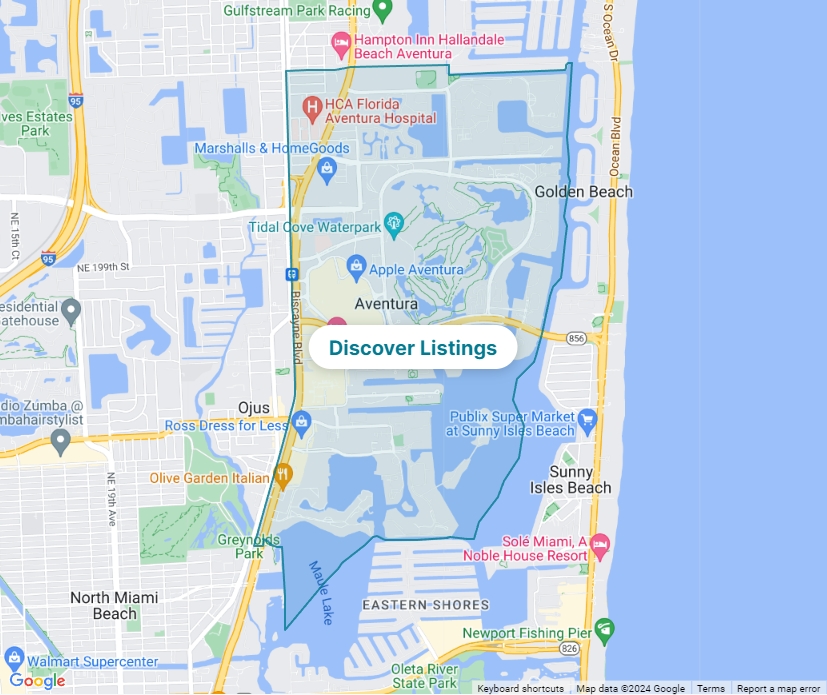
The United States / Aventura
Aventura, Rental Market Statistics & Data, United States
A typical rental in Aventura is priced at $3,419 per month. As of 16th November, 2024, there are 543 rentals available in Zillow.
Median Rent Price: $3,419/month
1 bedroom Rent Price
$2,327
3 bedrooms Rent Price
$5,238
Number of available rentals
543
** Last Updated on: 16th November, 2024
Rent price vs number of available rental distribution in Aventura
Rental listings in Aventura
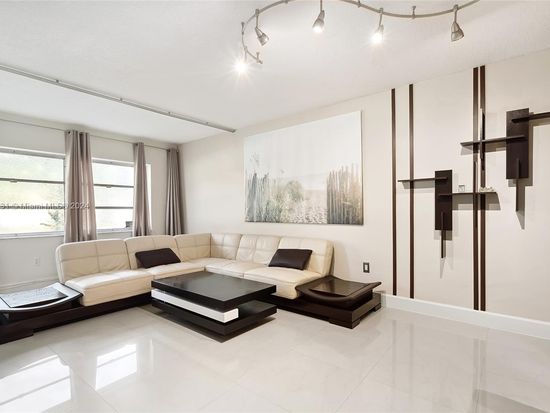
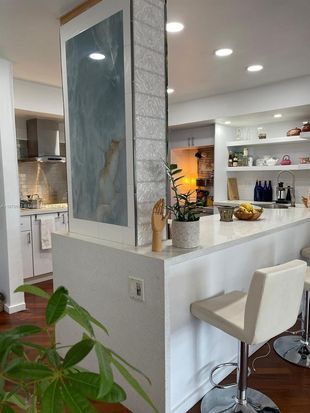
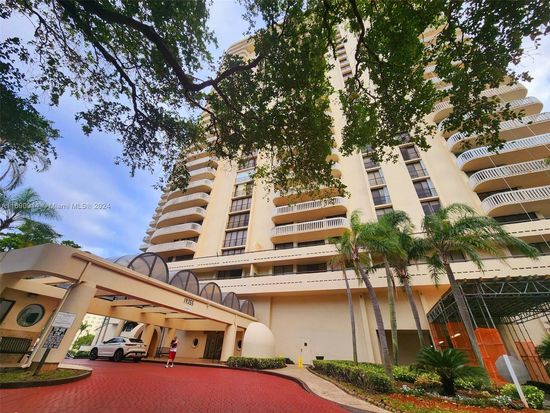
See 189 listing Statistics
Short-term rental statistics in Aventura?
A typical short-term rental listing in Aventura is booked for 263 nights a year, with a median occupancy rate of 72% and an average daily rate of $179. In 2023, a typical host income (annual revenue) was $47,266. As of 16th November, 2024, there are 189 active Airbnb listings. See short-term rental data in Aventura.
Signup and check out more in-depth vacation rental data for free.
Explore Aventura's Airbnb Data ⟶