














Explore listings in Singapore
Compare the 1,142 listings tracked in Singapore. Filter by property type, review revenue history, and build your own comp set in the Airbtics app.
Compare 10 leading Airbnb listings in Singapore, ranked by the Airbtics Listing Score, a score out of 100 based on guest reviews, Guest Favorite status, and occupancy compared with the market median over the same period. See guest ratings, occupancy, average daily rates, and estimated annual revenue for each property.
Listings are ranked by the Airbtics Listing Score, a score out of 100 based on guest reviews, Guest Favorite status, and occupancy over the last 12 months.
| Factor | Maximum points |
|---|---|
| Guest rating (vs. a 4.3 floor) | 30 |
| Guest Favorite badge | 30 |
| Occupancy (last 12 months) | 30 |
| Operating scale (listing-months) | 10 |
When listings tie on the same score, the listing with more guest reviews ranks higher — a larger review history gives stronger evidence of sustained performance.
Revenue and nightly rate are shown separately so you can compare commercial performance alongside the score. This leaderboard highlights strong guest experience and booking performance — not the market’s highest earners by revenue alone.
| Listings tracked | Median occupancy | Median daily rate | Median annual revenue |
|---|---|---|---|
| 1,142 | 48% | SGD183 | SGD32,826 |
Market figures cover Sep 2025–Sep 2026 and provide context for the leaderboard below. See the full Singapore Market Overview →
Ranked by Listing Score among the 1,142 active Airbnb listings Airbtics tracks in Singapore. When listings tie on the same score, the one with more guest reviews ranks higher.
| Rank | Listing Scoreout of 100 | Airbnb listing | Guest rating | Occupancy | Average daily rate | Estimated annual revenue | Listing Insights |
|---|---|---|---|---|---|---|---|
| #1 | 90 | 83% | SGD179 | SGD39,861 | View listing | ||
| #2 | 90 | 80% | SGD149 | SGD32,468 | View listing | ||
| #3 | 90 | 85–100% | SGD427 | SGD138,507 | View listing | ||
| #4 | 90 | 85–100% | SGD184 | SGD57,382 | View listing | ||
| #5 | 90 | 85–100% | SGD176 | SGD58,350 | View listing | ||
| #6 | 90 | 85–100% | SGD108 | SGD37,706 | View listing | ||
| #7 | 90 | 85–100% | SGD163 | SGD25,799 | View listing | ||
| #8 | 90 | 83% | SGD56 | SGD17,062 | View listing | ||
| #9 | 90 | 85–100% | SGD108 | SGD14,361 | View listing | ||
| #10 | 90 | 85–100% | SGD145 | SGD31,331 | View listing |
Data note: Every featured listing held Airbnb’s Guest Favorite badge as of 2026-10-29. Occupancy above 85% is shown as 85–100%. Revenue, occupancy and daily rates are Airbtics estimates for the stated data period.
Compare the 1,142 listings tracked in Singapore. Filter by property type, review revenue history, and build your own comp set in the Airbtics app.
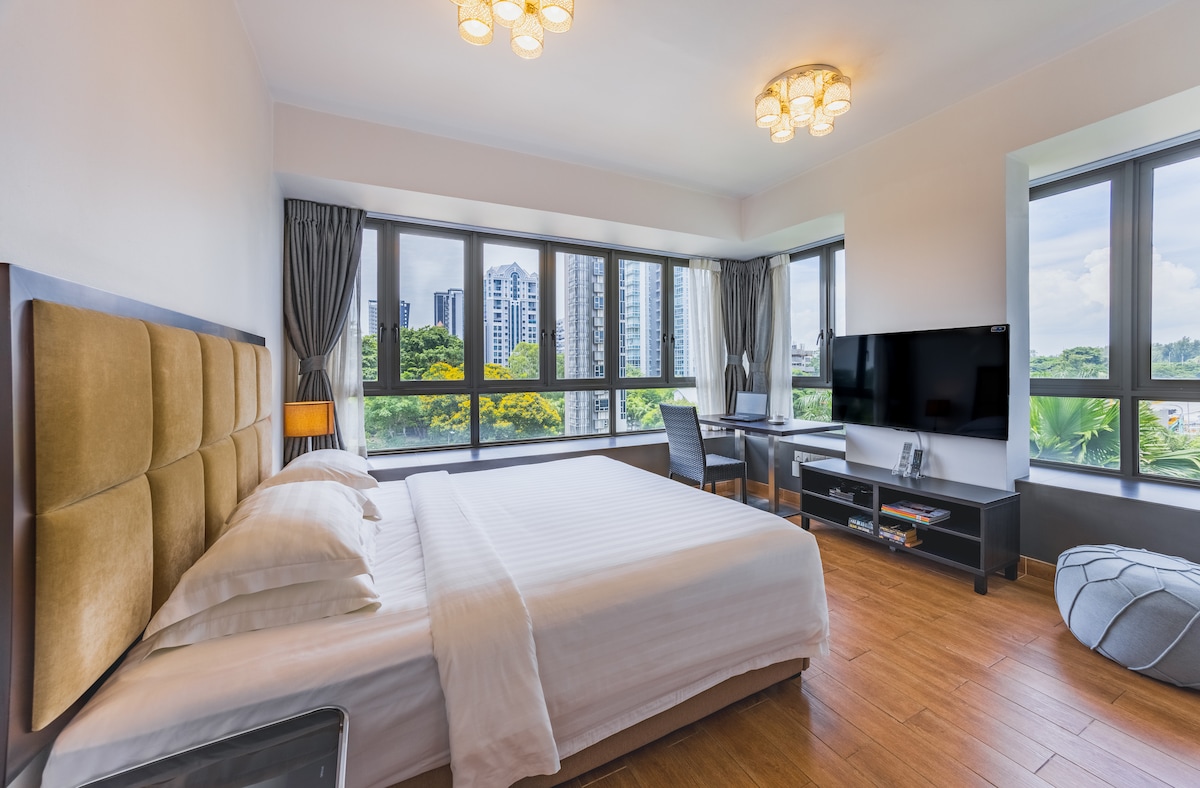
Cozy Studio Chic Apt with WiFi in Kallang ranks first on this leaderboard with a Listing Score of 90 out of 100. It has a 4.8 guest rating from 318 reviews and an estimated occupancy rate 83% during Sep 2025–Sep 2026. The table shows how it compares with the other featured listings.
Listings are ranked by the Airbtics Listing Score, which considers guest reviews, Guest Favorite status, and occupancy compared with similar local properties. When listings tie on the same score, the listing with more guest reviews ranks higher. To qualify, a listing must meet Airbnb rating data, at least 90 active days in the last 12 months, and occupancy data available.
The score evaluates the combination of guest experience and booking performance. Revenue and nightly rate are shown separately so you can compare commercial performance alongside the score.
Among the 10 featured listings with revenue estimates, estimated annual revenue ranges from SGD14,361 to SGD138,507, with a median of SGD35,087, during Sep 2025–Sep 2026.
These figures describe the listings featured on this leaderboard. For a broader view, see Airbnb revenue across Singapore.
The featured listings with occupancy estimates have a median occupancy rate above 85%, compared with 48% across Singapore during Sep 2025–Sep 2026.
Listing occupancy above 85% is shown as a band (85–100%) rather than an exact figure.
Guest Favorite is an Airbnb badge identifying homes that stand out based on ratings, reviews and reliability. It applies to an individual listing.
Every listing featured on this leaderboard held the Guest Favorite badge as of 2026-10-29. Learn how Airbnb identifies Guest Favorites →
Use the leaderboard to discover properties worth investigating, then choose comps that match your property’s location, bedrooms, property type and amenities. Include a wider range of comparable properties when estimating expected revenue, because this leaderboard highlights leading listings.
You can filter listings and build your own comp set in the Airbtics app.
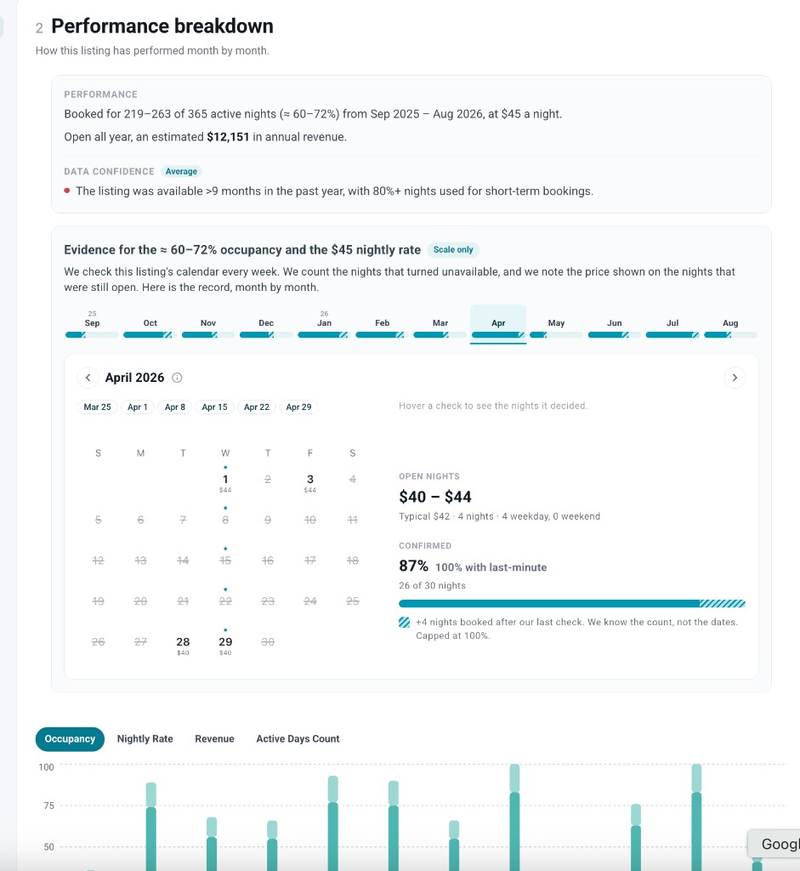
Open Listing Insights to review the property’s historical revenue, occupancy and nightly rates. You can also inspect calendar snapshots showing the availability and prices recorded over time.
See up to three years of estimated monthly revenue, occupancy and nightly rates for an individual listing. Investigate how its performance changes through the seasons and how it compares with the wider market. If you have an address in mind, use our calculator to estimate income for a specific property.
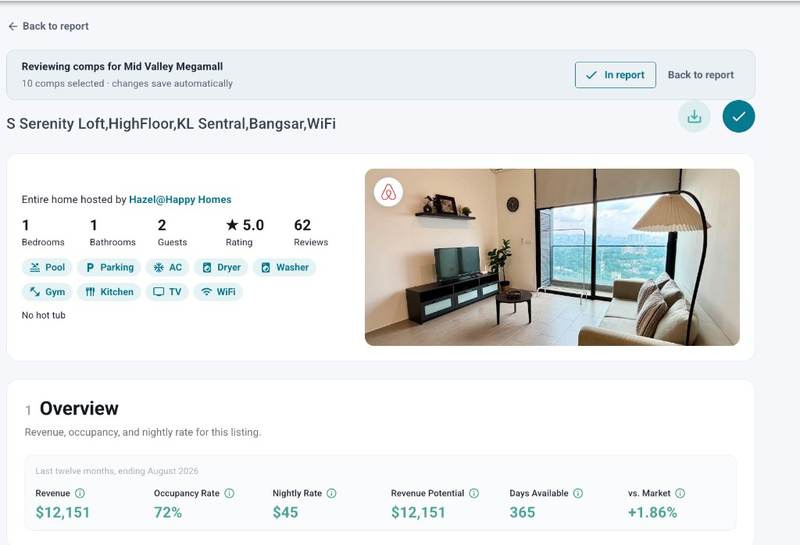
Review calendar snapshots from the last 12 months to see which nights were available or unavailable when Airbtics checked, along with the prices recorded for available nights.
An unavailable night can reflect a booking or an owner block. The snapshots give you a record of the observed calendar, so you can inspect the evidence alongside the estimated performance.
Historical coverage varies by listing.