Quick facts
All statistics below is collected and processed from Airbtics, unless specified otherwise.
The observation period is between 2023 October to 2024 September.
- Average length of stay on Airbnb in Sag Harbor is
5.0 days.
- There are 110 active Airbnb listings.
- The most common group size of Airbnb booking is 4.7 people
- A typical listing was booked for 50% of available
nights.
- On average Airbnb users paid for $585 per
night for each night of stay. (excluding airbnb service fee and cleaning fee)
- On average Airbnb users spent
$2750 for
5.0 nights of stay on Airbnb in Sag Harbor.
How does visitor number changes throughout the year?
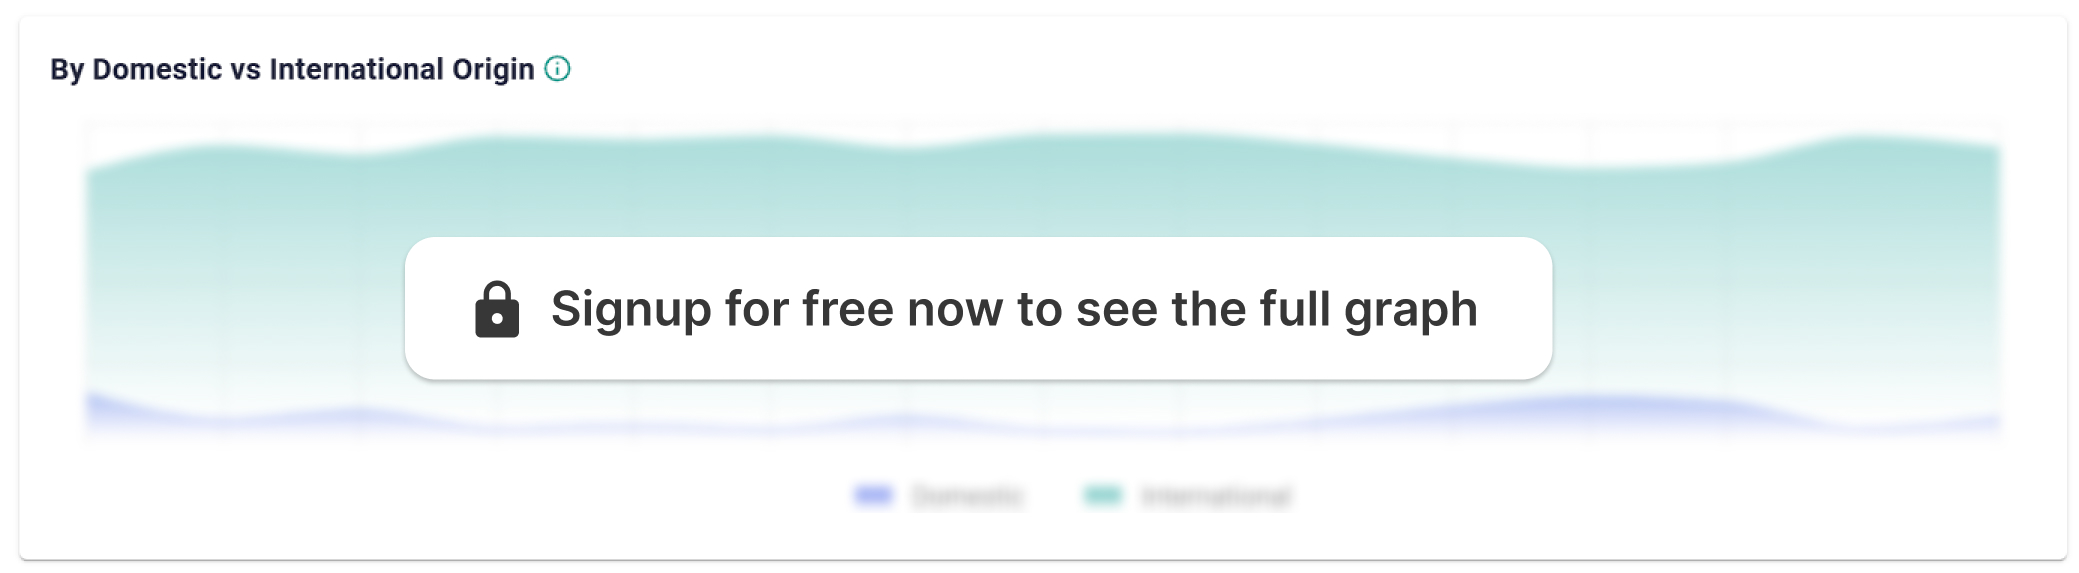
This graph shows how does the number of visitor changes throughout the year, and shows peak season. As you can see, the peak season is July. The number of visitors per month are assumed using various data sources Airbtics collected.