











Best Airbnb Markets in Caribbean (2026)

Based on Airbtics data from September 2025 to August 2026, this page ranks the best Airbnb markets in Caribbean by Market Grade. The grade compares short-term rental yield, year-over-year revenue growth, and occupancy (demand), then adjusts for local regulation. The table also shows listing count, average daily rate, and annual revenue for every market.

Markets on this page are ranked by the Airbtics Market Grade, not by the number of listings. The grade compares each market with the other markets in this ranking on three measures, then adjusts for local short-term rental regulation.

  1. Yield: Annual short-term rental revenue divided by property price. A higher yield ranks higher.
  2. Growth: Year-over-year change in revenue. Faster revenue growth ranks higher.
  3. Demand: Average occupancy rate over the last 12 months. Higher occupancy ranks higher.

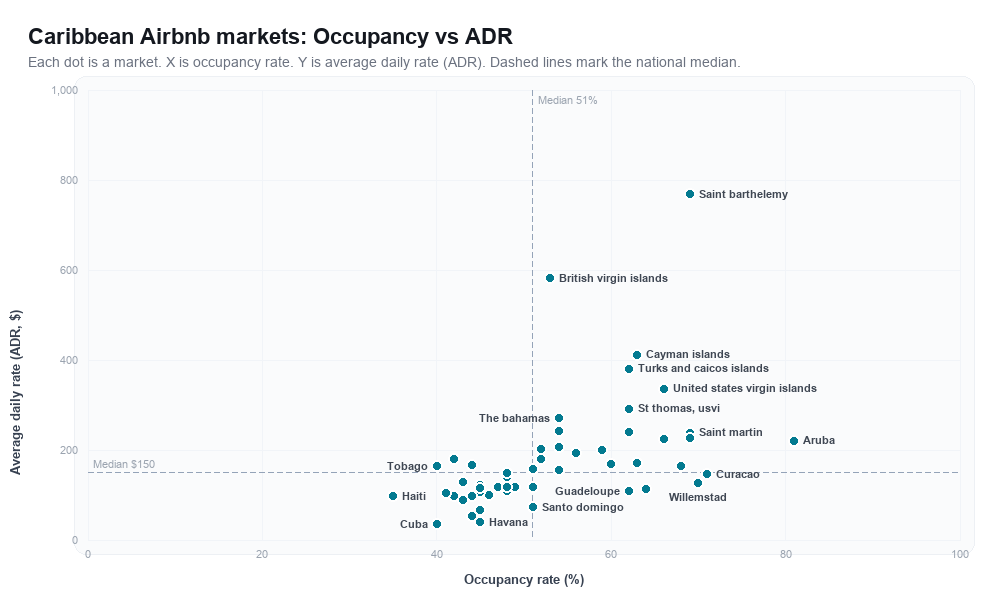
Stricter short-term rental regulation lowers the letter grade. Occupancy, average daily rate, and annual revenue are shown for every market. Exact yield and revenue growth are published for the three highest-graded markets. For every other market those two figures are in Market Explorer. The rankboard plots the same markets by occupancy and average daily rate, and the table under the chart lists those values in text.

Learn more about how we collect the data and accuracy

Last updated: 16th October, 2026

Caribbean Short-Term Rental Market Overview (September 2025 to August 2026)

National averages across all Caribbean markets
Average Occupancy Rate i
53.45%
Average Annual Revenue i
$38,181
Average Daily Rate (ADR) i
$179
YoY Supply Growth i
34.08%
YoY Revenue Change i
6.72%

Top 55 Caribbean Cities for Airbnb in 2026

Tick the markets you like to track their revenue, occupancy, and ADR in your Airbtics watchlist. Free to start, up to 10 markets.

Position Market Grade Market Name Regulation No of Listings Avg. Occupancy Rate Avg. Daily Rate Revenue Short-term Rental Yield Revenue Growth
1APuerto Rico
Unknown
21,88460%$170$38,95515.9%+4.7%
2AAruba
Lenient
4,31681% 🚀$221$67,49922.9%+20.8%
3ACURACAO
Lenient
3,40671% 🚀$146$38,80815.8%+13.9%
4APortmore, Jamaica
Lenient
45646%$100$17,270Unlock in Market ExplorerUnlock in Market Explorer
5ASaint Martin
Lenient
22569%$238$60,800Unlock in Market ExplorerUnlock in Market Explorer
6ASaint Martin
Unknown
21869%$226$57,692Unlock in Market ExplorerUnlock in Market Explorer
7ATrinidad And Tobago
Lenient
13845%$115$19,489Unlock in Market ExplorerUnlock in Market Explorer
8BJamaica
Lenient
9,54045%$122$20,636Unlock in Market ExplorerUnlock in Market Explorer
9BThe Bahamas
Lenient
3,82954%$271$55,014Unlock in Market ExplorerUnlock in Market Explorer
10BNassau
Lenient
1,49756%$194$41,004Unlock in Market ExplorerUnlock in Market Explorer
11BRio Grande
Lenient
78262%$240$56,412Unlock in Market ExplorerUnlock in Market Explorer
12BVieques
Lenient
59159%$200$44,786Unlock in Market ExplorerUnlock in Market Explorer
13BAnguilla, Eastern Caribbean
Lenient
38154%$243$49,015Unlock in Market ExplorerUnlock in Market Explorer
14BMandeville, JM
Lenient
12544%$98$16,099Unlock in Market ExplorerUnlock in Market Explorer
15BSt Kitts and Nevis
Lenient
6452%$203$39,204Unlock in Market ExplorerUnlock in Market Explorer
16B+Willemstad
Lenient
2,40870%$127$33,288Unlock in Market ExplorerUnlock in Market Explorer
17B+Kingston
Lenient
2,01351%$118$22,641Unlock in Market ExplorerUnlock in Market Explorer
18B+Cayman Islands
Lenient
1,09663%$412$97,139Unlock in Market ExplorerUnlock in Market Explorer
19B+St Thomas, USVI
Lenient
19662%$292$67,991Unlock in Market ExplorerUnlock in Market Explorer
20B+St Croix, USVI
Lenient
10454%$207$41,984Unlock in Market ExplorerUnlock in Market Explorer
21CDominican Republic
Unknown
34,24343%$90$14,581Unlock in Market ExplorerUnlock in Market Explorer
22CSanto Domingo
Lenient
4,58751%$73$14,039Unlock in Market ExplorerUnlock in Market Explorer
23CBarbados
Lenient
3,74663%$172$40,266Unlock in Market ExplorerUnlock in Market Explorer
24CLas Terrenas
Lenient
2,30048%$147$26,314Unlock in Market ExplorerUnlock in Market Explorer
25CKingston, Jamaica
Lenient
2,01751%$118$22,641Unlock in Market ExplorerUnlock in Market Explorer
26CSosua
Lenient
1,59343%$128$20,490Unlock in Market ExplorerUnlock in Market Explorer
27CRincon
Lenient
1,18156%$193$41,087Unlock in Market ExplorerUnlock in Market Explorer
28CSint Maarten
Unknown
1,18166%$224$55,237Unlock in Market ExplorerUnlock in Market Explorer
29CSaint Barthelemy
Strict
61069%$768$194,717Unlock in Market ExplorerUnlock in Market Explorer
30CUnited States Virgin Islands
Unknown
27766%$336$82,742Unlock in Market ExplorerUnlock in Market Explorer
31CNegril, JM
Lenient
21445%$106$17,982Unlock in Market ExplorerUnlock in Market Explorer
32CHaiti
Unknown
20035%$97$12,782Unlock in Market ExplorerUnlock in Market Explorer
33CTreasure Beach, Jamaica
Lenient
14342%$179$27,897Unlock in Market ExplorerUnlock in Market Explorer
34CTobago
Lenient
11640%$164$24,269Unlock in Market ExplorerUnlock in Market Explorer
35CBritish Virgin Islands
Unknown
7153%$582$113,488Unlock in Market ExplorerUnlock in Market Explorer
36C+Guadeloupe
Strict
5,84662%$108$25,034Unlock in Market ExplorerUnlock in Market Explorer
37C+San Juan
Lenient
5,24868%$165$42,903Unlock in Market ExplorerUnlock in Market Explorer
38C+Montego Bay, Jamaica
Lenient
93449%$117$21,525Unlock in Market ExplorerUnlock in Market Explorer
39C+Ocho Rios, Jamaica
Lenient
78248%$140$25,328Unlock in Market ExplorerUnlock in Market Explorer
40C+Dominica
Lenient
77641%$104$16,004Unlock in Market ExplorerUnlock in Market Explorer
41C+Isabela
Lenient
66654%$156$32,308Unlock in Market ExplorerUnlock in Market Explorer
42C+Turks and Caicos Islands
Lenient
20862%$380$87,684Unlock in Market ExplorerUnlock in Market Explorer
43C+Antigua and Barbuda
Lenient
16252%$181$35,014Unlock in Market ExplorerUnlock in Market Explorer
44C+Runaway Bay, Jamaica
Lenient
14544%$167$27,320Unlock in Market ExplorerUnlock in Market Explorer
45DSantiago de los Caballeros
Lenient
2,84045%$66$11,260Unlock in Market ExplorerUnlock in Market Explorer
46DGrenada
Lenient
87648%$117$21,038Unlock in Market ExplorerUnlock in Market Explorer
47DSaint Vincent and the Grenadines
Unknown
5751%$158$29,862Unlock in Market ExplorerUnlock in Market Explorer
48D+Martinique
Lenient
6,89664%$114$27,278Unlock in Market ExplorerUnlock in Market Explorer
49D+Punta Cana - Caribers
Lenient
5,78447%$118$20,893Unlock in Market ExplorerUnlock in Market Explorer
50D+Havana
Lenient
3,67945%$39$6,549Unlock in Market ExplorerUnlock in Market Explorer
51D+Santo Domingo Este
Lenient
1,82644%$54$9,002Unlock in Market ExplorerUnlock in Market Explorer
52D+Puerto Plata
Lenient
1,40642%$98$15,443Unlock in Market ExplorerUnlock in Market Explorer
53D+Cabarete
Lenient
1,34548%$108$19,237Unlock in Market ExplorerUnlock in Market Explorer
54ECuba
Unknown
7,03140%$35$5,231Unlock in Market ExplorerUnlock in Market Explorer
55E+Saint Lucia
Lenient
26048%$150$26,800Unlock in Market ExplorerUnlock in Market Explorer

Data Seen By

Market Explorer

Filter markets by occupancy, price, and yield

Filter Caribbean by occupancy, ADR, yield, rent gap, and property price, then compare markets side by side.

Open Explorer

Find the Best Airbnb Markets with Our Interactive Tool

Use our interactive Market Explorer to find the best places to start an Airbnb in Caribbean. Compare multiple markets side by side, apply filters like regulations, budget (property or rent prices), and market size, and even export the results to Excel.

Explore Interactive Tool

Why Invest in Airbnb Caribbean in 2026?

The highest-graded short-term rental markets in Caribbean are Puerto Rico, Aruba and CURACAO. The table ranks every tracked market by Airbtics Market Grade. Occupancy, average daily rate, annual revenue, yield, and revenue growth are the figures behind that grade.

Top 3 Airbnb markets in Caribbean by Market Grade

These are the three highest-graded Airbnb markets in Caribbean. Market Grade compares yield, revenue growth, and occupancy (demand) with the other markets on this page, then adjusts for short-term rental regulation. The chart repeats those three percentiles in text so the ranking is readable without the graphic.

Rank 1 — Puerto Rico (Grade A)

Puerto Rico is rank 1 of 55 markets in this Caribbean ranking by Airbtics Market Grade A, with 15.9% short-term rental yield, 60.0% occupancy, and +4.7% year-over-year revenue growth.

Compared with the other markets on this page, Puerto Rico ranks top 30% for yield, lowest 41% for growth, and top 30% for demand. The market shows an average daily rate of $170, annual revenue of $38,955, a rent gap of 3205.2%, 21,884 active listings, and a typical 2-bedroom property price of $250,000.

  • Market gradeA
  • Yield15.9%
  • Revenue growth+4.7%
  • Occupancy60.0%
  • Average daily rate$170
  • Annual revenue$38,955
  • Rent gap3205.2%
  • Active listings21,884
  • 2-bedroom price$250,000
top 30%Yieldlowest 41%Growthtop 30%Demand

Percentile versus other Caribbean markets on this page. Farther from the center is stronger.

  • Yield: top 30%
  • Growth: lowest 41%
  • Demand: top 30%

Rank 2 — Aruba (Grade A)

Aruba is rank 2 of 55 markets in this Caribbean ranking by Airbtics Market Grade A, with 22.9% short-term rental yield, 81.0% occupancy, and +20.8% year-over-year revenue growth.

Compared with the other markets on this page, Aruba ranks top 6% for yield, top 10% for growth, and top 1% for demand. The market shows an average daily rate of $221, annual revenue of $67,499, a rent gap of 5251.3%, 4,316 active listings, lenient short-term rental regulation, and a typical 2-bedroom property price of $350,000.

  • Market gradeA
  • Yield22.9%
  • Revenue growth+20.8%
  • Occupancy81.0%
  • Average daily rate$221
  • Annual revenue$67,499
  • Rent gap5251.3%
  • Active listings4,316
  • 2-bedroom price$350,000
  • RegulationLenient
top 6%Yieldtop 10%Growthtop 1%Demand

Percentile versus other Caribbean markets on this page. Farther from the center is stronger.

  • Yield: top 6%
  • Growth: top 10%
  • Demand: top 1%

Rank 3 — CURACAO (Grade A)

CURACAO is rank 3 of 55 markets in this Caribbean ranking by Airbtics Market Grade A, with 15.8% short-term rental yield, 71.0% occupancy, and +13.9% year-over-year revenue growth.

Compared with the other markets on this page, CURACAO ranks top 35% for yield, top 19% for growth, and top 3% for demand. The market shows an average daily rate of $146, annual revenue of $38,808, a rent gap of 3182.4%, 3,406 active listings, lenient short-term rental regulation, and a typical 2-bedroom property price of $250,000.

  • Market gradeA
  • Yield15.8%
  • Revenue growth+13.9%
  • Occupancy71.0%
  • Average daily rate$146
  • Annual revenue$38,808
  • Rent gap3182.4%
  • Active listings3,406
  • 2-bedroom price$250,000
  • RegulationLenient
top 35%Yieldtop 19%Growthtop 3%Demand

Percentile versus other Caribbean markets on this page. Farther from the center is stronger.

  • Yield: top 35%
  • Growth: top 19%
  • Demand: top 3%

Market Rankboard: Caribbean

Each dot is a vacation rental market in Caribbean, plotted by occupancy rate (x-axis) and average daily rate (ADR) (y-axis). Dashed lines mark the national median.

Caribbean Airbnb markets rankboard scatter chart showing occupancy rate versus average daily rate (ADR)
Occupancy rate and average daily rate for each Caribbean market plotted in the chart above, in Market Grade order.
MarketOccupancy rateAverage daily rate
Puerto Rico60.0%$170
Aruba81.0%$221
CURACAO71.0%$146
Portmore, Jamaica46.0%$100
Saint Martin69.0%$238
Saint Martin69.0%$226
Trinidad And Tobago45.0%$115
Jamaica45.0%$122
The Bahamas54.0%$271
Nassau56.0%$194
Rio Grande62.0%$240
Vieques59.0%$200
Anguilla, Eastern Caribbean54.0%$243
Mandeville, JM44.0%$98
St Kitts and Nevis52.0%$203
Willemstad70.0%$127
Kingston51.0%$118
Cayman Islands63.0%$412
St Thomas, USVI62.0%$292
St Croix, USVI54.0%$207
Dominican Republic43.0%$90
Santo Domingo51.0%$73
Barbados63.0%$172
Las Terrenas48.0%$147
Kingston, Jamaica51.0%$118
Sosua43.0%$128
Rincon56.0%$193
Sint Maarten66.0%$224
Saint Barthelemy69.0%$768
United States Virgin Islands66.0%$336
Negril, JM45.0%$106
Haiti35.0%$97
Treasure Beach, Jamaica42.0%$179
Tobago40.0%$164
British Virgin Islands53.0%$582
Guadeloupe62.0%$108
San Juan68.0%$165
Montego Bay, Jamaica49.0%$117
Ocho Rios, Jamaica48.0%$140
Dominica41.0%$104
Isabela54.0%$156
Turks and Caicos Islands62.0%$380
Antigua and Barbuda52.0%$181
Runaway Bay, Jamaica44.0%$167
Santiago de los Caballeros45.0%$66
Grenada48.0%$117
Saint Vincent and the Grenadines51.0%$158
Martinique64.0%$114
Punta Cana - Caribers47.0%$118
Havana45.0%$39
Santo Domingo Este44.0%$54
Puerto Plata42.0%$98
Cabarete48.0%$108
Cuba40.0%$35
Saint Lucia48.0%$150

Compare property prices, short-term rental yield, rent gap, annual revenue, and supply growth in the Airbtics Market Explorer watchlist.

See all Airbnb markets in Caribbean

Browse all 55 markets we track in Caribbean. Each link opens the market's Airbnb revenue and performance data page.

Caribbean Airbnb market FAQs

  • What are the best Airbnb markets in Caribbean?

    Airbtics ranks short-term rental markets in Caribbean by Market Grade. The grade compares yield (annual revenue divided by property price), year-over-year revenue growth, and occupancy, then adjusts for regulation. The highest-graded market in this dataset is Puerto Rico. The main table lists markets in that order; use the Market Explorer to filter by budget, regulations, and more.

  • How many Airbnb markets does Airbtics track in Caribbean?

    We currently analyze 55 active short-term rental markets in Caribbean with listing supply, median occupancy, ADR, and revenue estimates.

  • What is the average Airbnb occupancy rate in Caribbean?

    The national average occupancy rate across tracked markets is 53.45% (LTM). Rates differ by city. Use the rankboard on this page, or open a market page for that city's numbers.

  • How do I compare Airbnb markets in Caribbean?

    Use the occupancy vs ADR rankboard on this page for a quick view, or open the Market Explorer to compare markets side by side, change chart axes, export to Excel, and save markets to a watchlist.

  • How can I estimate Airbnb income in Caribbean?

    Use our Airbnb income calculator to estimate revenue for a specific address, or open any market link below for median revenue and occupancy benchmarks.


Estimate Your Airbnb Income in Caribbean


Ready to start looking for the most profitable short-term rental investment opportunities in Caribbean?

Use our Airbnb calculator to quickly and accurately estimate the earning and profitability potential of any city, neighborhood, and area.

Try Our Airbnb Calculator

For trends, supply, and year-over-year changes, see the 2025 short-term rental report for Caribbean.