Airbtics | Airbnb Analytics
Precise Short-term Rental Analytics
Airbtics | Airbnb AnalyticsAirbnb Price Optimization
Are you an Airbnb host who is not satisfied with your rental income and think you can earn more? Or just new to Airbnb and want to know how to measure the financial performance of your property? Then understanding the occupancy rate and the daily rate is key to achieving your revenue goals.
To start off, the daily rate is simply the amount you charge per night. On the hand, occupancy rate refers to the percentage of time your property is booked. If your Airbnb occupancy rate is 50%, it means that your property is booked for half the year.
In this blog, we will explore the relationship between occupancy rate and daily rate, as well as share tips and strategies for Airbnb hosts having difficulty with their pricing to improve their Airbnb rental income.
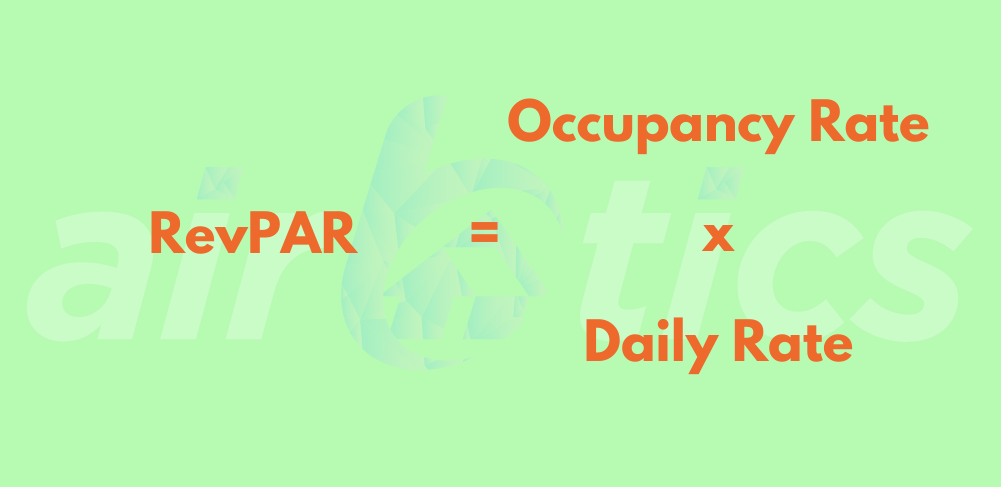
RevPAR, or revenue per available room, provides an overall picture of how well your rental property is performing financially. Calculated by multiplying the Airbnb occupancy rate by the daily rate, RevPAR is a critical metric for Airbnb hosts to monitor.
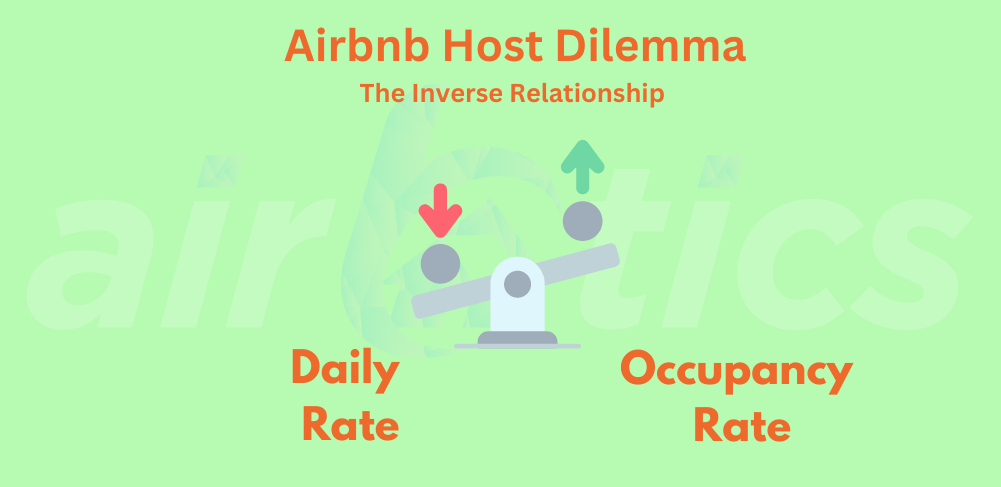
The relationship between the occupancy rate and the daily rate is crucial for maximizing RevPAR. There’s actually an inverse relationship between the two. If your occupancy rate is high but your daily rate is low, you may be leaving money on the table. On the other hand, if your Airbnb nightly rate is high but your occupancy rate is low, you may struggle to attract enough bookings to generate substantial revenue.
Booking lead time refers to the number of days between when a guest makes a booking and the actual check-in date. It is another important factor that Airbnb hosts need to check when optimizing occupancy rate and daily rate. The ideal booking lead time for Airbnb hosts can vary depending on several factors, such as the location, the time of year, and the type of accommodation being offered. In other words, it mainly depends on the market.
A longer lead time means that guests are booking further in advance. This can provide more stability in your bookings and revenue. Guests tend to book further in advance for high-demand times of the year, such as holidays or popular local events. This means that if you have a longer lead time, you may be able to charge higher rates for these peak periods and secure more bookings in advance.
In contrast, a shorter lead time means that guests are booking closer to their travel dates, which can be both positive and negative for your revenue. On one hand, shorter booking lead times can lead to higher nightly rates, as guests are willing to pay a premium for last-minute availability. On the other hand, shorter lead times can also mean that your property is not consistently booked, which can result in periods of low occupancy and decreased revenue.
To optimize RevPAR, Airbnb hosts need to find the sweet spot where the occupancy rate and daily rate are balanced. This requires a deep understanding of your property’s unique market, as well as ongoing monitoring and adjustment of your pricing strategy. By analyzing booking data and market trends, you can adjust your daily rate to attract more guests during low occupancy periods, and raise your prices during high demand periods. For instance, if you’re targetting a specific USA market, then it’s important to analyze the YoY occupancy change in top US cities.
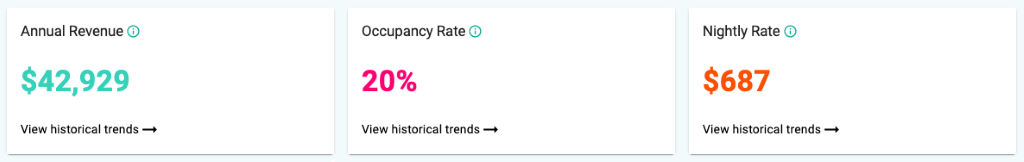
Let’s take Coachella in California as an example. Airbnb hosts charge an average of $687 per night and earn an average annual revenue of $42,929 with a 20% occupancy rate. But more than the said metrics above, you can see data on the granular level. From the graph below, we can see that this week in September 2022 was a very lean time with only 6% occupancy rate.
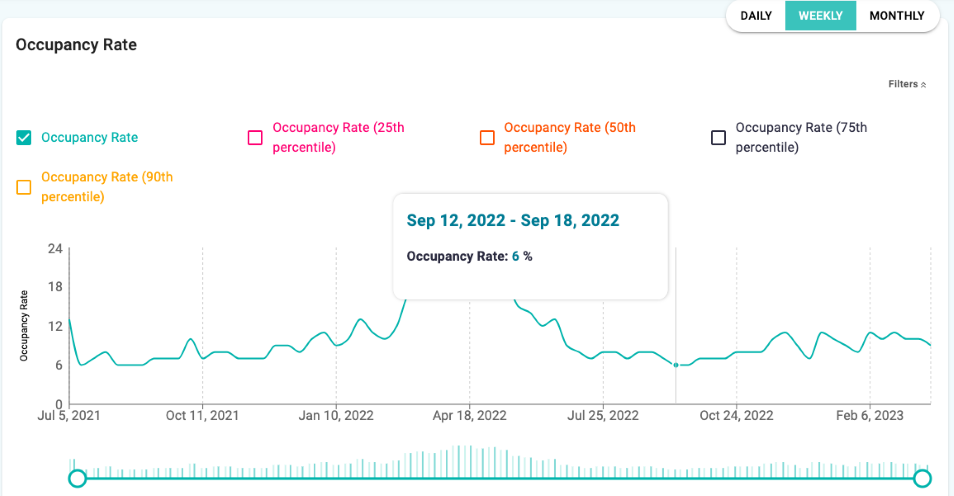
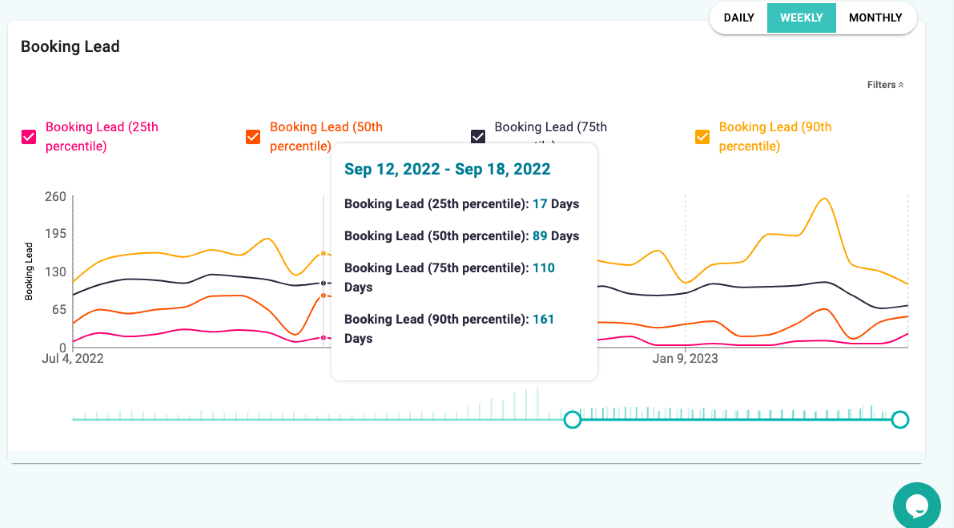
Interestingly, bookings were made more than 2 weeks in advance. How did hosts cope with the very low occupancy rate? Of course, by setting a competitive nightly rate! But here’s the next question, how much can you lower your nightly rate? You can answer this by checking the market.
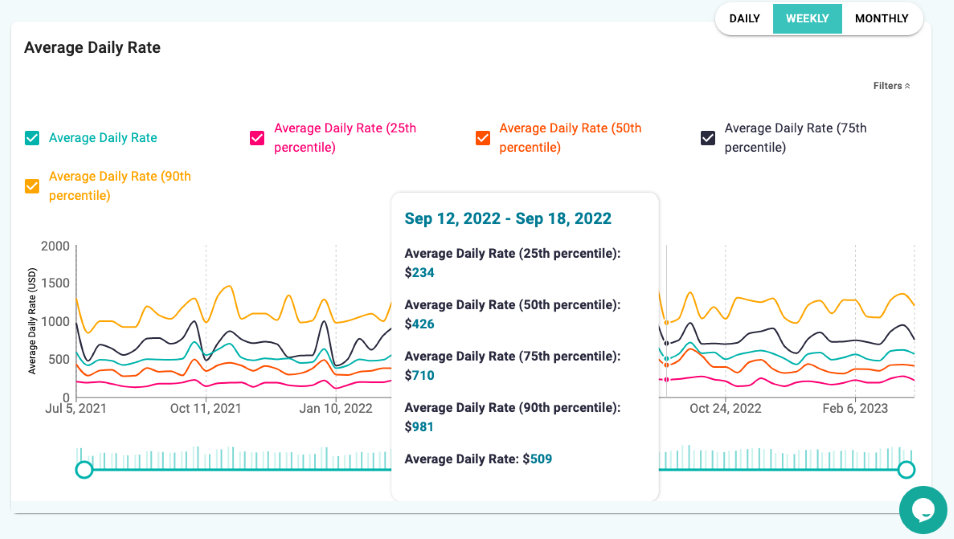
You can see that there were still rooms charged from $710 per night. Remember that bookings were made more than two weeks prior. This gives Airbnb guests more than enough time to look for the cheapest available rooms. With the help of granular data, you can see that other Airbnb hosts were willing to go down to $234 – which had a very high chance of getting booked compared to the rooms with more than three times its price.
Then let’s see how much Airbnb hosts in Coachella can earn during peak season. Every April for two weeks, the Coachella Valley Music and Arts Festival happens. Then let’s see the booking pattern of Airbnb guests at the height of this event.
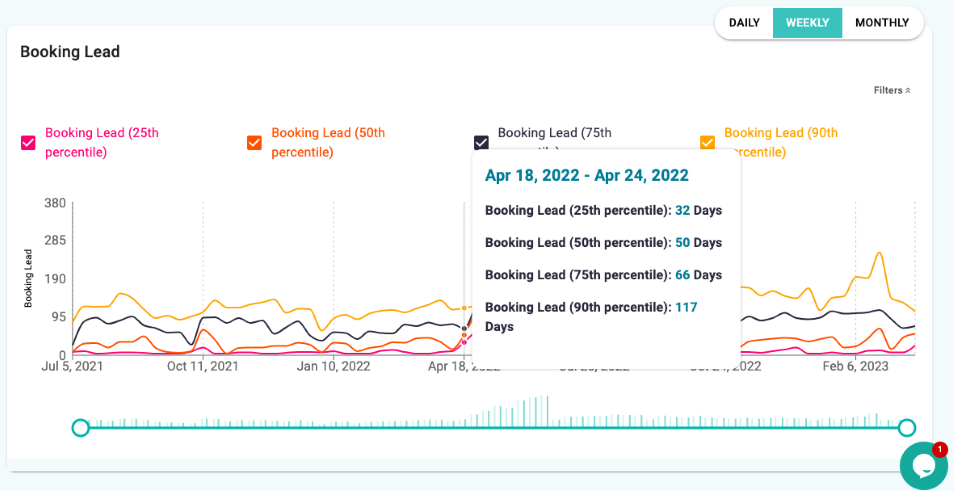
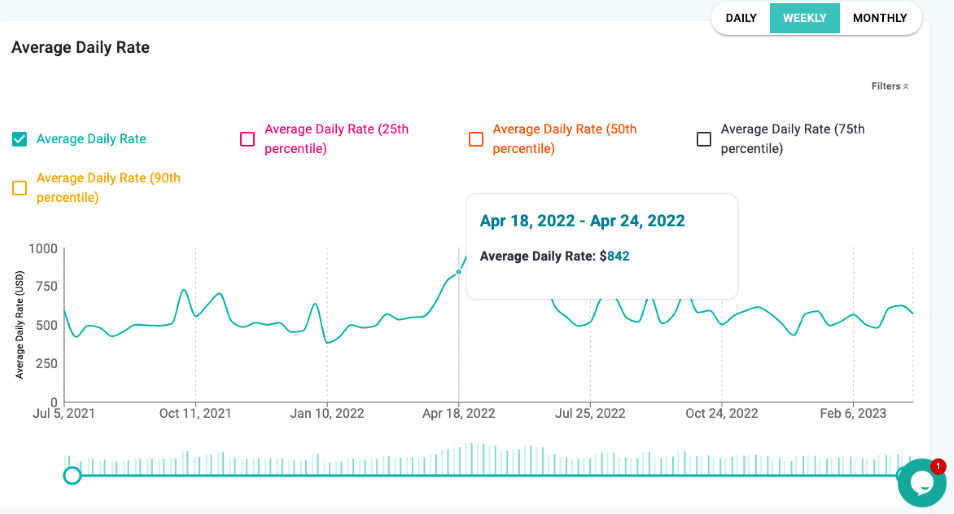
Based on the graphs above, we can see that music lovers were looking forward to this event. On average, guests booked around 50 days in advance. It’s also interesting to see that some guests booked more than 2 months before the event. The last-minute bookings were 32 days in advance and not really last-minute at all – it’s still more than a month. This allowed Airbnb hosts to charge a much higher nightly rate, averaging $842. This is $155 more than the average nightly rate all year round.
Optimizing your Airbnb pricing using RevPAR can be an effective strategy to increase your profits as a host. By analyzing your Airbnb average daily rate and occupancy rate, you can calculate your RevPAR and use it to make informed pricing decisions. Utilizing short-term rental analytics and understanding market demand can help you adjust your prices in real-time and stay competitive in your area.
Remember that pricing is just one aspect of running a successful Airbnb business. Providing exceptional hospitality, maintaining a clean and comfortable space, and responding promptly to guests’ needs are all crucial factors that contribute to a positive guest experience and ultimately, your success as a host. By incorporating RevPAR analysis into your overall hosting strategy, you can make data-driven decisions that will help you maximize your earnings while delivering an exceptional guest experience.
Wanna know if you’re leaving money on the table? Then check out this comprehensive and accessible Airbnb Profit Calculator!