Access The Highest Quality
Short Term Rental Market Intelligence
Accurate Airbnb Analytics to Accelerate Wealth Building Like Never Before.
Trusted by 50,000+ Short-Term Rental Businesses


Shorten Your Path to Financial Freedom
with Data Informed Property Investment Decision
In the right market, you can expect high home value appreciation with above 15% net rental yield from Airbnb. From simulation with historical market data, we found 400-500% return on investment in 10 years in few markets.
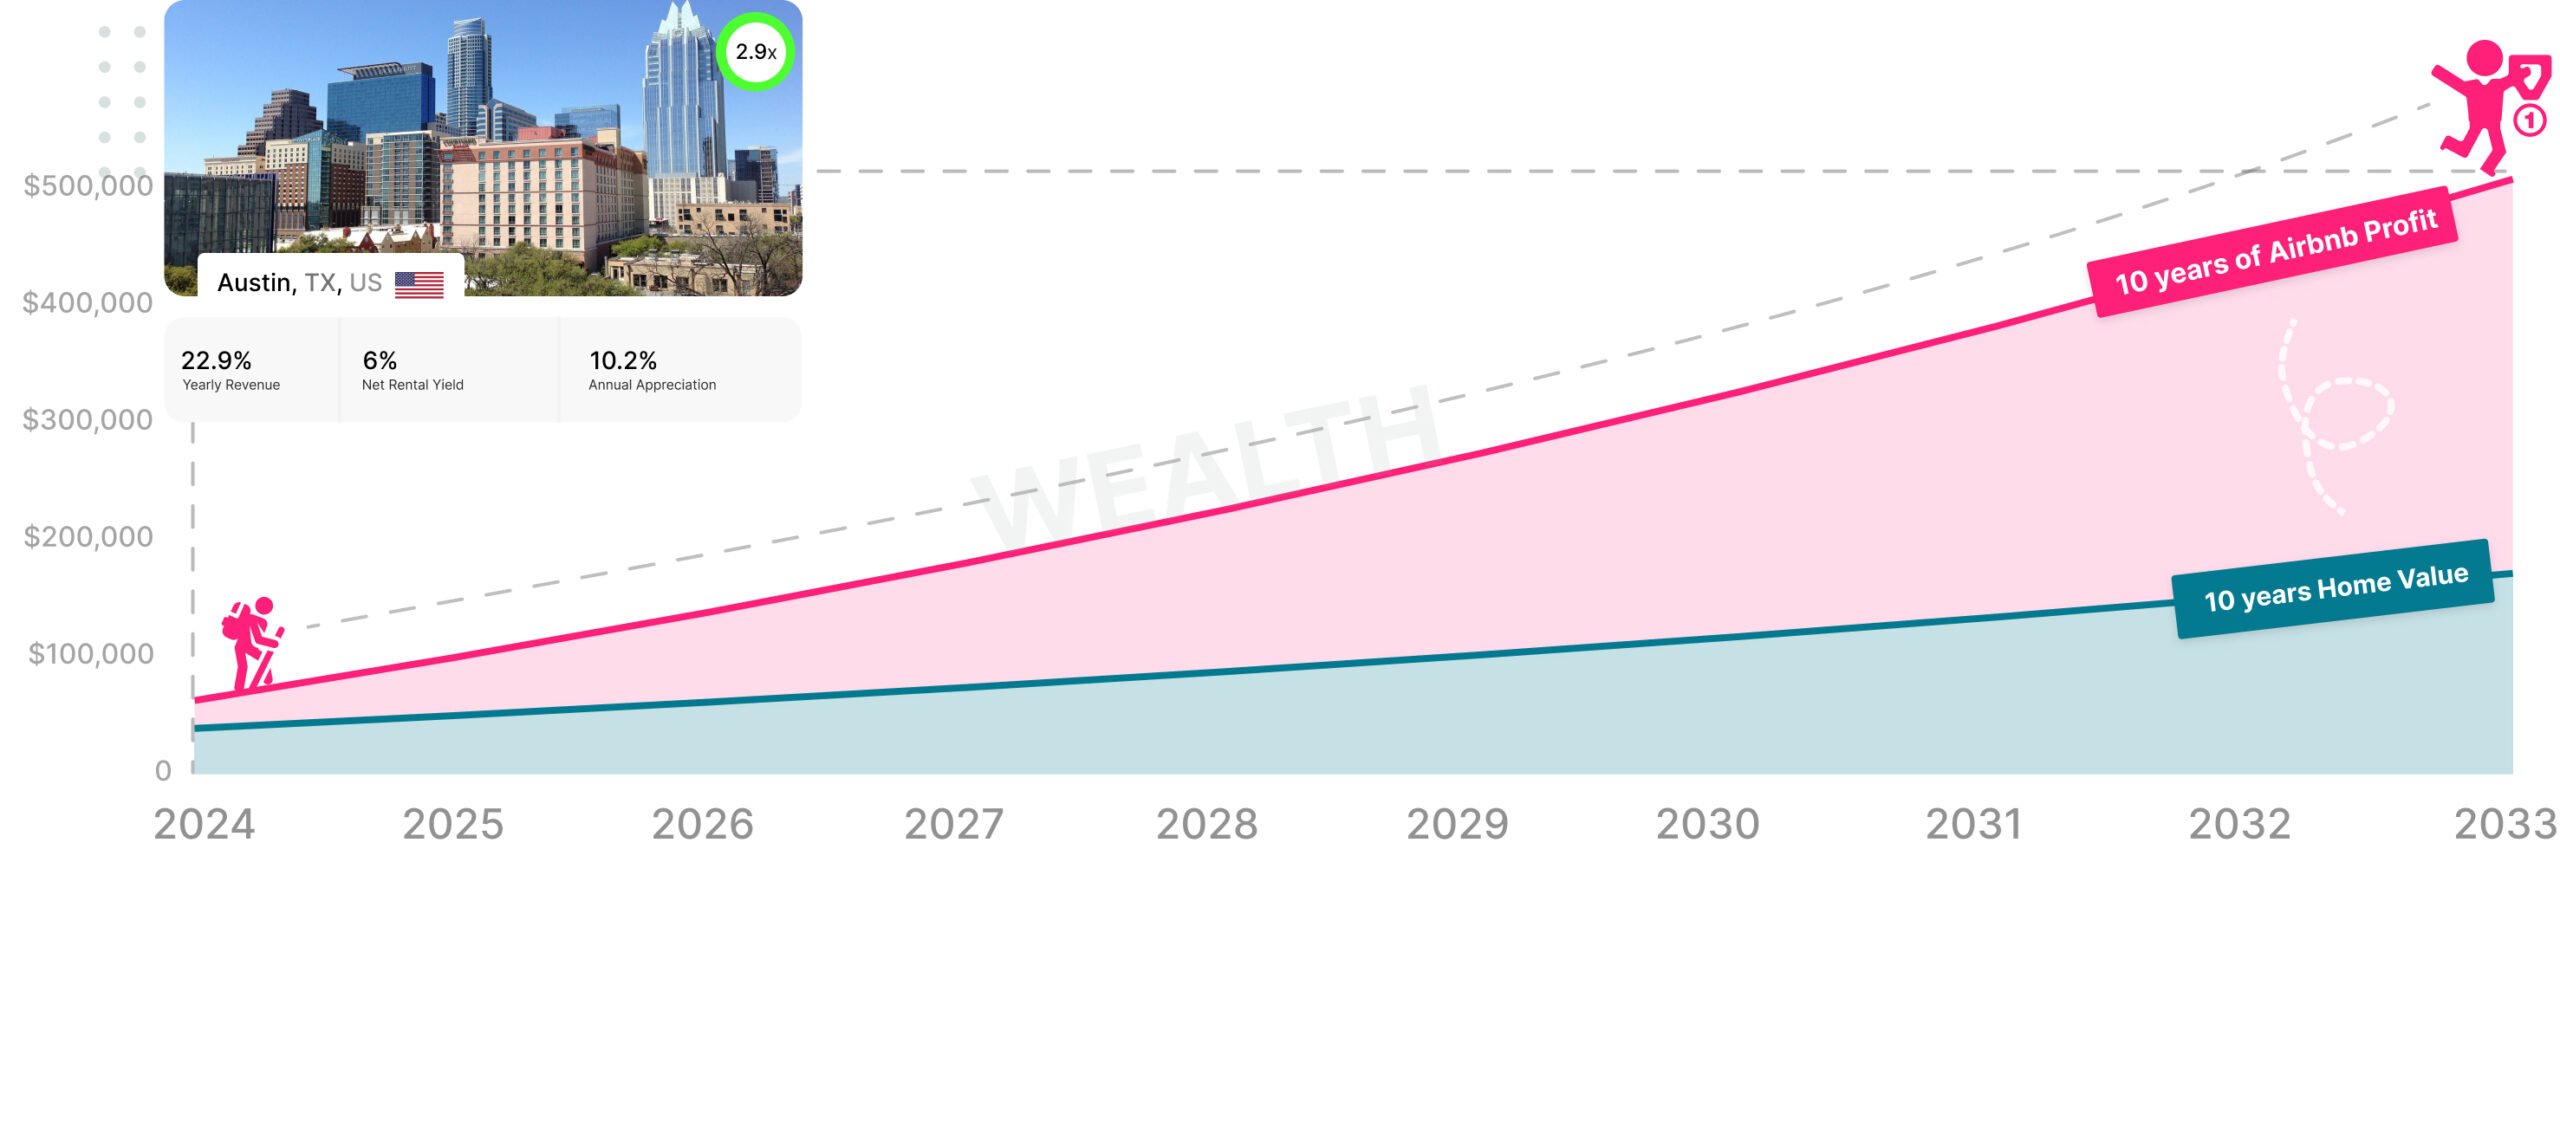
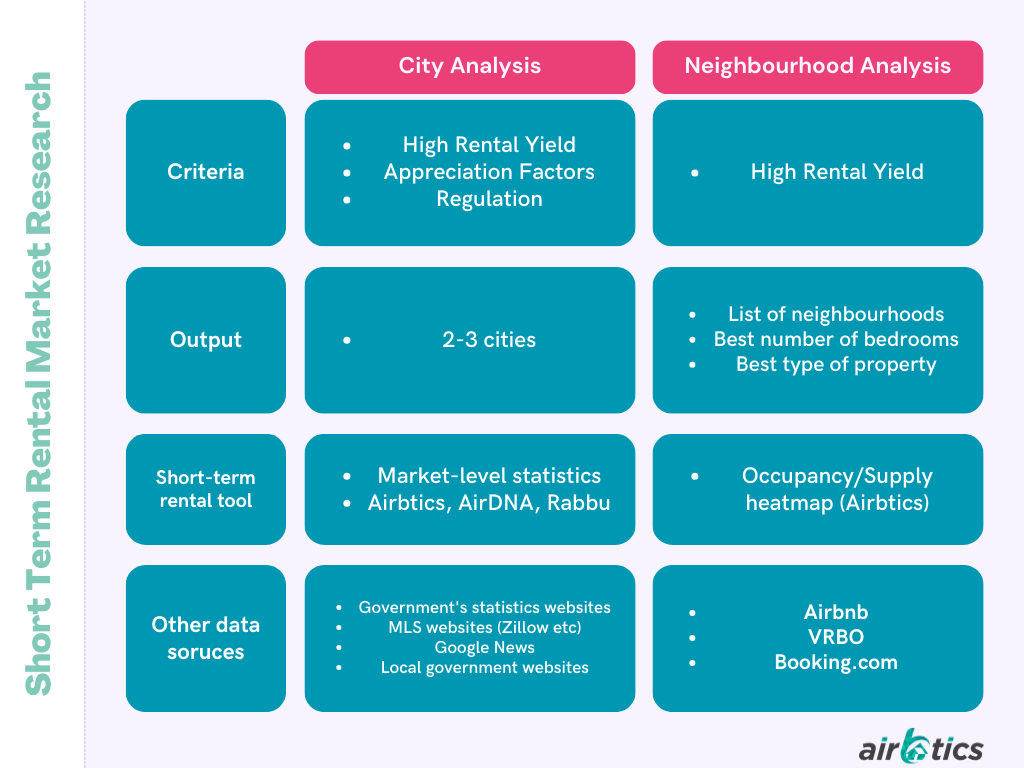
Discover Markets with Maximum Appreciation and Profit
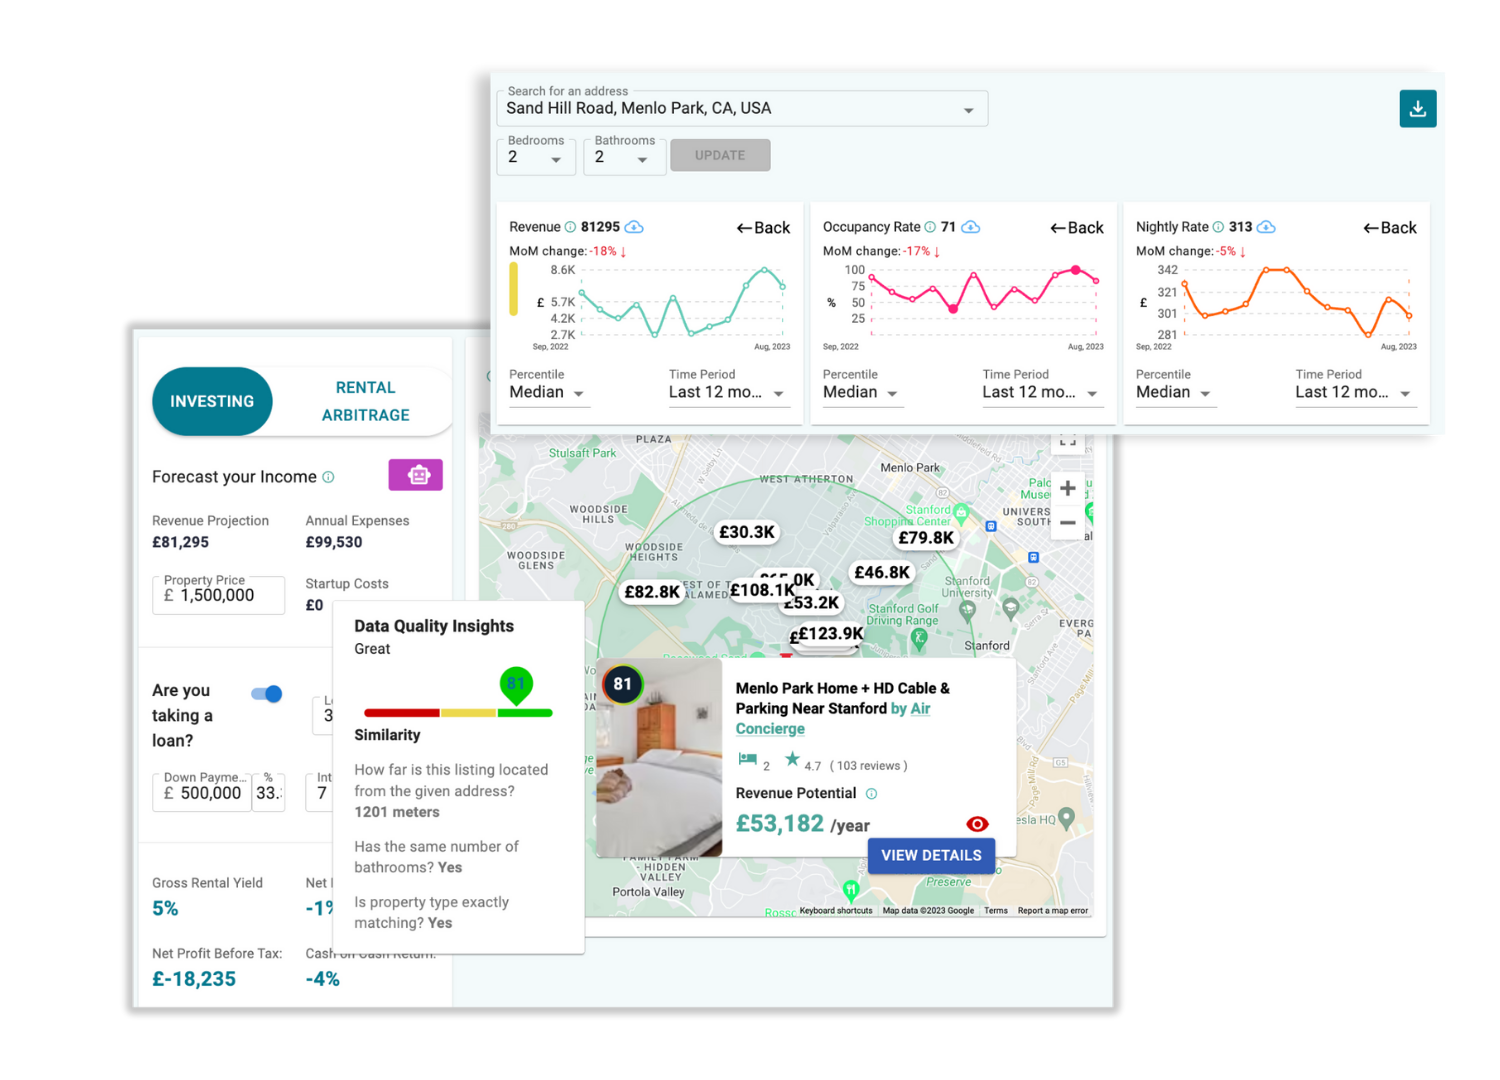
3 years short-term rental market data: Occupancy, Daily Rate, Revenue
10 years real estate trends data: Population, Income, Home Value
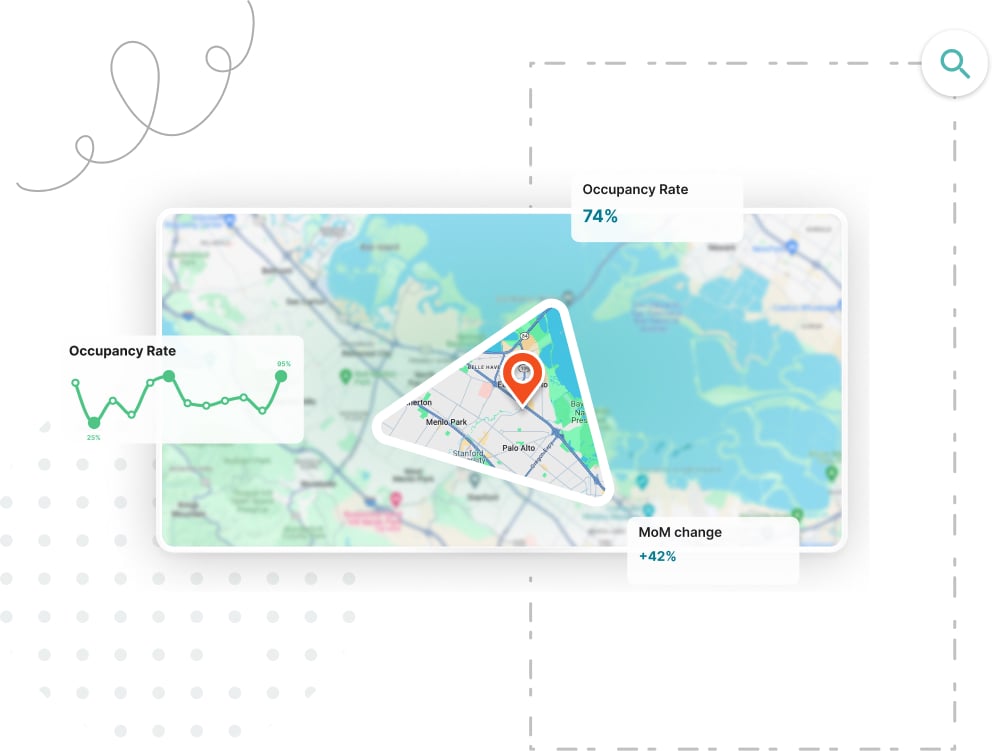
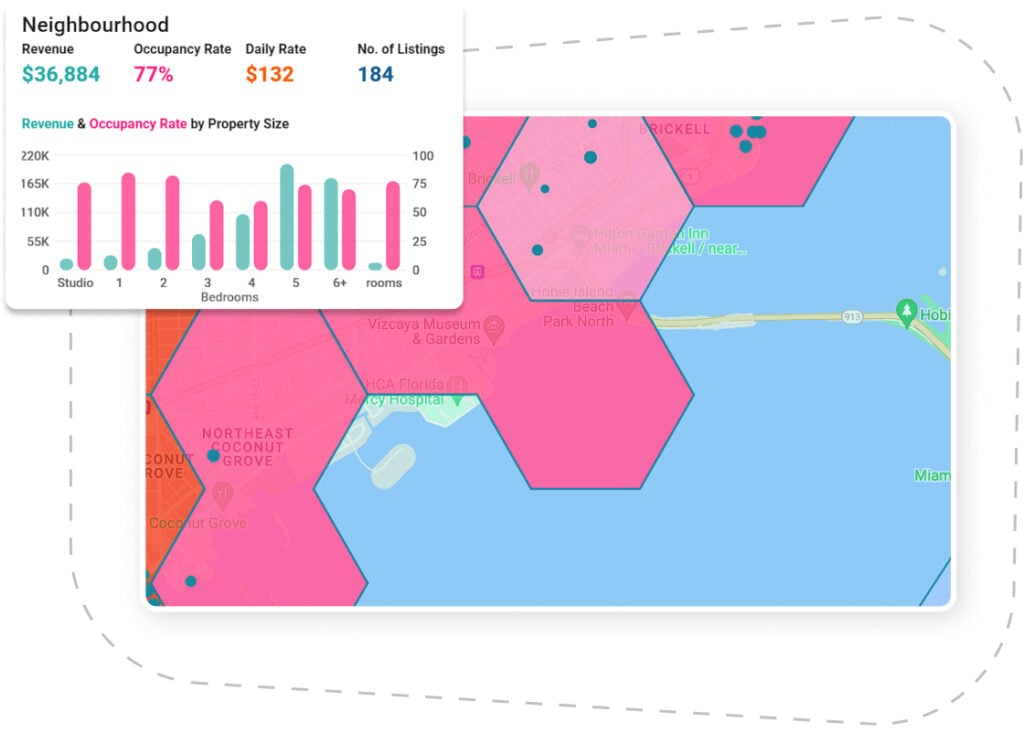
Identify Specific Property Types with Maximum Cashflow
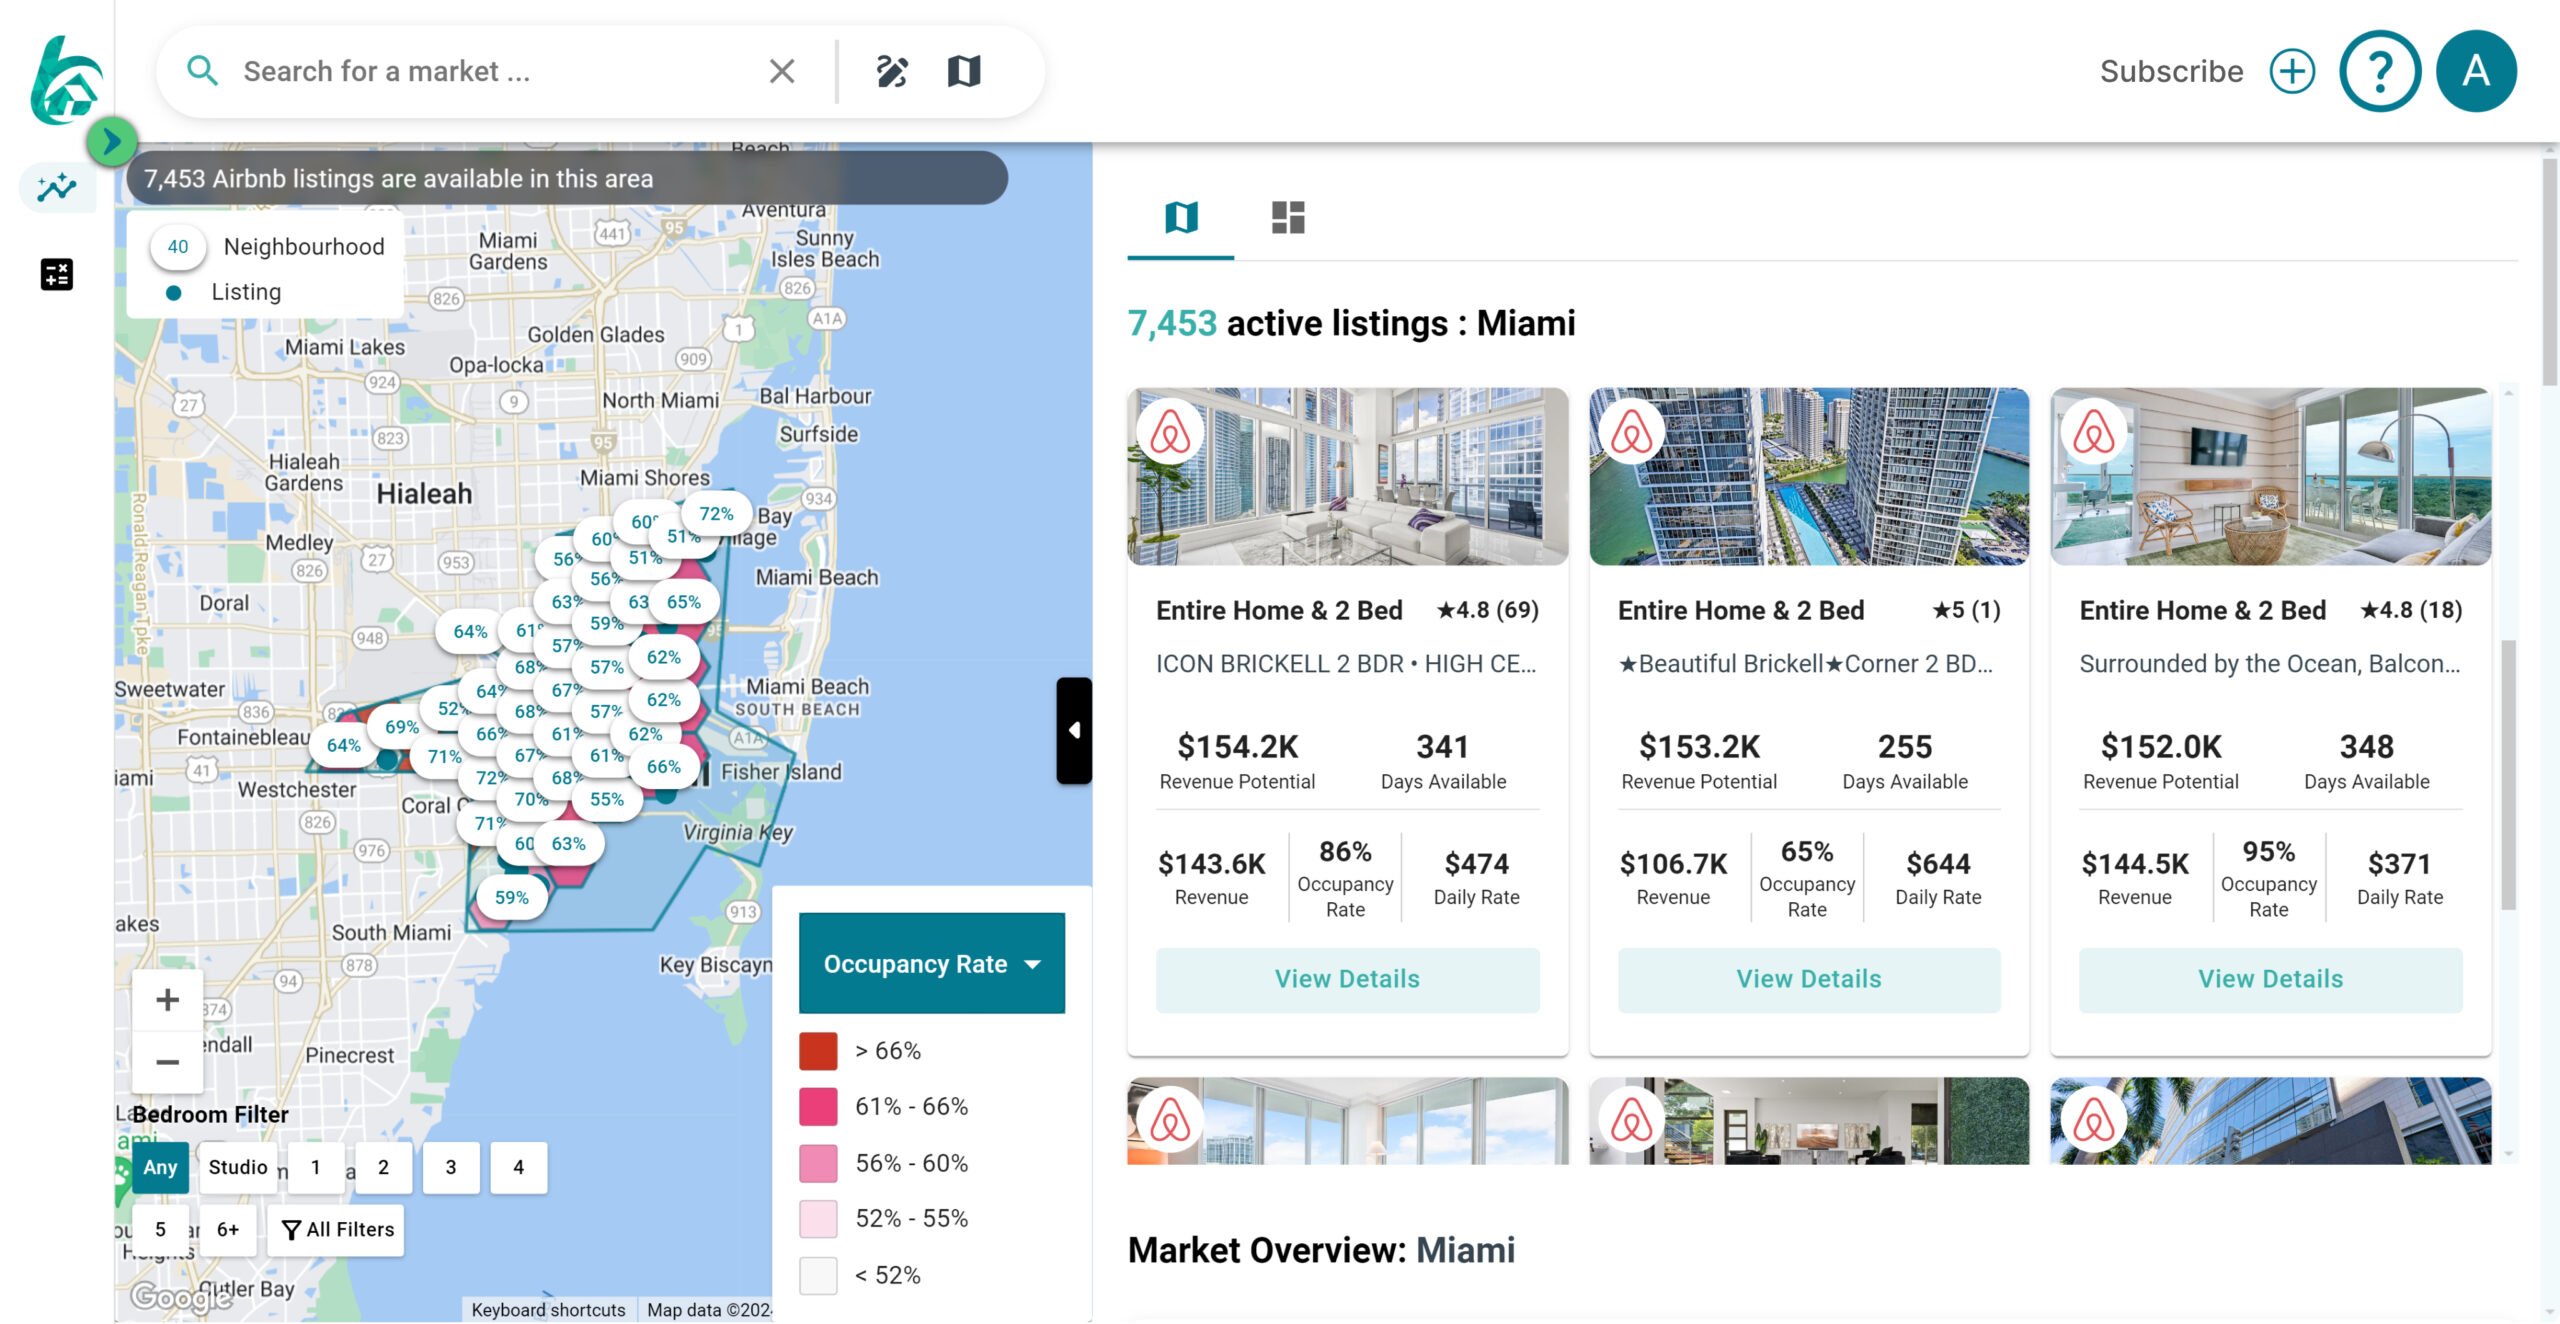
Occupancy Rate Heat Map to see Airbnb Hotspots
Top-performing short-term rental listings’ data
Top Hosts, Amenities, Best Property Size, Guest Demographics
Explore Our Resources
Accurate and comprehensive Airbnb analytics for data-informed decisions.

How to Short Term Rental Analysis to Find Profitable Airbnb Markets with 425%+ 10-Year Returns [For Property Investors]
15-Day Money-Back Guarantee
Read our reviews. We don't leave our customers unhappy. We give a refund if you find our Airbnb Analyzer doesn't meet your expectations.
“Grateful for the affordable, easy to use, data from Airbtics. Will definitely use them again when looking for our next Airbnb. We were able to find our 1st Airbnb in 2 months.”

“The feature set is incredibly powerful, with the most in-depth data analysis for vacation rentals. All of the data is displayed in a very easy to understand breakdown. The simplicity of the user interface should not undermine how advanced the software is, the analytics and data-sets are the most accurate in the industry. The team knows the market, and has the quickest customer service in the industry.”

“Thanks so much for putting together such great software! You are head and shoulders above AirDNA, but I feel you already know that. You gave me EXACTLY what I needed (minus a few blips) to make very informed decision on my latest rental property in Port St Joe, FL. Cheers! I will subscribe again next year when I will purchase another!”


