
Best Airbnb Markets in Montana (2026)
Based on Airbtics data from September 2025 to August 2026, this page shows the top Airbnb locations to invest in Montana with
key
statistics and information, like short-term rental regulations, number of listings, occupancy rate,
average daily rate, and annual revenue. This allows you to discover the most profitable cities to
invest in, buy, and own Airbnb rental properties in Montana.
The Airbtics Market Score indicates how attractive a location is for investing in an Airbnb rental property. We determine this score based on the following criteria:
- Short-term rental yield: The ratio between annual revenue and property price, as a percentage. Locations with higher Airbnb rental yield score better.
- Short-term rental regulations: How STR-friendly the local Airbnb rules and laws are. Markets with more lenient regulations get a higher score.
- Market size: The number of Airbnb listings. Larger vacation rental markets get a higher score as it is easier for investors to buy and sell properties.
- Growth: How fast the market is becoming saturated. Priority is given to markets that are already developed but are not approaching saturation yet.
- Seasonality: To what degree Airbnb performance is affected by seasonality. Less seasonal impact is preferred as investors can enjoy a more stable short-term rental performance throughout the year.
Last updated: 16th October, 2026
Montana Short-Term Rental Market Overview (September 2025 to August 2026)
Top 5 Montana Cities for Airbnb in 2026
Tick the markets you like to track their revenue, occupancy, and ADR in your Airbtics watchlist. Free to start, up to 10 markets.
| Position | Market Grade | Market Name | Regulation | No of Listings | Avg. Occupancy Rate | Avg. Daily Rate | Revenue | Short-term Rental Yield | Rent Gap | |
|---|---|---|---|---|---|---|---|---|---|---|
| 1 | B | Kalispell | Lenient | 2,983 | 64% 🚀 | $325 | $78,020 | 12.3% | 34.5% | |
| 2 | B | Bozeman | Lenient | 1,711 | 62% | $326 | $77,099 | 12.3% | 34.5% | |
| 3 | C+ | Big sky | Lenient | 1,015 | 55% | $638 | $134,862 | 12.3% | 34.5% | |
| 4 | D+ | Billings | Lenient | 852 | 57% | $194 | $42,262 | 12.3% | 34.5% | |
| 5 | C | Missoula | Strict | 709 | 63% 🚀 | $204 | $48,800 | 12.3% | 34.5% |
Market Explorer
Filter markets by occupancy, price, and yield
Filter Montana by occupancy, ADR, yield, rent gap, and property price, then compare markets side by side.
Find the Best Airbnb Markets with Our Interactive Tool
Use our interactive Market Explorer to find the best places to start an Airbnb in Montana. Compare multiple markets side by side, apply filters like regulations, budget (property or rent prices), and market size, and even export the results to Excel.
Explore Interactive Tool2025 short-term rental report for Montana
Trends, supply, and year-over-year changes for Montana.
View 2025 Market ReportWhy Invest in Airbnb Montana in 2026?
The short-term rental markets we track in Montana include Big sky, Kalispell and Bozeman.
The tables on this page list occupancy, average daily rate, and annual revenue for each city.
Property prices and rental rules differ by city. The budget sections below group markets by purchase price.
Market Rankboard: Montana
Each dot is a vacation rental market in Montana, plotted by occupancy rate (x-axis) and average daily rate (ADR) (y-axis). Dashed lines mark the national median.
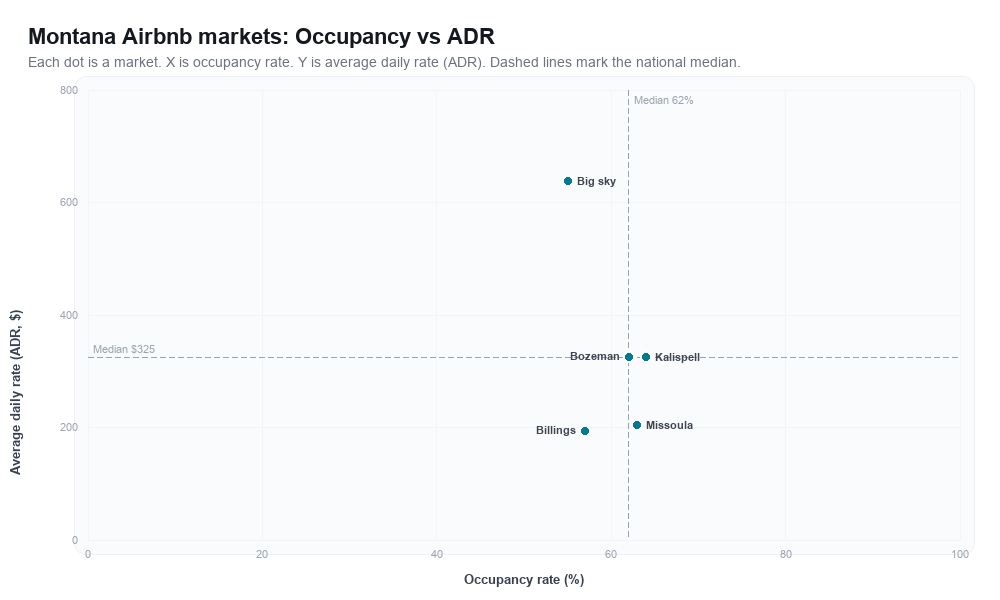
Compare property prices, short-term rental yield, rent gap, annual revenue, and supply growth in the Airbtics Market Explorer watchlist.
Best Cities for Airbnb in Montana by Budget
Top 3 Affordable & Mid-Range Airbnb Markets: $500,000 & Below
Property prices in these markets are $500,000 or less.
Top 3 Best Places for Airbnb Arbitrage in Montana
Montana Airbnb market FAQs
What are the best Airbnb markets in Montana?
Airbtics ranks short-term rental markets in Montana using revenue, occupancy, regulation, yield, and growth. The top market in our latest dataset is Kalispell. The main table on this page lists the highest-scoring markets; use the Market Explorer to filter by budget, regulations, and more.
How many Airbnb markets does Airbtics track in Montana?
We currently analyze 5 active short-term rental markets in Montana with listing supply, median occupancy, ADR, and revenue estimates.
What is the average Airbnb occupancy rate in Montana?
The national average occupancy rate across tracked markets is 60.20% (LTM). Rates differ by city. Use the rankboard on this page, or open a market page for that city's numbers.
How do I compare Airbnb markets in Montana?
Use the occupancy vs ADR rankboard on this page for a quick view, or open the Market Explorer to compare markets side by side, change chart axes, export to Excel, and save markets to a watchlist.
How can I estimate Airbnb income in Montana?
Use our Airbnb income calculator to estimate revenue for a specific address, or open any market link below for median revenue and occupancy benchmarks.
See all Airbnb markets in Montana
Browse all 5 markets we track in Montana. Each link opens the market's Airbnb revenue and performance data page.
- For short-term rental market analysis, visit our Airbnb Analytics app.
Estimate Your Airbnb Income in Montana
Ready to start looking for the most profitable short-term rental investment opportunities in Montana?
Use our Airbnb calculator to quickly and accurately estimate the earning and profitability potential of any city, neighborhood, and area.
Try Our Airbnb Calculator