










Mejores mercados de Airbnb en Peru (2026)

Basado en los datos de Airbtics del periodo September 2025 to August 2026, esta página muestra las mejores ubicaciones de Airbnb para invertir en Peru con estadísticas e información clave, como normativas de alquiler a corto plazo, número de anuncios, tasa de ocupación, tarifa diaria promedio e ingresos anuales. Esto le permite descubrir las ciudades más rentables para invertir, comprar y poseer propiedades de alquiler vacacional en Peru.

Los mercados de esta página se ordenan por la calificación de Airbtics, no por el número de anuncios. La calificación compara rendimiento, crecimiento de ingresos y ocupación (demanda) con los demás mercados de esta lista, y luego ajusta por la regulación del alquiler de corta duración.

  1. Rendimiento: Ingresos anuales del alquiler de corta duración divididos por el precio de la propiedad. Un rendimiento más alto sube en el ranking.
  2. Crecimiento: Cambio de los ingresos respecto al año anterior. Un crecimiento más rápido sube en el ranking.
  3. Demanda: Tasa de ocupación media de los últimos 12 meses. Una ocupación más alta sube en el ranking.
Más información sobre cómo recopilamos los datos y su precisión

Última actualización: 16th October, 2026

Resumen del mercado de alquiler a corto plazo en Peru (Análisis completo 2025)

Promedios nacionales en todos los mercados de Peru
Tasa de ocupación promedio i
44.56%
Ingresos anuales promedio i
PEN34,771
Tarifa diaria promedio (ADR) i
PEN224
Crecimiento de la oferta YoY i
57.95%
Cambio en ingresos YoY i
4.84%

Top 9 ciudades en Peru para Airbnb en 2026

Seguir Posición Grado del mercado Nombre del mercado Regulación Nº de anuncios Tasa de ocupación promedio Tarifa diaria promedio Ingresos Rendimiento del alquiler Crecimiento de ingresos
1BCañete
Lenient
1,49931%PEN657PEN76,16920.1%+15.8%
2CLima
Lenient
16,41952%PEN178PEN35,10410.7%+10.0%
3C+Talara
Lenient
99834%PEN292PEN37,21019.5%-0.7%
4DMiraflores
Lenient
4,81362% 🚀PEN203PEN47,273Unlock in Market ExplorerUnlock in Market Explorer
5DBarranco
Lenient
1,82462% 🚀PEN172PEN40,170Unlock in Market ExplorerUnlock in Market Explorer
6D+Trujillo
Lenient
90035%PEN130PEN17,290Unlock in Market ExplorerUnlock in Market Explorer
7ECusco
Lenient
4,14948%PEN117PEN21,017Unlock in Market ExplorerUnlock in Market Explorer
8EUrubamba
Lenient
1,03135%PEN147PEN19,710Unlock in Market ExplorerUnlock in Market Explorer
9E+Arequipa
Lenient
1,72842%PEN120PEN18,997Unlock in Market ExplorerUnlock in Market Explorer

Data Seen By

Encuentra los mejores mercados de Airbnb con nuestra herramienta interactiva

Usa nuestro Explorador de Mercados interactivo para encontrar los mejores lugares para comenzar un Airbnb en Peru. Compara múltiples mercados lado a lado, aplica filtros como regulaciones, presupuesto (precios de propiedad o alquiler) y tamaño del mercado, e incluso exporta los resultados a Excel.

Explorar Herramienta Interactiva

¿Por qué invertir en Airbnb en Peru en 2026?

En los últimos años, Peru ha surgido como uno de los mejores lugares para invertir en alquileres a corto plazo gracias a sus populares atracciones turísticas, prósperas actividades comerciales, creciente presencia de nómadas digitales y ciudades vibrantes como Cañete, Lima and Talara. Con millones de visitantes internacionales que llegan cada año, la demanda de alojamientos de alquiler vacacional está creciendo, lo que convierte a Airbnb en Peru en una opción lucrativa tanto para inversores locales como extranjeros.

Debido a la fuerte demanda de los viajeros, Peru ofrece tarifas diarias promedio (ADR) competitivas, tasas de ocupación saludables y un potencial de ingresos atractivo en los mejores mercados de Airbnb. Ya sea que estés buscando comenzar tu primer negocio de Airbnb con un presupuesto modesto o añadir una propiedad de alquiler a corto plazo de lujo a tu cartera, Peru tiene una ubicación rentable para satisfacer tu presupuesto y aspiraciones como inversor.

Top 3 Airbnb markets in Peru by Market Grade

These are the three highest-graded Airbnb markets in Peru. Market Grade compares yield, revenue growth, and occupancy (demand) with the other markets on this page, then adjusts for short-term rental regulation. The chart repeats those three percentiles in text so the ranking is readable without the graphic.

Rank 1 — Cañete (Grade B)

Cañete is rank 1 of 9 markets in this Peru ranking by Airbtics Market Grade B, with 20.1% short-term rental yield, 31.0% occupancy, and +15.8% year-over-year revenue growth.

Compared with the other markets on this page, Cañete ranks top 6% for yield, top 6% for growth, and lowest 6% for demand. The market shows an average daily rate of PEN657, annual revenue of PEN76,169, a rent gap of 4216.3%, 1,499 active listings, lenient short-term rental regulation, and a typical 2-bedroom property price of PEN258,120.

  • Market gradeB
  • Yield20.1%
  • Revenue growth+15.8%
  • Occupancy31.0%
  • Average daily ratePEN657
  • Annual revenuePEN76,169
  • Rent gap4216.3%
  • Active listings1,499
  • 2-bedroom pricePEN258,120
  • RegulationLenient
top 6%Yieldtop 6%Growthlowest 6%Demand

Percentile versus other Peru markets on this page. Farther from the center is stronger.

  • Yield: top 6%
  • Growth: top 6%
  • Demand: lowest 6%

Rank 2 — Lima (Grade C)

Lima is rank 2 of 9 markets in this Peru ranking by Airbtics Market Grade C, with 10.7% short-term rental yield, 52.0% occupancy, and +10.0% year-over-year revenue growth.

Compared with the other markets on this page, Lima ranks top 28% for yield, top 28% for growth, and top 28% for demand. The market shows an average daily rate of PEN178, annual revenue of PEN35,104, a rent gap of 2040.5%, 16,419 active listings, lenient short-term rental regulation, and a typical 2-bedroom property price of PEN412,992.

  • Market gradeC
  • Yield10.7%
  • Revenue growth+10.0%
  • Occupancy52.0%
  • Average daily ratePEN178
  • Annual revenuePEN35,104
  • Rent gap2040.5%
  • Active listings16,419
  • 2-bedroom pricePEN412,992
  • RegulationLenient
top 28%Yieldtop 28%Growthtop 28%Demand

Percentile versus other Peru markets on this page. Farther from the center is stronger.

  • Yield: top 28%
  • Growth: top 28%
  • Demand: top 28%

Rank 3 — Talara (Grade C+)

Talara is rank 3 of 9 markets in this Peru ranking by Airbtics Market Grade C+, with 19.5% short-term rental yield, 34.0% occupancy, and -0.7% year-over-year revenue growth.

Compared with the other markets on this page, Talara ranks top 17% for yield, lowest 28% for growth, and lowest 17% for demand. The market shows an average daily rate of PEN292, annual revenue of PEN37,210, a rent gap of 3796.3%, 998 active listings, lenient short-term rental regulation, and a typical 2-bedroom property price of PEN240,912.

  • Market gradeC+
  • Yield19.5%
  • Revenue growth-0.7%
  • Occupancy34.0%
  • Average daily ratePEN292
  • Annual revenuePEN37,210
  • Rent gap3796.3%
  • Active listings998
  • 2-bedroom pricePEN240,912
  • RegulationLenient
top 17%Yieldlowest 28%Growthlowest 17%Demand

Percentile versus other Peru markets on this page. Farther from the center is stronger.

  • Yield: top 17%
  • Growth: lowest 28%
  • Demand: lowest 17%

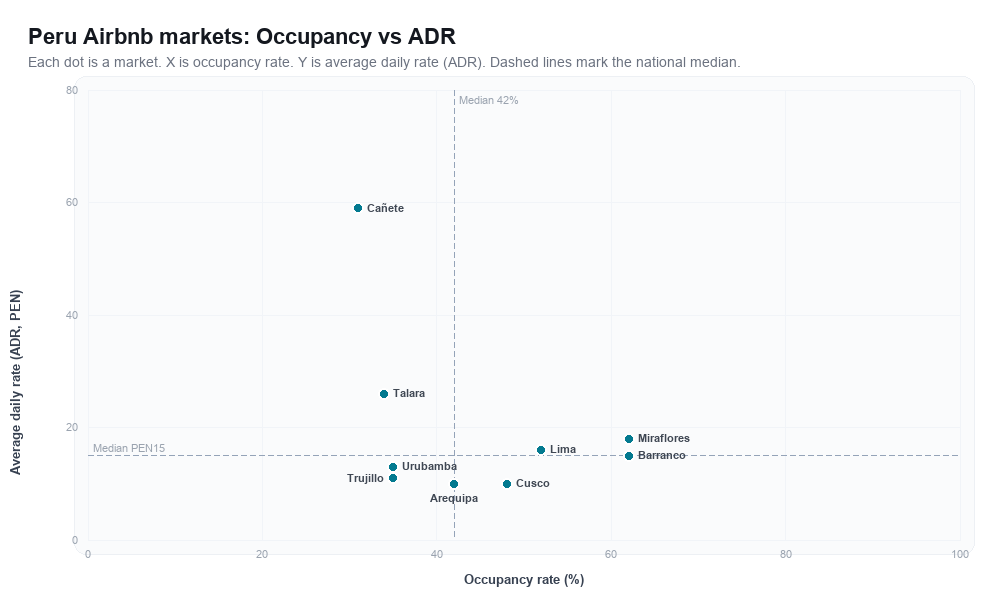
Análisis de Saturación del Mercado: Peru

Each dot is a vacation rental market in Peru, plotted by occupancy rate (x-axis) and average daily rate (ADR) (y-axis). Dashed lines mark the national median.

Peru Airbnb markets rankboard scatter chart showing occupancy rate versus average daily rate (ADR)
Occupancy rate and average daily rate for each Peru market plotted in the chart above, in Market Grade order.
MarketOccupancy rateAverage daily rate
Cañete31.0%PEN657
Lima52.0%PEN178
Talara34.0%PEN292
Miraflores62.0%PEN203
Barranco62.0%PEN172
Trujillo35.0%PEN130
Cusco48.0%PEN117
Urubamba35.0%PEN147
Arequipa42.0%PEN120

Compare property prices, short-term rental yield, rent gap, annual revenue, and supply growth in the Airbtics Market Explorer watchlist.


Estima tus ingresos de Airbnb en Peru


¿Estás listo para empezar a buscar las oportunidades de inversión en alquiler a corto plazo más rentables en Peru?

Usa nuestra calculadora de Airbnb para estimar rápida y precisamente el potencial de ganancias y rentabilidad de cualquier ciudad, barrio y zona.

Prueba nuestra calculadora de Airbnb

Si quieres ver tendencias, oferta y cambios interanuales, lee el informe del mercado de alquiler a corto plazo 2025 de Peru.