











Best Airbnb Markets in Texas (2026)

Based on Airbtics data from September 2025 to August 2026, this page ranks the best Airbnb markets in Texas by Market Grade. The grade compares short-term rental yield, year-over-year revenue growth, and occupancy (demand), then adjusts for local regulation. The table also shows listing count, average daily rate, and annual revenue for every market.

Markets on this page are ranked by the Airbtics Market Grade, not by the number of listings. The grade compares each market with the other markets in this ranking on three measures, then adjusts for local short-term rental regulation.

  1. Yield: Annual short-term rental revenue divided by property price. A higher yield ranks higher.
  2. Growth: Year-over-year change in revenue. Faster revenue growth ranks higher.
  3. Demand: Average occupancy rate over the last 12 months. Higher occupancy ranks higher.

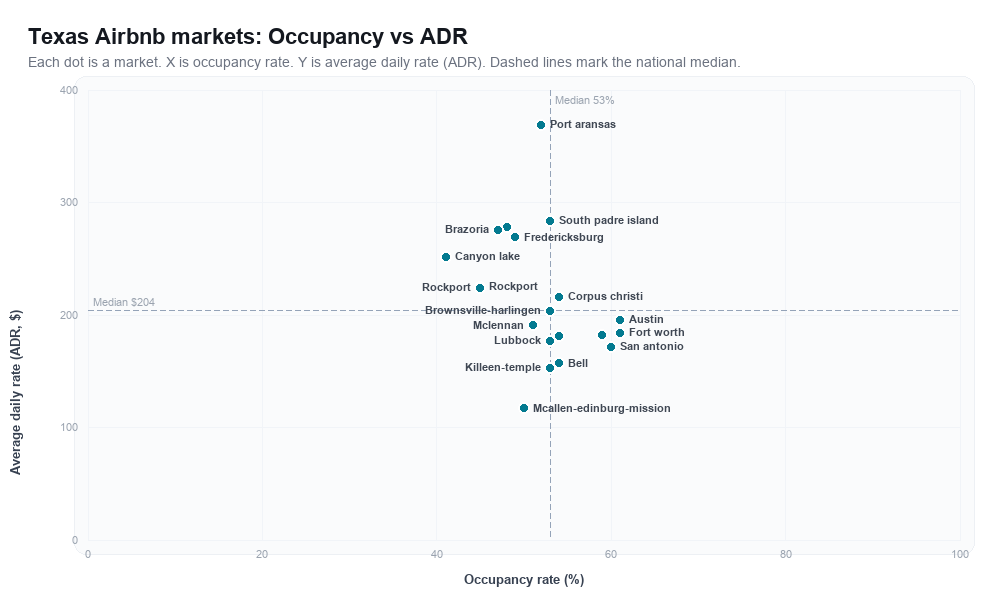
Stricter short-term rental regulation lowers the letter grade. Occupancy, average daily rate, and annual revenue are shown for every market. Exact yield and revenue growth are published for the three highest-graded markets. For every other market those two figures are in Market Explorer. The rankboard plots the same markets by occupancy and average daily rate, and the table under the chart lists those values in text.

Learn more about how we collect the data and accuracy

Last updated: 16th October, 2026

Texas Short-Term Rental Market Overview (September 2025 to August 2026)

National averages across all Texas markets
Average Occupancy Rate i
52.15%
Average Annual Revenue i
$43,025
Average Daily Rate (ADR) i
$215
YoY Supply Growth i
41.27%
YoY Revenue Change i
11.62%

Top 20 Texas Cities for Airbnb in 2026

Tick the markets you like to track their revenue, occupancy, and ADR in your Airbtics watchlist. Free to start, up to 10 markets.

Position Market Grade Market Name Regulation No of Listings Avg. Occupancy Rate Avg. Daily Rate Revenue Short-term Rental Yield Revenue Growth
1BBrownsville-Harlingen
Lenient
2,02553%$204$41,28826.4%+10.2%
2BFredericksburg
Lenient
1,11149%$269$52,61114.0%+17.6%
3BMclennan
Lenient
89451%$191$37,98521.6%+10.7%
4B+Corpus Christi
Lenient
2,10654%$216$45,434Unlock in Market ExplorerUnlock in Market Explorer
5B+Fort Worth
Lenient
1,76561% 🚀$184$42,968Unlock in Market ExplorerUnlock in Market Explorer
6B+Lubbock
Lenient
1,03153%$177$36,131Unlock in Market ExplorerUnlock in Market Explorer
7CAustin
Lenient
8,69861% 🚀$196$45,799Unlock in Market ExplorerUnlock in Market Explorer
8CDallas
Lenient
4,70259%$182$41,174Unlock in Market ExplorerUnlock in Market Explorer
9CSan Antonio
Strict
4,58260%$172$40,244Unlock in Market ExplorerUnlock in Market Explorer
10CSouth Padre Island
Lenient
2,51353%$284$57,370Unlock in Market ExplorerUnlock in Market Explorer
11CBell
Lenient
83054%$157$32,445Unlock in Market ExplorerUnlock in Market Explorer
12C+Houston
Lenient
9,02054%$181$37,175Unlock in Market ExplorerUnlock in Market Explorer
13C+Galveston
Strict
5,80748%$278$52,006Unlock in Market ExplorerUnlock in Market Explorer
14C+Port Aransas
Lenient
2,75652%$369$74,320Unlock in Market ExplorerUnlock in Market Explorer
15C+Brazoria
Lenient
91947%$276$50,048Unlock in Market ExplorerUnlock in Market Explorer
16DMcAllen-Edinburg-Mission
Lenient
1,39150%$117$22,432Unlock in Market ExplorerUnlock in Market Explorer
17DRockport
Lenient
51045%$224$39,492Unlock in Market ExplorerUnlock in Market Explorer
18D+Rockport
Lenient
1,25445%$225$39,476Unlock in Market ExplorerUnlock in Market Explorer
19D+Canyon Lake
Lenient
99741%$252$41,012Unlock in Market ExplorerUnlock in Market Explorer
20D+Killeen-Temple
Lenient
99753%$153$31,098Unlock in Market ExplorerUnlock in Market Explorer

Data Seen By

Market Explorer

Filter markets by occupancy, price, and yield

Filter Texas by occupancy, ADR, yield, rent gap, and property price, then compare markets side by side.

Open Explorer

Find the Best Airbnb Markets with Our Interactive Tool

Use our interactive Market Explorer to find the best places to start an Airbnb in Texas. Compare multiple markets side by side, apply filters like regulations, budget (property or rent prices), and market size, and even export the results to Excel.

Explore Interactive Tool

Why Invest in Airbnb Texas in 2026?

The highest-graded short-term rental markets in Texas are Brownsville-Harlingen, Fredericksburg and Mclennan. The table ranks every tracked market by Airbtics Market Grade. Occupancy, average daily rate, annual revenue, yield, and revenue growth are the figures behind that grade.

Top 3 Airbnb markets in Texas by Market Grade

These are the three highest-graded Airbnb markets in Texas. Market Grade compares yield, revenue growth, and occupancy (demand) with the other markets on this page, then adjusts for short-term rental regulation. The chart repeats those three percentiles in text so the ranking is readable without the graphic.

Rank 1 — Brownsville-Harlingen (Grade B)

Brownsville-Harlingen is rank 1 of 20 markets in this Texas ranking by Airbtics Market Grade B, with 26.4% short-term rental yield, 53.0% occupancy, and +10.2% year-over-year revenue growth.

Compared with the other markets on this page, Brownsville-Harlingen ranks top 2% for yield, lowest 42% for growth, and top 45% for demand. The market shows an average daily rate of $204, annual revenue of $41,288, a rent gap of 3500.9%, 2,025 active listings, lenient short-term rental regulation, and a typical 2-bedroom property price of $150,000.

  • Market gradeB
  • Yield26.4%
  • Revenue growth+10.2%
  • Occupancy53.0%
  • Average daily rate$204
  • Annual revenue$41,288
  • Rent gap3500.9%
  • Active listings2,025
  • 2-bedroom price$150,000
  • RegulationLenient
top 2%Yieldlowest 42%Growthtop 45%Demand

Percentile versus other Texas markets on this page. Farther from the center is stronger.

  • Yield: top 2%
  • Growth: lowest 42%
  • Demand: top 45%

Rank 2 — Fredericksburg (Grade B)

Fredericksburg is rank 2 of 20 markets in this Texas ranking by Airbtics Market Grade B, with 14.0% short-term rental yield, 49.0% occupancy, and +17.6% year-over-year revenue growth.

Compared with the other markets on this page, Fredericksburg ranks lowest 38% for yield, top 22% for growth, and lowest 28% for demand. The market shows an average daily rate of $269, annual revenue of $52,611, a rent gap of 3172.5%, 1,111 active listings, lenient short-term rental regulation, and a typical 2-bedroom property price of $350,000.

  • Market gradeB
  • Yield14.0%
  • Revenue growth+17.6%
  • Occupancy49.0%
  • Average daily rate$269
  • Annual revenue$52,611
  • Rent gap3172.5%
  • Active listings1,111
  • 2-bedroom price$350,000
  • RegulationLenient
lowest 38%Yieldtop 22%Growthlowest 28%Demand

Percentile versus other Texas markets on this page. Farther from the center is stronger.

  • Yield: lowest 38%
  • Growth: top 22%
  • Demand: lowest 28%

Rank 3 — Mclennan (Grade B)

Mclennan is rank 3 of 20 markets in this Texas ranking by Airbtics Market Grade B, with 21.6% short-term rental yield, 51.0% occupancy, and +10.7% year-over-year revenue growth.

Compared with the other markets on this page, Mclennan ranks top 8% for yield, lowest 48% for growth, and lowest 38% for demand. The market shows an average daily rate of $191, annual revenue of $37,985, a rent gap of 3046.5%, 894 active listings, lenient short-term rental regulation, and a typical 2-bedroom property price of $175,000.

  • Market gradeB
  • Yield21.6%
  • Revenue growth+10.7%
  • Occupancy51.0%
  • Average daily rate$191
  • Annual revenue$37,985
  • Rent gap3046.5%
  • Active listings894
  • 2-bedroom price$175,000
  • RegulationLenient
top 8%Yieldlowest 48%Growthlowest 38%Demand

Percentile versus other Texas markets on this page. Farther from the center is stronger.

  • Yield: top 8%
  • Growth: lowest 48%
  • Demand: lowest 38%

Market Rankboard: Texas

Each dot is a vacation rental market in Texas, plotted by occupancy rate (x-axis) and average daily rate (ADR) (y-axis). Dashed lines mark the national median.

Texas Airbnb markets rankboard scatter chart showing occupancy rate versus average daily rate (ADR)
Occupancy rate and average daily rate for each Texas market plotted in the chart above, in Market Grade order.
MarketOccupancy rateAverage daily rate
Brownsville-Harlingen53.0%$204
Fredericksburg49.0%$269
Mclennan51.0%$191
Corpus Christi54.0%$216
Fort Worth61.0%$184
Lubbock53.0%$177
Austin61.0%$196
Dallas59.0%$182
San Antonio60.0%$172
South Padre Island53.0%$284
Bell54.0%$157
Houston54.0%$181
Galveston48.0%$278
Port Aransas52.0%$369
Brazoria47.0%$276
McAllen-Edinburg-Mission50.0%$117
Rockport45.0%$224
Rockport45.0%$225
Canyon Lake41.0%$252
Killeen-Temple53.0%$153

Compare property prices, short-term rental yield, rent gap, annual revenue, and supply growth in the Airbtics Market Explorer watchlist.

See all Airbnb markets in Texas

Browse all 20 markets we track in Texas. Each link opens the market's Airbnb revenue and performance data page.

Texas Airbnb market FAQs

  • What are the best Airbnb markets in Texas?

    Airbtics ranks short-term rental markets in Texas by Market Grade. The grade compares yield (annual revenue divided by property price), year-over-year revenue growth, and occupancy, then adjusts for regulation. The highest-graded market in this dataset is Brownsville-Harlingen. The main table lists markets in that order; use the Market Explorer to filter by budget, regulations, and more.

  • How many Airbnb markets does Airbtics track in Texas?

    We currently analyze 20 active short-term rental markets in Texas with listing supply, median occupancy, ADR, and revenue estimates.

  • What is the average Airbnb occupancy rate in Texas?

    The national average occupancy rate across tracked markets is 52.15% (LTM). Rates differ by city. Use the rankboard on this page, or open a market page for that city's numbers.

  • How do I compare Airbnb markets in Texas?

    Use the occupancy vs ADR rankboard on this page for a quick view, or open the Market Explorer to compare markets side by side, change chart axes, export to Excel, and save markets to a watchlist.

  • How can I estimate Airbnb income in Texas?

    Use our Airbnb income calculator to estimate revenue for a specific address, or open any market link below for median revenue and occupancy benchmarks.


Estimate Your Airbnb Income in Texas


Ready to start looking for the most profitable short-term rental investment opportunities in Texas?

Use our Airbnb calculator to quickly and accurately estimate the earning and profitability potential of any city, neighborhood, and area.

Try Our Airbnb Calculator

For trends, supply, and year-over-year changes, see the 2025 short-term rental report for Texas.