
Best Short-Term Rental Analytics Tools in 2026: Market Research, Listing Data and Accuracy Compared
The best short-term rental analytics tool depends on the decision you need to make. An investor comparing cities needs a different workflow from a property manager setting next month's prices or a tourism board measuring accommodation supply.
For screening markets across countries and checking the listing data behind an estimate, Airbtics is my pick. AirDNA is a strong option for market and submarket research, BNBCalc connects market research with property investment analysis, and AirROI offers free market exploration. For day-to-day revenue management, consider PriceLabs, Wheelhouse or Beyond; for PMS-based performance benchmarking, consider Key Data.
I started Airbtics in 2020, and I own and manage short-term rentals. That means I have both a commercial interest in this comparison and practical experience with the question behind it: can I use these numbers to make a better decision?
In this article, I compare how Airbtics, AirDNA, BNBCalc and AirROI help you discover markets, compare opportunities and investigate individual properties. I also compare listing-level estimates against owner benchmarks from properties I operate in Seoul and Kuala Lumpur. I do not publish my own listings here; the examples below are comparable public listings in the same neighbourhoods, with similar revenue in the same ballpark.
Disclosure: I’m the founder of Airbtics. Hands-on observations below come from our team's research. Product documentation and public review profiles were checked on October 20, 2026. Features vary by plan, and these examples are not an independent, platform-wide accuracy study.
What should short-term rental analytics help you do?
Most short-term rental market research starts with discovering markets and comparing a shortlist. Once you choose a city, the next step is to identify its best neighbourhoods and find which property types and sizes perform well. Then, look at comparable listings: are they genuinely similar to the property you plan to operate, and can you verify the revenue, occupancy and nightly rates behind their estimates?
A useful analytics tool should cover that path: pick a market, then check the actual properties behind the numbers.
Short-term rental analytics platforms usually organize market analysis around revenue, occupancy and average daily rate, or ADR. Other useful measures include active listing counts, seasonality and changes in supply or revenue over time.
Those market figures depend on the underlying properties and how the provider aggregates them. A market's revenue statistic might be an average or a median. An occupancy figure might exclude owner-blocked nights. A filter might remove inactive listings or restrict the sample to entire homes.
Before relying on a market KPI, understand which listings it represents and how it was calculated. Listing-level access helps you investigate the inputs, although inspecting a few properties does not by itself validate the whole market aggregate.
How the tools compared
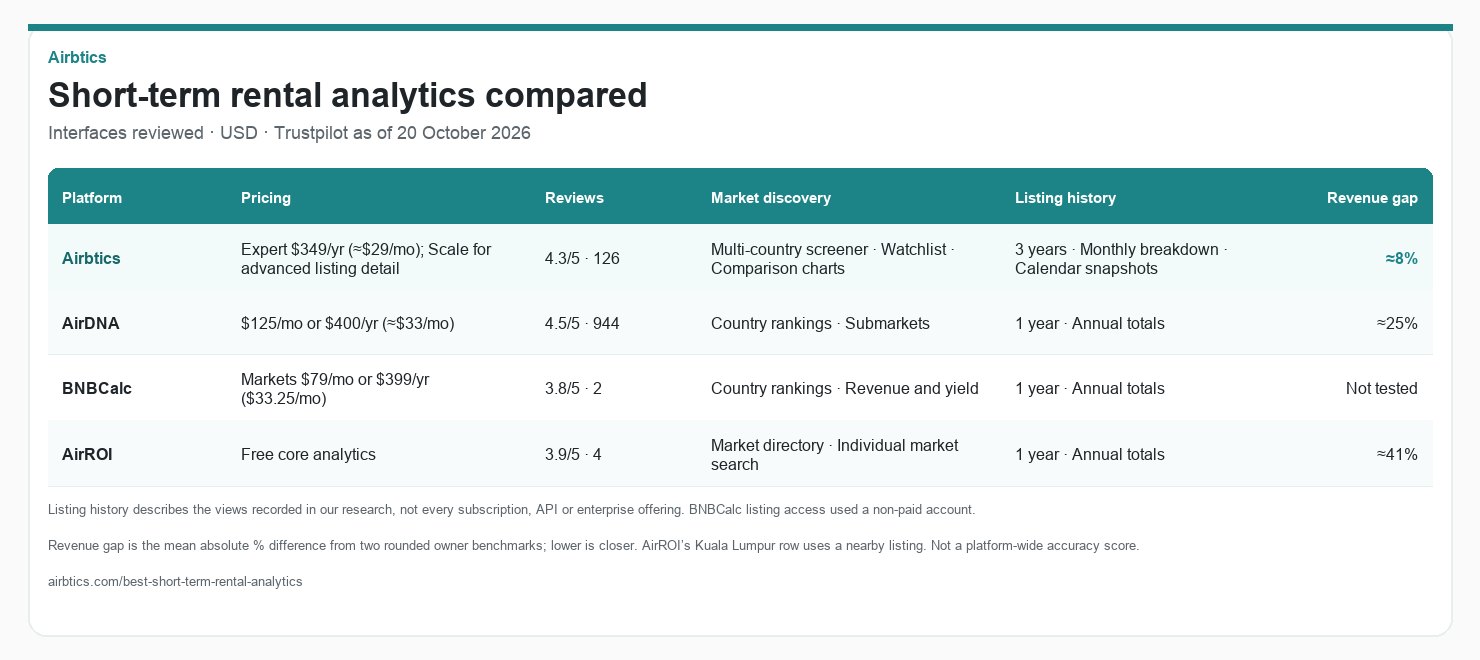
Prices are in US dollars. Annual equivalents are not month-to-month subscriptions. Reviews are from the public Trustpilot profiles we checked on 20 October 2026.
| Platform | Pricing | Reviews | Market discovery | Market data | Listing history¹ | Revenue gap² |
|---|---|---|---|---|---|---|
| Airbtics | Expert: $349/year (≈$29/month); advanced listing detail requires Scale | 4.3/5 · 126 reviews | Multi-country screener · Watchlist · Comparison charts | Revenue · Occupancy · ADR | 3 years · Monthly breakdown · Calendar snapshots | ≈8% |
| AirDNA | $125/month or $400/year (≈$33/month) | 4.5/5 · 944 reviews | Country rankings · Submarkets | Revenue · Occupancy · ADR | 1 year · Annual totals | ≈25% |
| BNBCalc | Markets: $79/month or $399/year ($33.25/month) | 3.8/5 · 2 reviews | Country rankings · Revenue and yield | Revenue · Occupancy · ADR | 1 year · Annual totals | Not tested |
| AirROI | Free core analytics | 3.9/5 · 4 reviews | Market directory · Individual market search | Revenue · Occupancy · ADR | 1 year · Annual totals | ≈41% |
¹ Listing history describes the views recorded in our research, not the limits of every subscription, API or enterprise offering. BNBCalc's listing summary reflects the general product review; we could not access the specific benchmark listings with our non-paid account.
² Revenue gap is the average absolute percentage difference from the two rounded owner benchmarks; lower means closer. AirROI's Kuala Lumpur result uses a different nearby property, so its average is not directly comparable. These two examples do not establish platform-wide accuracy.
If you're specifically looking for a replacement for AirDNA, see our AirDNA alternatives guide for a comparison of the workflows, costs and trade-offs.
Comparing market explorer features
An explorer is useful when you do not yet know where to invest. The important question is whether you can screen markets using the criteria that matter to you, then carry the results into a more detailed comparison.
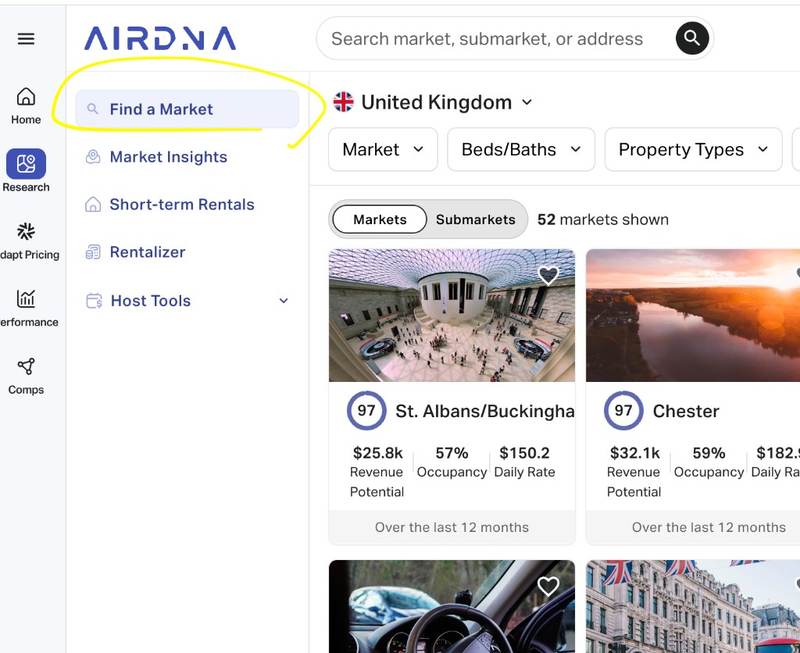
AirDNA: explore markets and submarkets within a country
In the workflow we reviewed, AirDNA's Find a Market feature lets you explore a country and compare areas using Market Score, revenue, occupancy and ADR. Submarket exploration is particularly useful when a large city's headline figures conceal substantial local differences.
AirDNA's help docs also list extra market filters, so calling it “basic filters only” is the wrong summary. What matters is whether those filters help the search you actually need to run.
Airbtics: screen across countries and keep a shortlist
Airbtics Explorer is designed for a search that may begin across several countries. You can compare rental performance alongside property price, gross rental yield and rent gap, then save interesting markets to a Watchlist.
That makes the workflow practical for an investor asking, “Where should I look next?” rather than already having a specific city in mind. A high-revenue market might look less attractive once acquisition costs are included, while a lower-revenue market may warrant investigation because property prices are much lower.
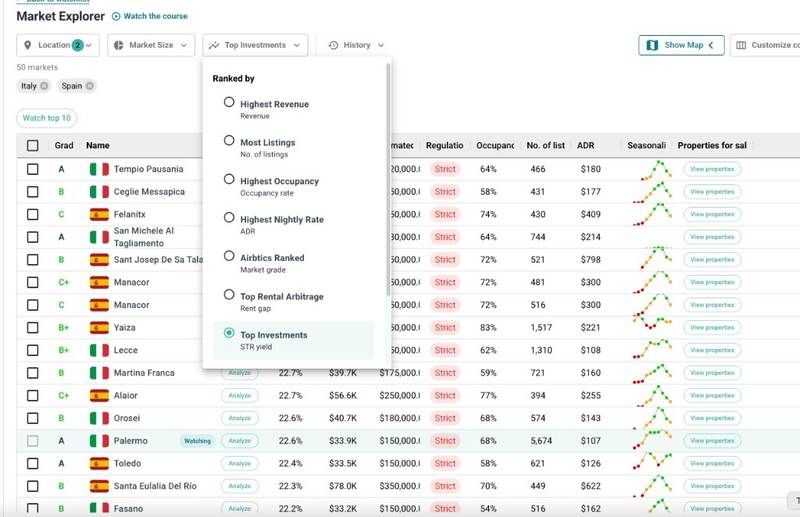
Yield and rent gap are screening indicators. They do not establish net profit, and estimated property prices or rents deserve their own checks before a purchase or rental commitment.
Once you have a shortlist, Watchlist lets you revisit the same markets and compare them through graphs. Rankboard helps reveal relationships such as property price versus rental revenue or ADR versus occupancy. Seasonal comparisons help you see whether markets depend on the same peak months.
Selected results can also be exported to spreadsheet formats or PDF, depending on the workflow and plan, for further analysis or discussion with a partner.
Explore AirbticsBNBCalc: move from market rankings to a property analysis
BNBCalc's market workflow is suited to users who want to move from choosing a location to evaluating a specific deal. Our review found country-based rankings using revenue or yield.
There is an important geographic qualification: BNBCalc's public documentation says gross yield and property values are US-only, while markets outside the US rank by revenue. Its Markets plan includes the Calculator, connecting discovery with property-level analysis.
AirROI: map exploration and market reports
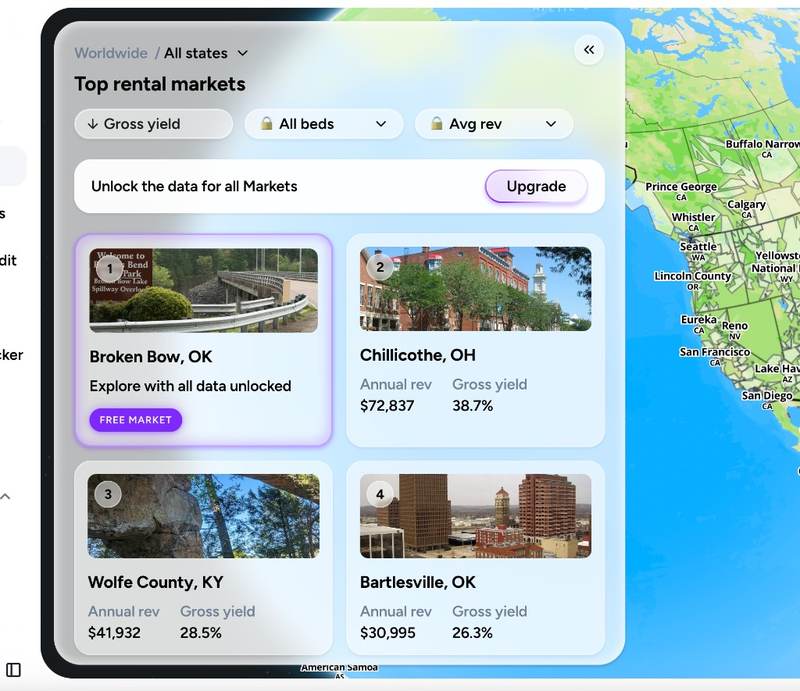
AirROI's world market directory provides a starting point for browsing locations. Its current product offering also includes Market Atlas, which advertises city search, viewport exploration and custom-area selection.
We did not establish a saved shortlist and comparison workflow equivalent to the Airbtics Watchlist we reviewed. That is a narrower observation than saying AirROI has no discovery features: its map and directory do support exploration.
Explore AirROIComparing data granularity and historical coverage
“Three years of data” can mean several different things. It might mean three years of monthly market averages, three years of performance for each individual listing, or a historical dataset available only through an API or enterprise contract.
These are different capabilities. Before subscribing, check the history available for the market, the individual listing and the specific plan you intend to use.
Market history and listing history answer different questions
Market history helps explain changes in demand, rates and supply. Listing history helps you investigate whether one property's performance is repeatable and representative.
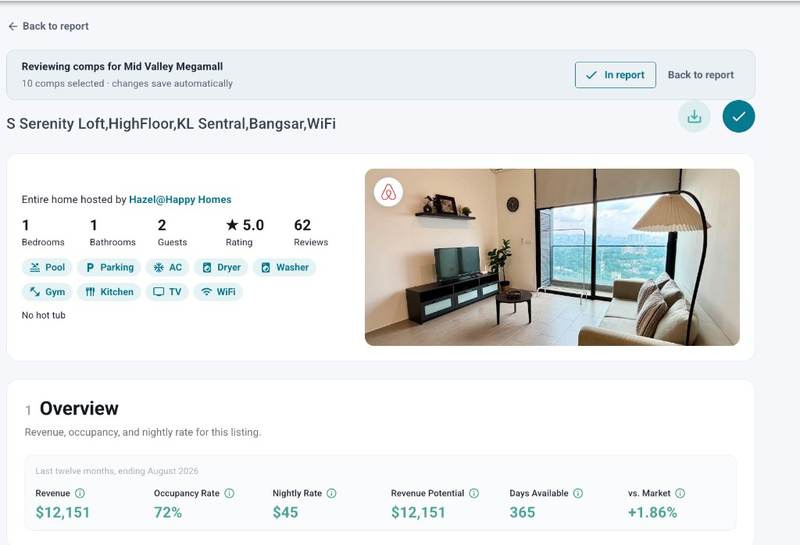
A trailing-12-month revenue figure is a useful summary, but it cannot show whether income was concentrated in a few months or whether the property was unavailable for part of the year. A monthly breakdown makes those patterns easier to spot.
Airbtics provides up to three years of monthly listing performance in the reviewed workflow, where the listing has sufficient history. Its public pricing page distinguishes basic listing insight from advanced monthly history on Scale.
In the AirDNA, BNBCalc and AirROI views recorded in our research, listing performance was presented as a one-year summary. The practical difference we are comparing is the detail visible in those workflows: annual totals versus a monthly breakdown and the calendar observations behind it.
This does not describe every product a vendor offers. Additional history may be available through another plan, API or enterprise dataset. Check the specific interface and subscription you intend to use.
Search for a known listing before trusting the wider market
Airbtics lets you search by Airbnb listing ID and open the property's performance page. This is useful when you know a listing's actual bookings or want to investigate a particular comparable property. You can also use our search Airbnb by listing number tool.
Our team also accessed individual listings through AirDNA and AirROI's map or property workflows. BNBCalc advertises listing and comp data, but we could not inspect the target listings using the non-paid account in this review.
The route matters less than the result: can you identify the right property, select the relevant period and understand the figures being shown?
Historical calendar snapshots add another layer of evidence
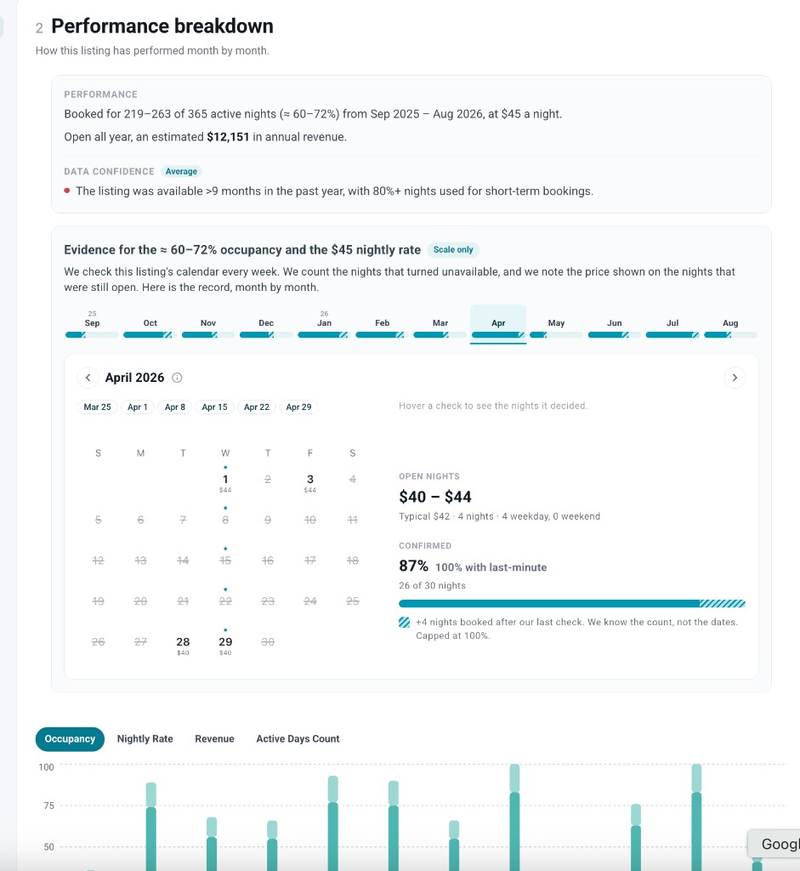
Airbtics also shows historical calendar observations collected through weekly checks. You can inspect which nights appeared open or unavailable and the prices visible when the calendar was checked.
For example, if a property's December estimate looks unusually high, you can examine the available observations around that month and compare them with the monthly result.
These snapshots are evidence about the calendar, not a copy of the host's reservation ledger. An unavailable night can be a booking or an owner block. A displayed price may differ from the final booked rate, and weekly checks cannot capture every change between observations.
Their value is that you can investigate the estimate. For me, that is a stronger reason to trust a tool than a headline accuracy claim with no explanation of what was measured.
Listing-level data checks in Seoul and Kuala Lumpur
I used neighbourhoods I know to compare the vendors' listing-level estimates. These are related to the locations in our best Airbnb calculator comparison, but the question here is different: what does each platform report about an existing listing?
A revenue calculator predicts the potential of an address. A listing-performance page estimates what a particular operating property earned over a past period. Those should not be treated as the same test.
How to read the benchmark
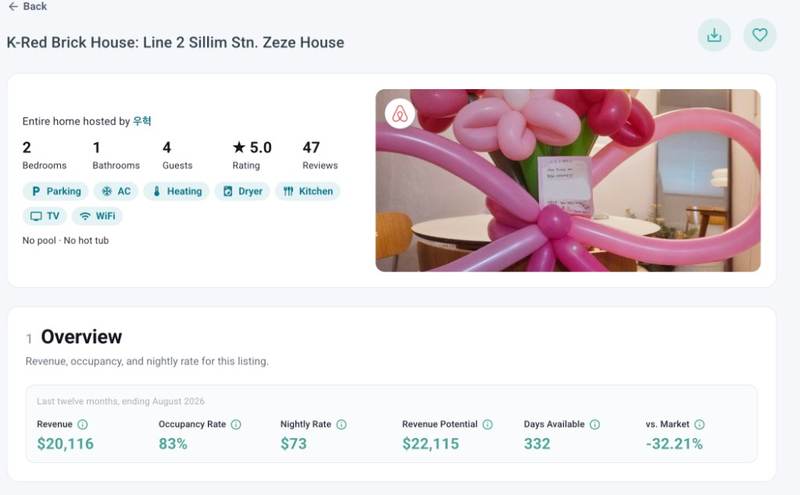
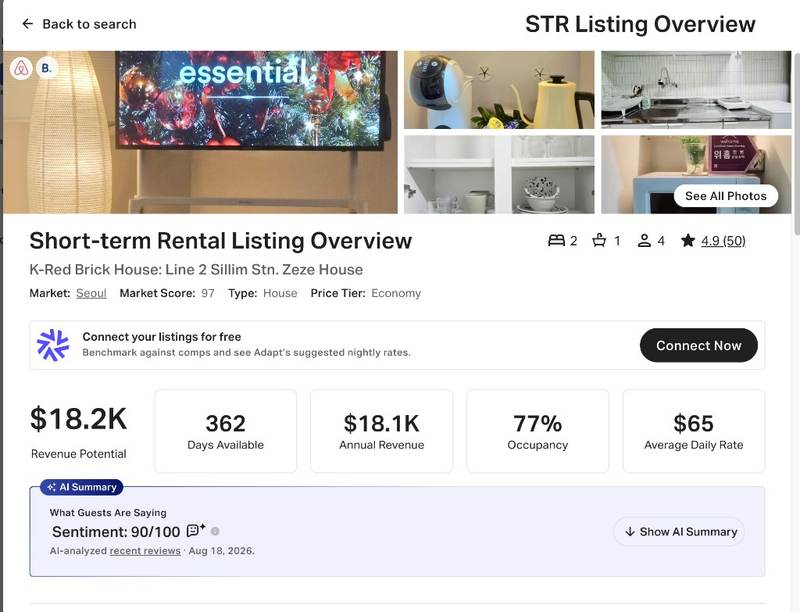
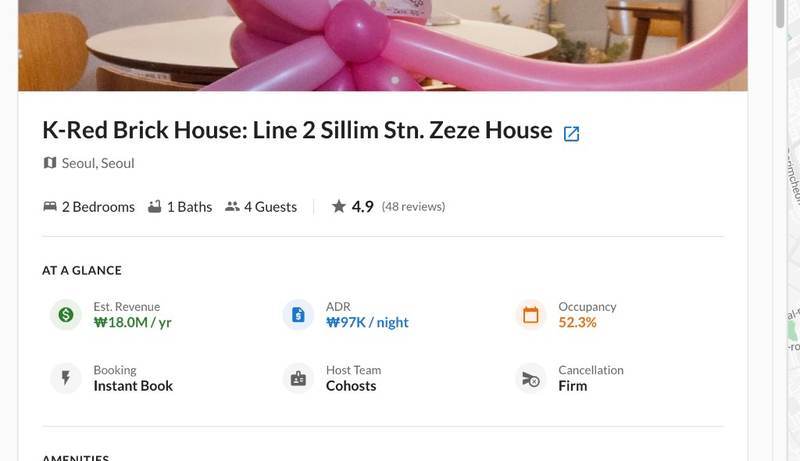
For Seoul, the owner benchmark is approximately $21,000 annually, with 65% occupancy and a $90 nightly rate. I am not publishing my own listing. All three vendor results refer to the same comparable listing, 1399722081611563865, a similar property in the same area with revenue in a comparable ballpark.
For Kuala Lumpur's Mid Valley area, the owner benchmark is approximately $17,000 annually, with 55% occupancy and an $85 nightly rate. Airbtics and AirDNA show comparable listing 673532432255578683. We could not locate that listing through AirROI's map, so we used nearby listing 821467587065975978 instead. Neither is my listing; both are similar Mid Valley properties with revenue in a comparable range.
The table preserves the rounded revenue figures recorded from the tools. Revenue gaps are calculated against the rounded $21,000 and $17,000 owner benchmarks. The AirROI Kuala Lumpur row is a comparison with a nearby property, not an accuracy test of the comparable listing used for Airbtics and AirDNA.
| Location | Source | Listing | Occupancy | ADR | Annual revenue | Revenue gap |
|---|---|---|---|---|---|---|
| Seoul | Owner benchmark | Owner | 65% | $90 | ≈$21,000 | — |
| Seoul | Airbtics | Comparable | 83% | $73 | ≈$22,000 | +4.8% |
| Seoul | AirDNA | Comparable | 77% | $65 | ≈$18,200 | −13.3% |
| Seoul | AirROI | Comparable | 57% | $71 | ≈$13,500 | −35.7% |
| Kuala Lumpur | Owner benchmark | Owner | 55% | $85 | ≈$17,000 | — |
| Kuala Lumpur | Airbtics | Comparable | 57% | $98 | ≈$18,900 | +11.2% |
| Kuala Lumpur | AirDNA | Comparable | 52% | $65 | ≈$10,700 | −37.1% |
| Kuala Lumpur | AirROI | Nearby | 34.5% | $80 | ≈$9,200 | −45.9% |
All figures are in USD. Occupancy and ADR may be rounded, and displayed annual revenue may use fewer than 365 available nights or a different reporting basis. Match reporting periods and revenue definitions before interpreting differences as estimation errors. BNBCalc was excluded because we could not inspect the target listings using our non-paid account.
Seoul: inspect occupancy and nightly rate separately
Airbtics' estimated annual revenue of $22,000 is close to the $21,000 owner benchmark. However, its 83% occupancy and $73 ADR differ from the benchmark's 65% and $90. A close annual total can conceal differences in the underlying estimates, which is why I look at all three metrics together.
AirDNA reports approximately $18,200, while AirROI reports $13,500 for the same listing. The spread gives us a reason to examine the reporting period, available nights and calendar evidence behind each result.
Inspect the listing through Airbtics, AirDNA or AirROI. Access may require an account or the appropriate subscription.
Kuala Lumpur: compare the same listing where possible
Airbtics reports $18,900 against the $17,000 owner benchmark, while AirDNA reports $10,700. Airbtics is closer in this example, although the reporting periods and revenue definitions still need to align before treating the gap as a measured accuracy result.
We could not find the comparable listing through the AirROI map workflow used in our research. Its $9,200 result therefore describes a nearby property. This does not establish AirROI's accuracy for the comparable listing or prove that the listing is absent from every AirROI dataset.
Our team also noticed nearby listings displaying occupancy around 5–10%. Those figures are worth investigating, but low occupancy alone does not establish a data error. A property may be new, inactive for part of the period or genuinely lightly booked.
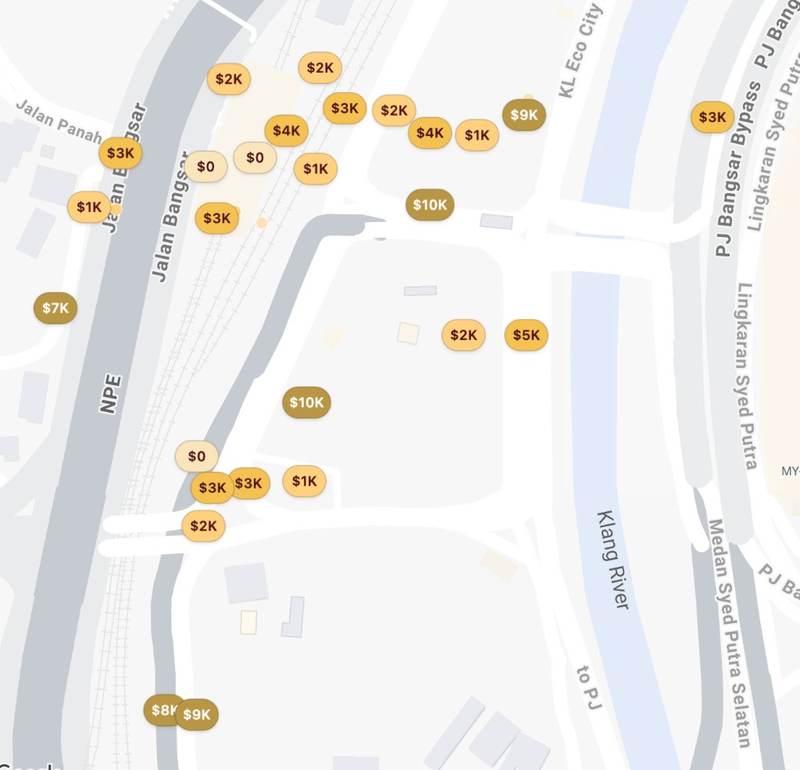
Inspect the comparable listing through Airbtics and AirDNA, or view the nearby listing used for AirROI.
What would make this a proper accuracy test?
For an accuracy test, I would use the same listing IDs and date range across vendors, then compare estimates with the host's reservation records. Revenue would need a consistent definition covering cleaning charges, taxes, discounts and platform fees. Booked nights, owner blocks and available nights would also need to be reconciled.
I would repeat that across a larger sample covering different markets, property types and operating patterns, and report the misses as well as the close estimates.
Two properties are not enough to rank the platforms. What they do show is why I want monthly history and calendar evidence, not just a headline number.
Products for buying a US short-term rental property
If your goal is to buy a property in the United States, a tool connecting rental data with homes for sale may be more useful than a broad international market screener. Airbtics also shows property price, gross rental yield and rent gap alongside revenue when you screen markets, including outside the US. Those are screening indicators for where to look next, not a marketplace of homes for sale.
Mashvisor combines rental analysis with property-search tools. Its Market Finder and Property Finder are relevant when you want to move from a location to potential purchases and compare rental strategies.
Chalet connects short-term rental research with buying and selling through real estate agents. Rabbu combines rental-income research with a marketplace for investment properties. Awning is also relevant to buyers researching investment opportunities and property-management support.
These are buying tools, not the same job as an international market screener. We left them out of the Seoul and Kuala Lumpur listing checks for that reason, not because we tested their accuracy and found it wanting.
Tools for property managers and Airbnb hosts
An operating host often needs to answer, “What should I charge next weekend?” or “Are bookings arriving more slowly than last year?” Historical market research helps, but forward-looking pricing and booking pace are more directly useful for those decisions.
PriceLabs, Wheelhouse and Beyond combine revenue-management workflows with market analysis. Their analytics should not be dismissed as minor extras: depending on the product, they include substantial market reports, competitive sets, booking trends and performance comparisons.
PriceLabs offers Market Dashboards and neighbourhood data. Wheelhouse offers Market Reports, Dynamic Sets and reporting. Beyond offers Market Insights. Compare the specific modules and integrations you need rather than assuming the basic pricing subscription includes every analytics feature.
Key Data and direct reservation data
Key Data is particularly relevant when you want to benchmark operating performance using reservation data received through property-management-system integrations.
Its documentation distinguishes direct PMS data from scraped platform observations. Direct data can show actual reservations and associated revenue for participating properties. Scraped data instead observes what a booking platform displays, requiring estimation to interpret rates and unavailable dates.
The source affects what you can conclude. Direct data is valuable for the properties in its sample; you should still ask how well that sample represents your market, especially independent hosts and properties outside participating management systems. Also confirm which source powers the specific report you are buying.
Enterprise analytics for tourism boards and researchers
In my conversations with government and destination teams, Lighthouse and STR are names that come up often. They belong in a wider hospitality-data discussion, but they should not be treated as interchangeable short-term rental products.
Lighthouse for destination-level accommodation analysis
Lighthouse's DMO and tourism offering explicitly covers hotel and short-term rental datasets. Its destination use cases include supply and performance analysis, visitor trends and comparison with other destinations.
That makes it relevant to a tourism organization studying the overall accommodation market rather than the income potential of one apartment.
CoStar with STR Benchmark for hotel benchmarking
CoStar with STR Benchmark is positioned as a hotel benchmarking product. Here, STR is the brand name; it should not be read as proof that the product is a short-term rental listing analytics service.
A destination team may use it to understand hotels alongside another provider's vacation-rental data. Ask specifically about the accommodation types and data sources covered by the proposed contract.
What enterprise buyers should specify
Enterprise purchasing is often about the dataset and its permitted uses as much as the dashboard. Define the geography, accommodation types, reporting frequency, historical period, listing-level fields and delivery format you need.
Then ask for a sample and a data dictionary. Establish whether the figures are observed, estimated or directly reported; how duplicates and inactive properties are handled; and which publication or redistribution rights are included.
Airbtics and AirDNA also offer enterprise services, while other platforms provide APIs or data exports. Evaluate those separately from their self-service interfaces: a capability absent from a public dashboard may still be available through a different product.
Frequently asked questions about short-term rental analytics
-
What is the best short-term rental analytics software?
For the research workflow reviewed here, Airbtics is my choice for screening international markets and inspecting listing evidence. AirDNA is worth considering for market and submarket analysis, BNBCalc for moving into property investment calculations, and AirROI for free exploration. Operating hosts should also evaluate revenue-management tools rather than limiting their search to investment research platforms.
-
Which short-term rental analytics tool is most accurate?
This review does not establish an overall accuracy winner. Airbtics' revenue figures were closest to the owner references shown, but the sample is small and the Kuala Lumpur AirROI row uses a nearby listing. A valid accuracy comparison needs matched properties, dates and revenue definitions checked against booking records.
-
Why does listing-level data matter?
Listing-level data helps you investigate whether a market statistic reflects properties relevant to your analysis. Monthly history can reveal seasonality and inactive periods. Calendar observations provide further evidence, although neither automatically proves the estimated bookings or revenue are correct.
-
Is three years of market data the same as three years of listing data?
No. Market history is an aggregate across properties. Listing history describes individual properties. A provider may offer different historical periods through its dashboard, paid plans, API and enterprise datasets. Check the exact series available for the property and period you need.
-
Is there a free short-term rental analytics tool?
AirROI advertises free core market analytics, and other providers offer limited free access or trials. Check whether the free product includes the listing detail, history, filters and export options required for your task.
-
Are customer reviews evidence of data accuracy?
Reviews can help you assess customer experience, support and usability. They do not validate revenue or occupancy estimates. A rating based on a handful of reviews also has a different evidential weight from one based on hundreds, even when the headline scores look similar.
My recommendation: choose the workflow, then inspect the evidence
If you are starting with a broad investment search, begin with a tool that helps you discover and compare markets. If you already operate rentals, prioritize booking pace, competitive positioning and pricing workflows. If you are buying data for research, evaluate the dataset and definitions directly.
For my own market research, I want to move from a country shortlist to a neighbourhood and then to the listings supporting the estimate. That is the workflow we have built around Airbtics Explorer, Watchlist and listing-level analysis.
Use the listing examples above to see what an evidence review looks like. If your question is about one specific property's potential, start with our Airbnb calculator comparison or the Airbtics Airbnb income calculator.
Explore AirbticsSources and scope
Hands-on workflow observations and the property figures were supplied by the author and his team. Public product documentation was used to check broader feature and pricing claims.
- Pricing: AirDNA; Airbtics; BNBCalc; AirROI's public product offering.
- Discovery and history: AirDNA Market Explorer; AirDNA subscription documentation; AirDNA map and listing view; BNBCalc product FAQ; AirROI API listing history.
- Public review profiles: Airbtics; AirDNA; BNBCalc; AirROI. Ratings and counts recorded on October 20, 2026; recheck before publication.
- Operations and benchmarking: PriceLabs market analytics; Wheelhouse reporting; Beyond Market Insights; Key Data's direct versus scraped data explanation.
- Enterprise scope: Lighthouse for DMOs; CoStar with STR Benchmark.