In the fast-paced world of property investment, static data simply won’t cut it. Welcome to a new era of success with dynamic analytics provided by Airbtics. Gain a competitive edge as you access real-time insights that adapt as you explore different locations on the map. Witness the transformation of key metrics like potential revenue, occupancy rate, nightly rate, and property details with every move.
Static Data vs Dynamic Data: Which one is better?
When we talk about static data, it means the data is in a stationary state and is likely not modified; while dynamic data is likely to change and periodically updated.
In terms of market analysis in short-term rental investments, dynamic analytics is most useful since it provides up-to-date insights that could help any investors and managers to analyze market trends.
Comparison: Static Data vs Dynamic Data
Static Data Sample
You can see here that the Average Daily Rate, Occupancy Rate, and Revenue aren’t changing when you move the map to a specific location.
VS
Dynamic Data Sample
While on dynamic analytics, data changes when you move your map to your preferred area.
Airbnb profit
Airbnb profit
Unfortunately, not all data analytics tools offer dynamic data. Airbtics is the most trusted app for this must-have feature. In this tutorial, we will go through how you can use it to maximize the potential of your investment to increase cash flows.
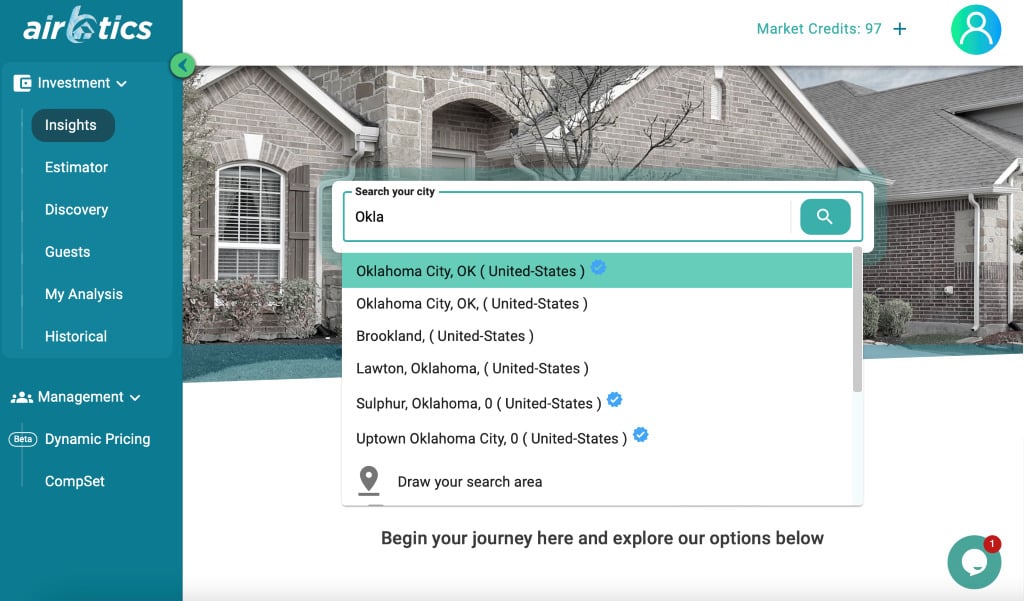
Start moving your map to have the full experience!
Every time you move your map, all data from the potential revenue, occupancy rate, and nightly rate, to property type, size, and channel will also change depending on what the map covers in the dashboard. This feature allows every investor and manager to analyze the market with customizability and accuracy.
For instance, you want to know the market in Downtown Oklahoma City. Just zoom in on the specific area to capture the data.
Use color-coded heatmap for deeper insights
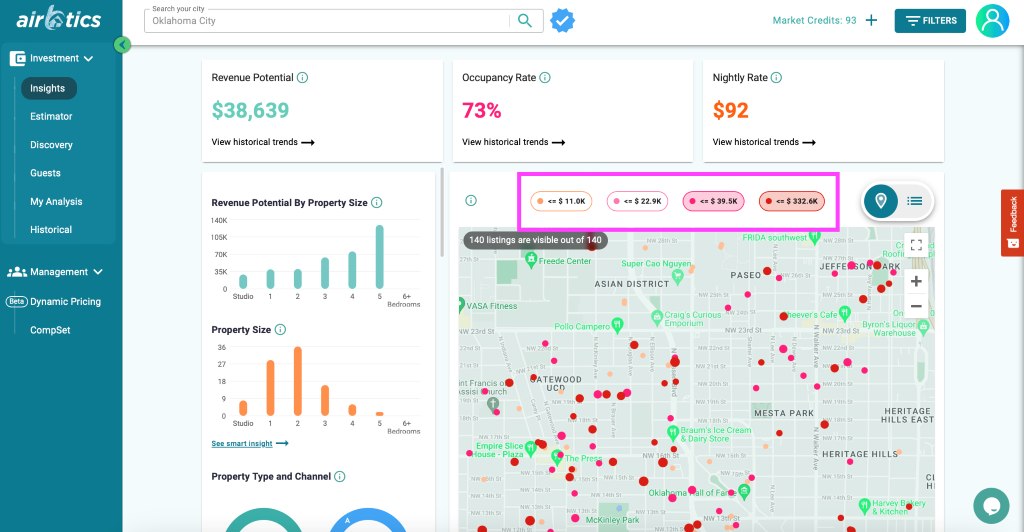
Let’s say, you are aiming to analyze Airbnb listings with >$30k and <$332.6k annual revenue. Use the color-coded heat map to filter out the visibility of the data in the map. For instance, you’ll discover that there are only 140 listings in Oklahoma City that have this range of annual revenue.
Potential revenue, occupancy rate, nightly rate, and property size will also change depending on your chosen range. In short, the app will automatically calculate the potential revenue of your preferred listings without the hassle of doing it by yourself. This lies the power of having dynamic data!
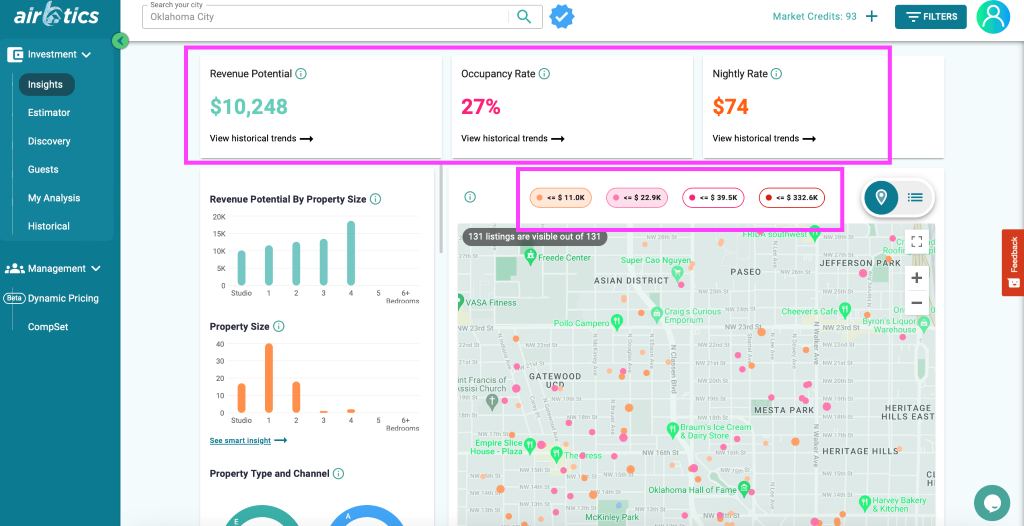
This sample shows the data of <=$11k to <=22.9k.
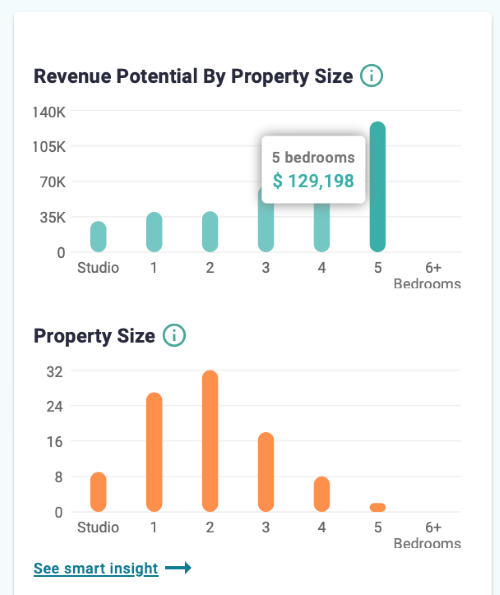
By using the color-coded heatmap, you can analyze which has the biggest returns per property size and decide whether it is better to invest in a 4-bedroom property or a studio apartment in Oklahoma City.
Customize your Search with Advanced Filter
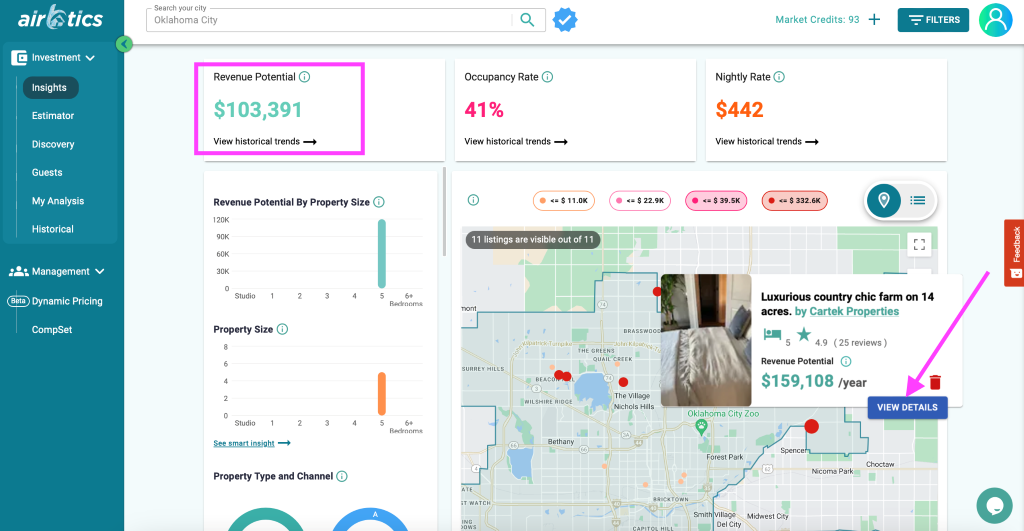
Another powerful feature in the Airbtics dashboard is its Advanced Filter. Let’s say, you decided to go for a 5-bedroom apartment in Oklahoma City with potential revenue of $129k.
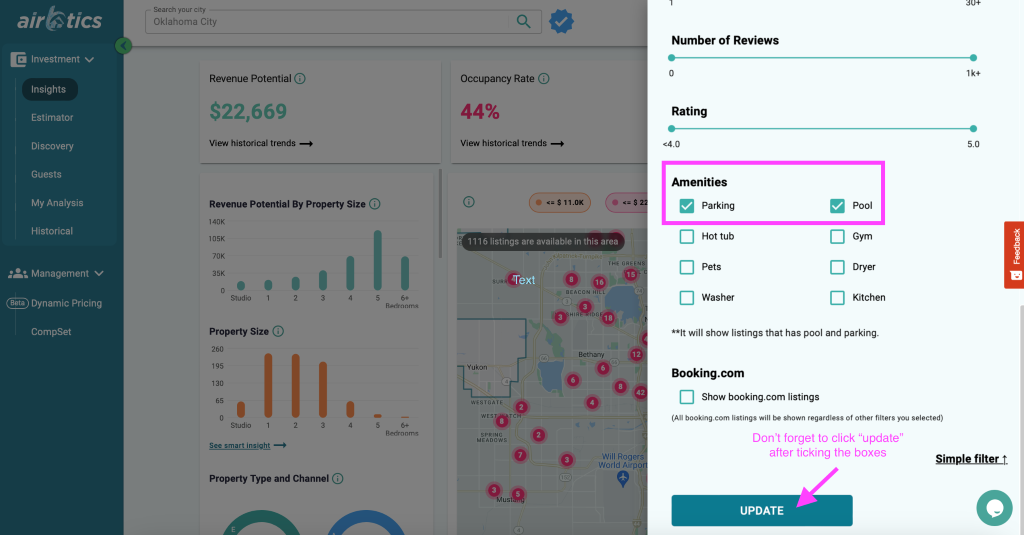
However, you would like to know how many listings are there if you will purchase a property with a pool and parking. In this case, you can use the Advanced Filter to customize the visible data in the dashboard.
Data will re-generate according to your filters. Based on our example, it looks like there are 11 Airbnb listings in Oklahoma City that have a pool and parking with an annual revenue potential of $103k. You may also view the details of your potential competitors (eg. Luxurious Country Chic Farm) and check their performance.
Become a better decision-maker with Dynamic data
It may look a little complicated for rookies, but having all these data at your fingertips can help you make better decisions for your business and investment. For instance, you realized investing in a 5-bedroom in Oklahoma won’t give you better returns. Then it’s better to look for another market.
Just repeat the steps of searching for a market and maximize the features of our dashboard. It’s fast and easy with dynamic analytics compared to static ones. You save the most valuable thing in this world–your time.
 Airbtics | Airbnb Analytics