
With this all-time high interest rate, more and more rental property owners are looking for a way to increase their rental income. If you own a residential property, short-term rental gives you the highest cash flow. Multi-family (HMO) or mid-term rental comes second.
Airbnb is the best platform to list your short-term rental, VRBO comes second. That’s why it’s important to know how to analyze Airbnb property using short-term rental calculator.
Here’s a summary on how to analyze an Airbnb property
To estimate your potential Airbnb revenue:
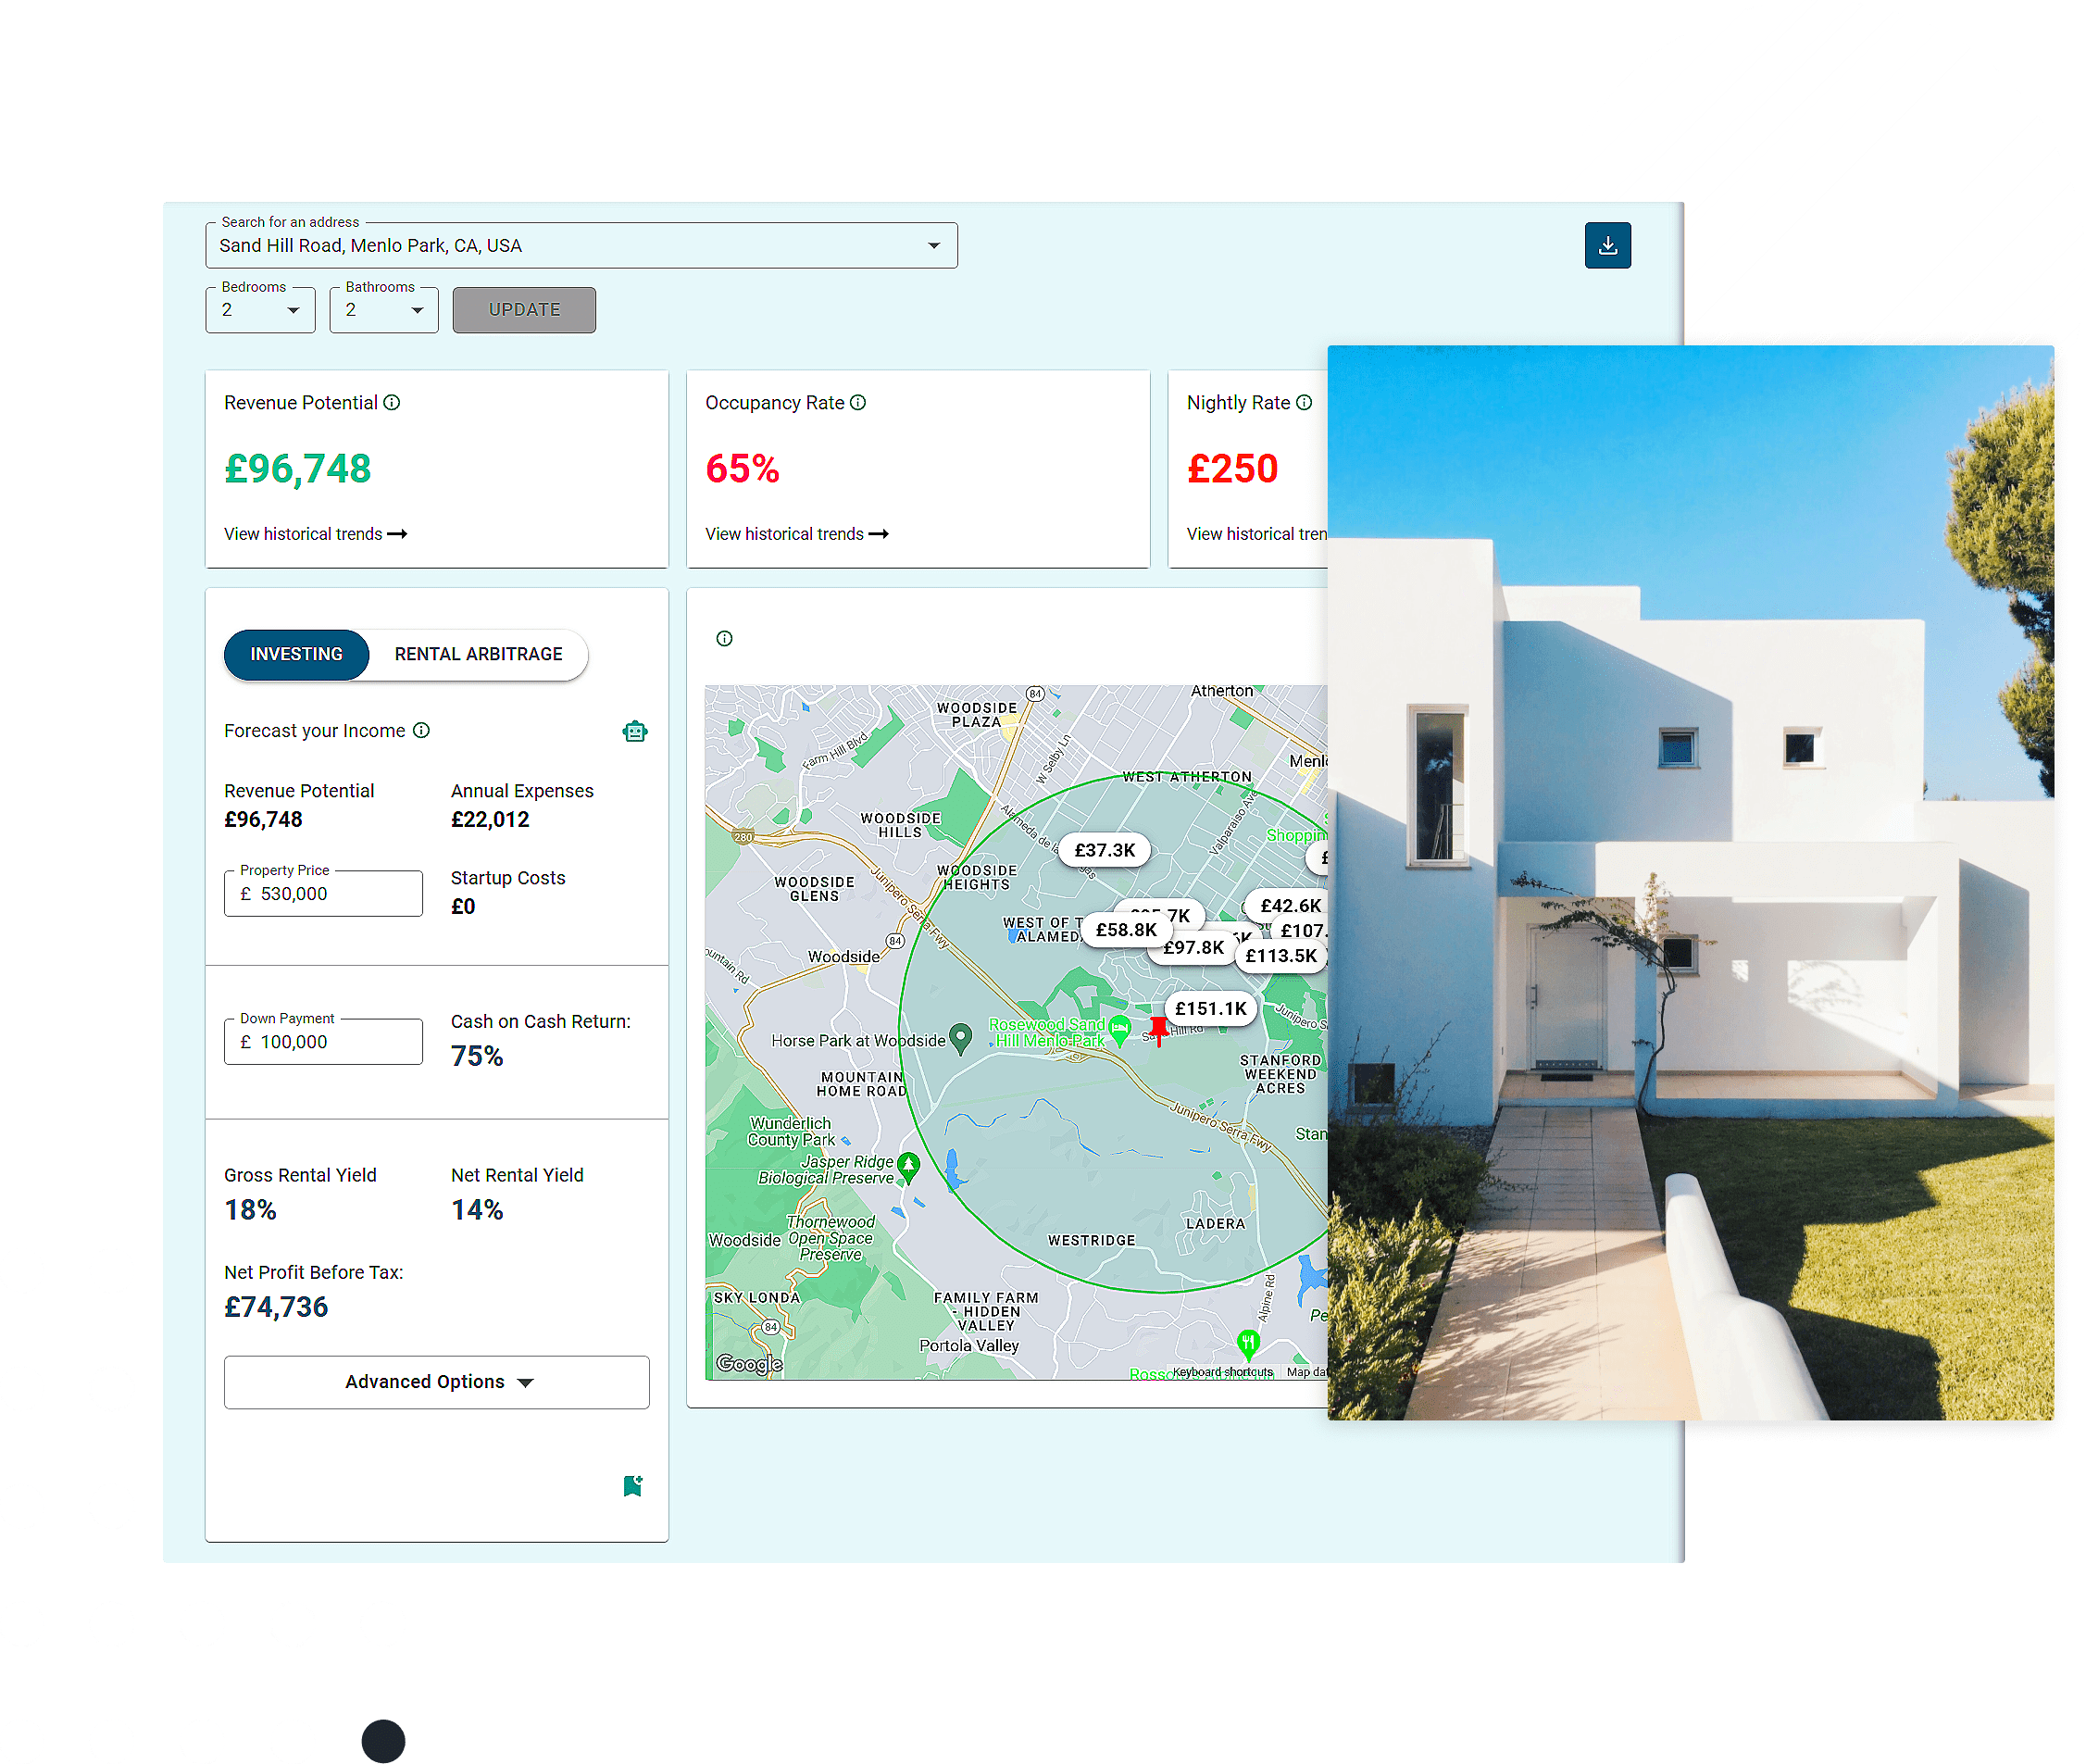
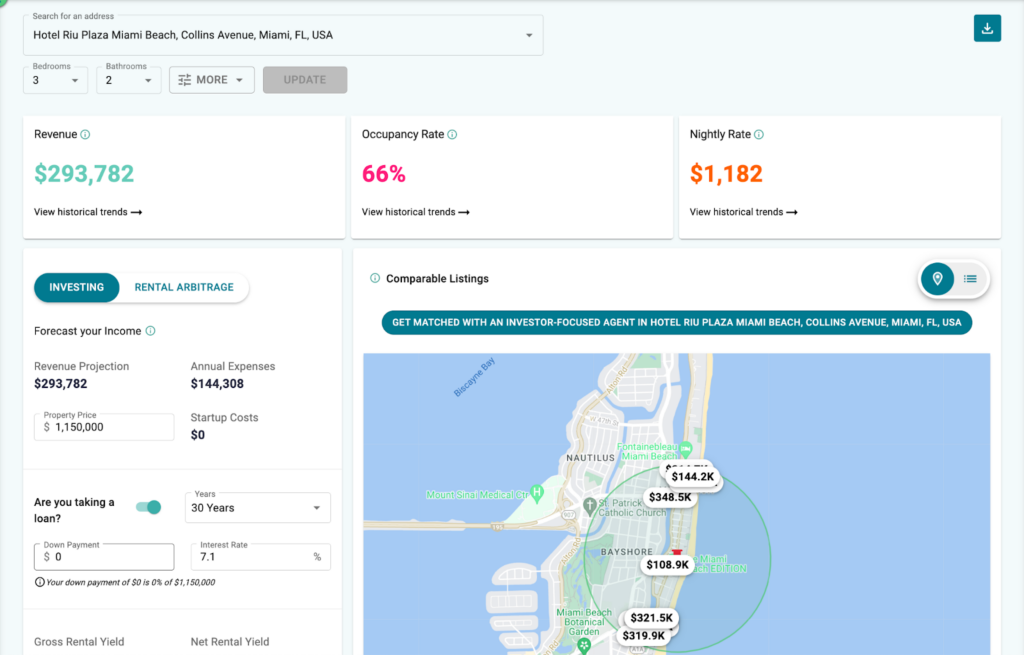
Unlike hotel rooms, every short-term rental is unique. That’s why your estimated revenue can vary depending on amenities, location, or even guest reviews. Now, it’s time to head over to Airbnb Analyzer to do a more in-depth analysis.
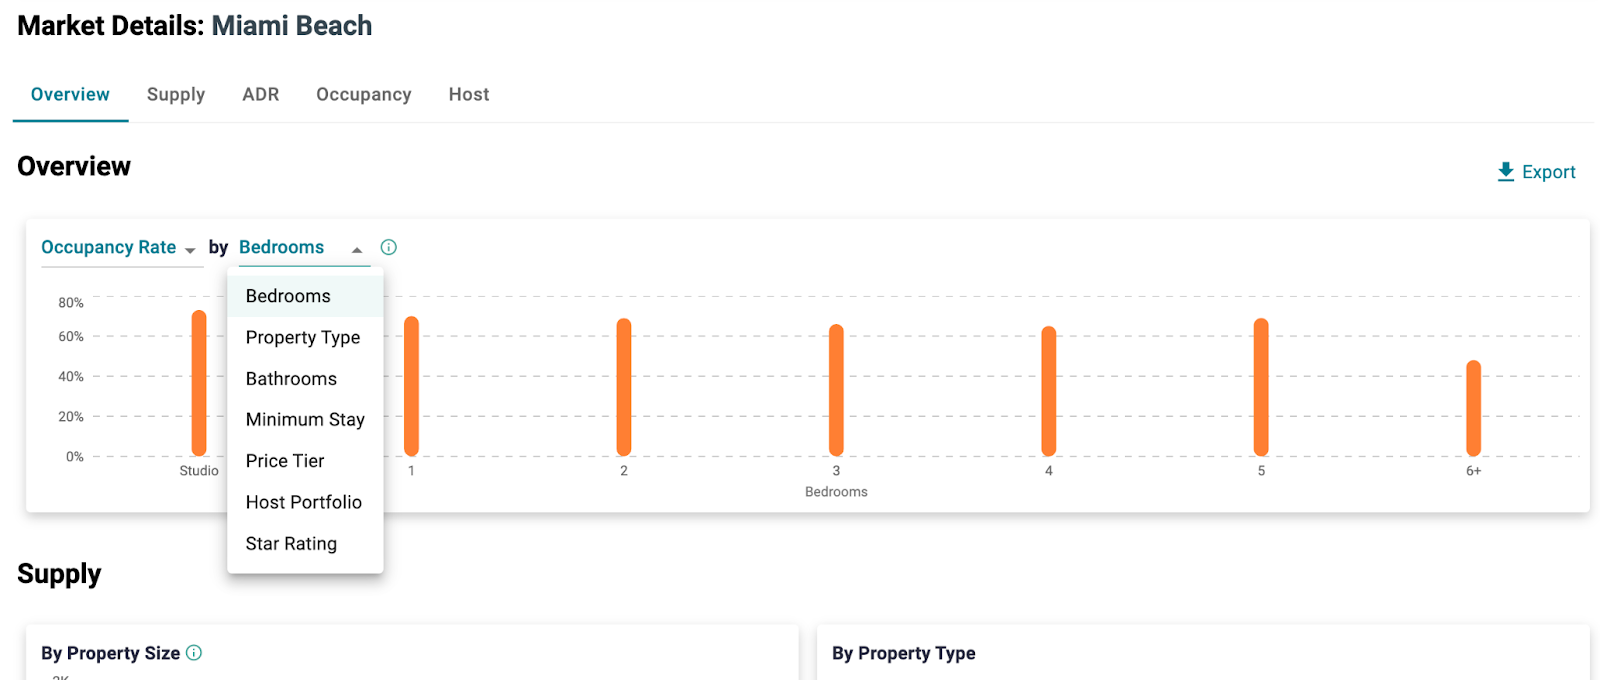
In the dashboard, take a look at the Overview section in Market Details. You can compare how occupancy rates / revenue / daily rates of different numbers of bedrooms, property types, review ratings, and so on. In the example of Miami Beach, 6+ bedrooms have a lower average occupancy rate than smaller-sized properties.
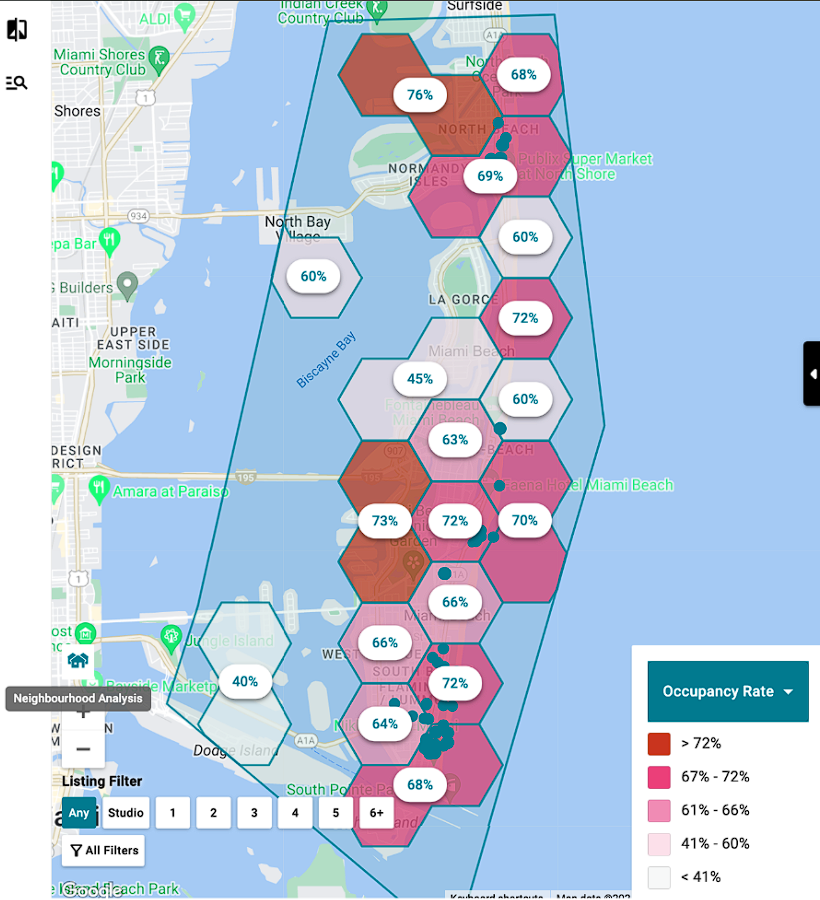
Location significantly impacts revenue. Use the “Neighbourhood analysis” feature on the map to see occupancy rates represented by color intensity.
Tip: Filter for beachfront properties to check their earnings.
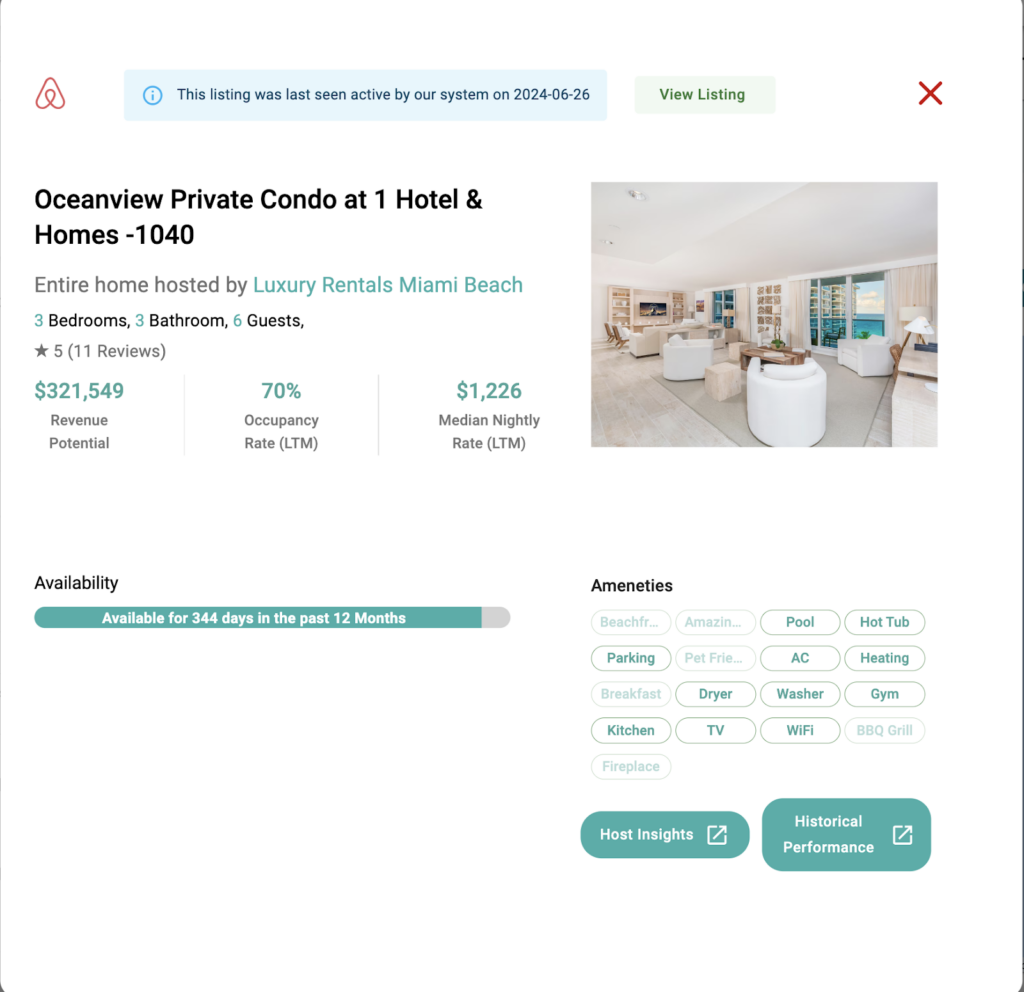
Use the amenities filter to see listings with specific amenities. For instance, in Mexico City, listings with AC charge a 50% premium. Verify this by checking statistics of listings with and without AC.
Tip: Check popular amenities like pools and hot tubs, as they are common in short-term rentals.
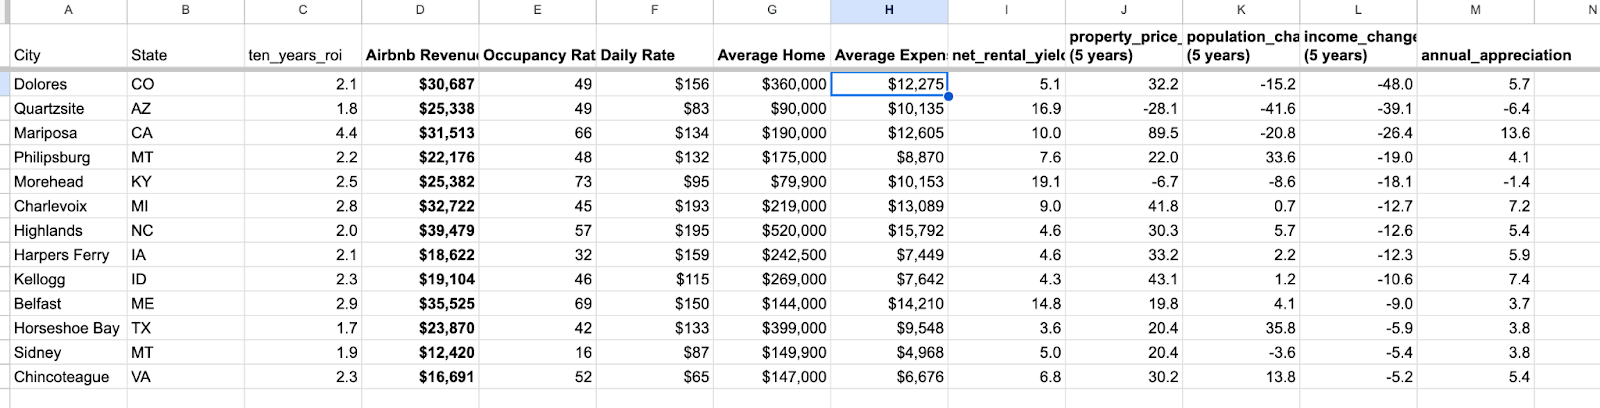
Besides cash flow, evaluate if the market is a good investment by examining:
Home Affordability: Compare property price or rent growth to income growth. Favorable markets have property price growth supported by income growth.
Demographic Trends: Look at population trends and compare them across markets. Here’s an an example on Google Sheets.
Here, we’ve written a blog about the complete list of host expenses. Make sure to check this out!

If you want this analysis report for your desired markets, please contact [email protected]. Let us know the list of markets for which you want us to do investment analysis. This is a paid service. If you include the link to this blog, it’ll help us respond faster.


