Indonesia may have been late to start in the Airbnb market but it’s one of the fastest-growing countries in Southeast Asia in terms of inbound travel. Indonesia ranked 20th in the world tourist industry in 2017. [1] Now, because of the worldwide lockdowns due to coronavirus pandemic, there is a significant threat in the whole Airbnb industry.
What will happen to the short-term rental market? Can the industry’s leading home-sharing industry survive? What is the current state of Indonesia’s Airbnb market? Let’s find out.
How Many Total Airbnb Listings are there in Indonesia?
Indonesia currently has over 61,000 listings as of May 2020. The top location is the Bali province which has around 34,000 listings. Next in rank is Jakarta with 6,000 listings.
Surabaya and Medan are the second and the third largest cities by population, they only have 870 and 250 Airbnb listings. For example, Paris has a similar size of the population as Surabaya, and it has 30,00 Airbnb listings.
Bali province shows the highest number of listings in all the Indonesian AirBnB market. It surpassed Jakarta which is Indonesia’s capital city and home to over 10 million people in terms of the average daily rate.
What is the average daily rate of Airbnb in Indonesia?
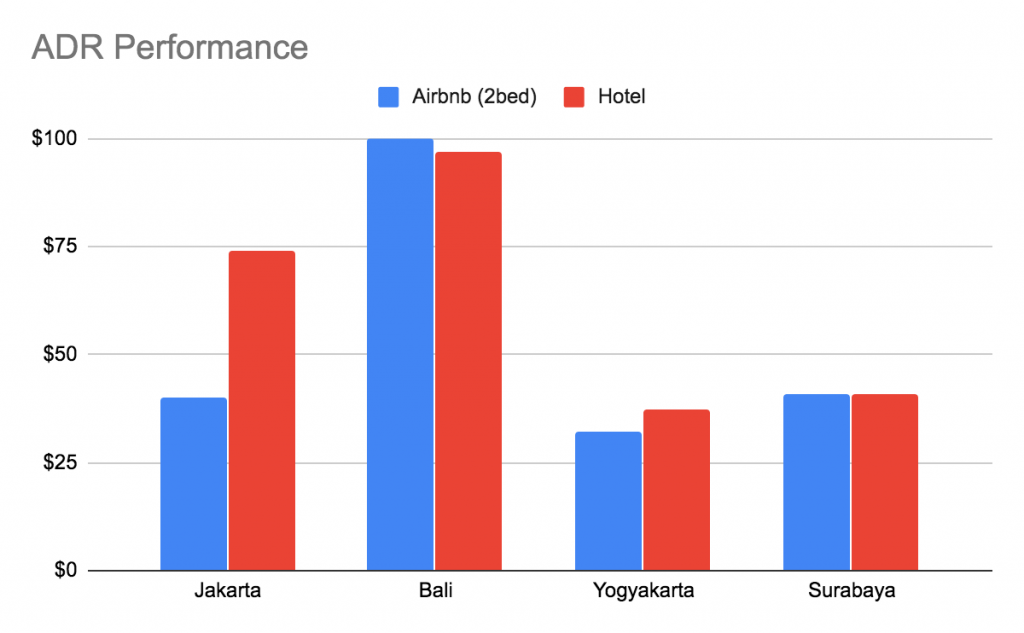
This chart shows the average daily rate of Airbnb 2 bedroom apartments and hotels [2] in Indonesia. Based on the statistics, the ADR of a 2 bedroom apartment in Indonesia is $100. The rest of the locations including Jakarta, Yogyakarta, and Surabaya are in the $30 – $40 range.
Bali has a lot more international travellers than Jakarta. We can observe here that there is a positive correlation between the high ratio of international travellers and high Airbnb ADR.
What is the occupancy rate of AirBnB in Indonesia?
Source: Airbtics
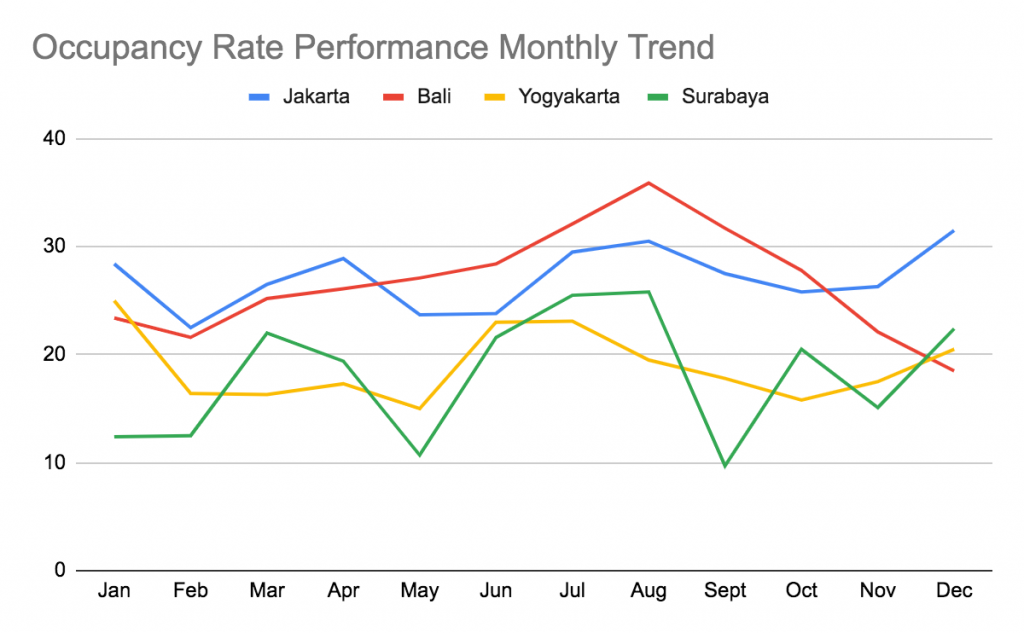
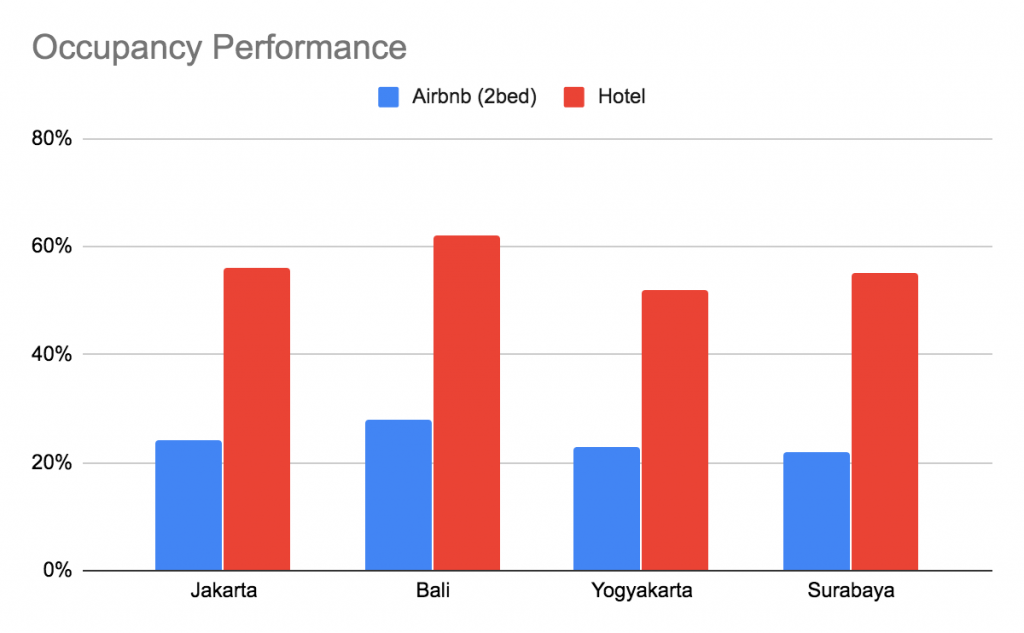
The chart shows the yearly occupancy rate in Jakarta, Bali, Yogyakarta, and Surabaya (Data Captured in May 2020). The occupancy rates are calculated with the past three years of historical occupancy rate but weighing more to more recent occupancy rate.
The hotel occupancy rate is for 2016, and the Airbnb occupancy rate is calculated from the data between 2017 – 2020. Still, it is clear that the occupancy rate of hotels is higher than the occupancy rate of Airbnb.
Source: Hotel (STR, 2016), Airbnb (Airbtics 2020)
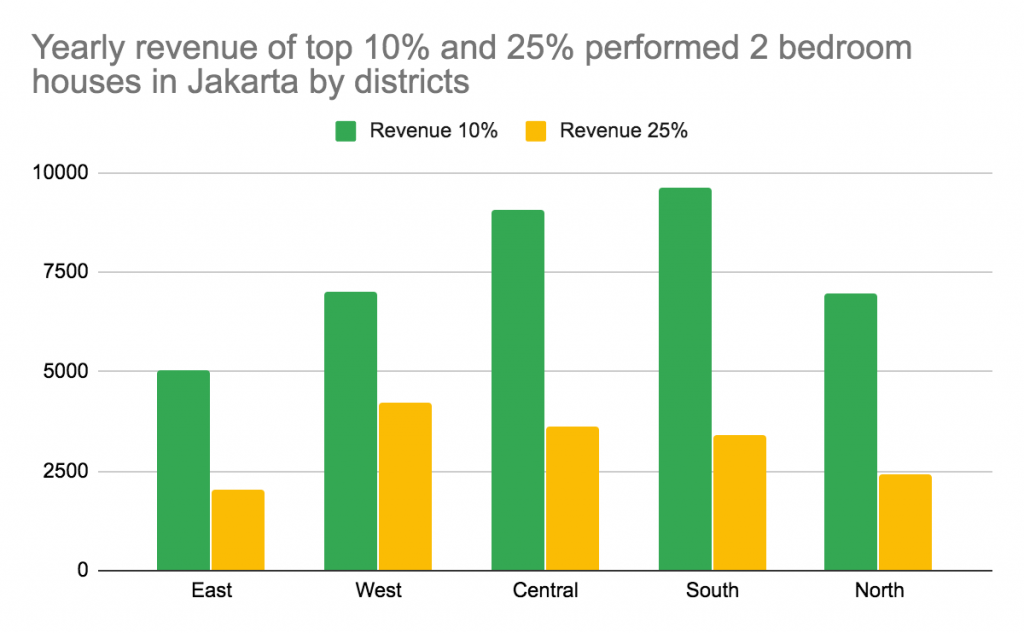
What is the average revenue of the top 10% and 25% performing 2bedroom houses?
Source: Airbtics
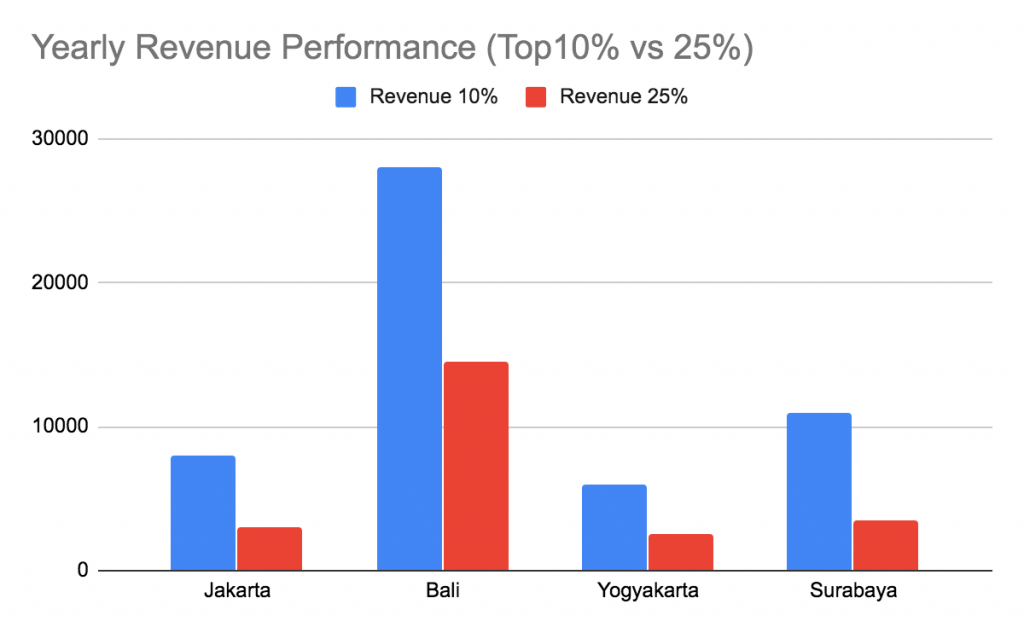
Here’s a graph showing the most profitable or the top-performing 10% 2-bedroom houses in Indonesia. Based on their yearly revenue, top10% 2-bedroom properties in Bali have estimated annual revenue of $28,000. This is followed by Surabaya at around $11,000
The chart shows the yearly revenue of the top 10% and 25% 2BR houses in Jakarta. South Jakarta’s top 10% leads with $9,000 yearly revenue followed by the top 10% of Central Jakarta which is at $8,000.
Source: Airbtics
Amenities
Based on our data, 85% of 2BR houses in Bali and Jakarta have pools and only around 17% of the 2BR houses have hot tubs. Amenities are important factors that impact travel experience, especially for foreign travellers. When it comes to Airbnb vacation rentals, many people are looking for functionality first then comfort, and lastly perks such as pools, hot tubs, and free parking.
Conclusion
Jakarta, Surabaya, and Yogyakarta are large cities with a high ratio of domestic tourist, and their home-sharing markets are still at an early stage. Their ADR and the occupancy rate are low in comparison to the hotel industry. So, now is a good time to travel to these cities in Indonesia. Also, if you are thinking about starting an Airbnb in Indonesia, there are good opportunities, because there isn’t much competition due to the small amount of Airbnb supply.
Stay Insightful
Airbtics is the short-term and vacation rental market research platform. We help rental hosts, property investors, realtors to understand the rapidly changing rental market by providing insights via our web service.
If you have any further questions about the case study, please contact us at [email protected].
All the data here without explicit references are sourced and processed by our technologies.
 Airbtics | Airbnb Analytics