nyc airbnb occupancy rate
Key Takeaway
- Learn how much the NYC Airbnb occupancy rate fluctuates when major events are happening.
- This article offers valuable New York real investing information on how much you can adjust the nightly rate of your short-term rental property.
Introduction
They say, “if you can make it here, you can make it anywhere.” But you’re already in New York and can do better in its Airbnb market by using short-term rental data analytics. In this blog, we will talk about events in New York that draw more than the usual number of guests for your Airbnb rentals!
Can you do short-term rentals in New York City?
With proper registration, short-term rentals are allowed in New York City. The local government also compels you to share your hosting and listing data. You can decide not to do so. However, you can only host a tenant for at least 30 days. Complaints can be easily submitted. So, make sure that you follow the local regulations regarding short-term rentals.
How profitable is Airbnb in NYC?
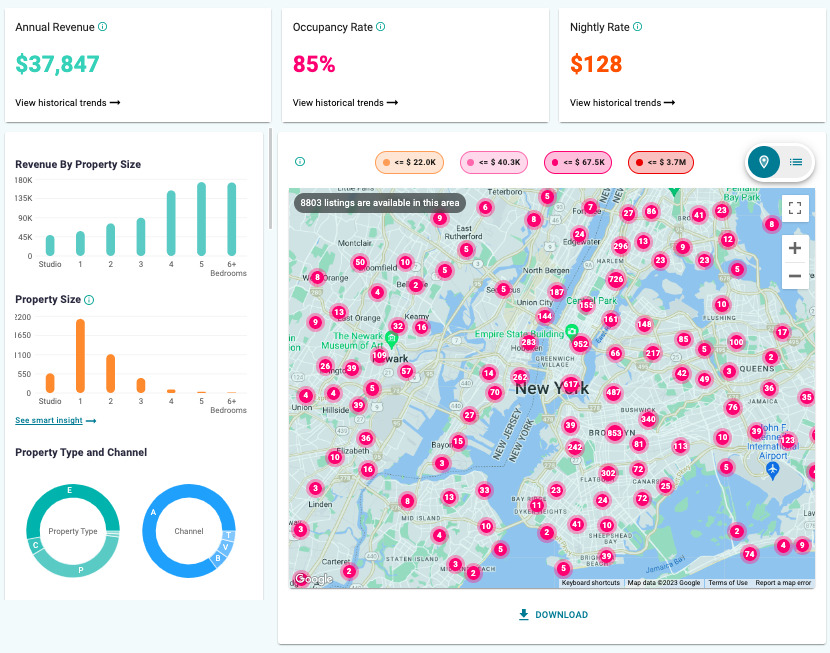
New York City currently has 8,844 listings. An NYC host with a 2-bedroom Airbnb unit can charge an average nightly rate of $189. The said property size brings in $62,810 annual revenue with a staggering occupancy rate of 89%.
Top NYC Events Every Airbnb Host Should Know
Tourists from every part of the world come to New York City throughout the year. But there are just events that make spikes in the number of visitors. Using the Airbtics Dashboard, we can know how much Airbnb hosts in various New York real estate markets earn during the months of major events:
1. St Patrick’s Day
- Attendees: 150,000 people
- When: March
- Area: Midtown Manhattan
- Best Property size: 2 bedrooms
- March Occupancy Rate: 100%
- March Revenue: $7,377
- March Nightly Rate: $277
- Airbnb annual revenue: $111,038
- Average occupancy rate: 92%
2. Tribeca Film Festival
- Attendees: 150,000 people
- When: June
- Area: Lower Manhattan
- Best Property size: 3 bedrooms
- June Occupancy Rate: 100%
- June Revenue: $24,188
- June Nightly Rate: $762
- Airbnb annual revenue: $219,387
- Average occupancy rate: 89%
3. National Puerto Rican Day
- Attendees: 1.5 Million
- When: June
- Area: Midtown Manhattan
- Best Property size: 2 bedrooms
- June Occupancy Rate: 100%
- June Revenue: $11,564
- June Nightly Rate: $384
- Airbnb annual revenue: $111,038
- Average occupancy rate: 92%
4. NYC Pride Parade
- Attendees: 2.1 Million
- When: June
- Area: Lower Manhattan
- Best Property size: 3 bedrooms
- June Occupancy Rate: 100%
- June Revenue: $24,188
- June Nightly Rate: $762
- Airbnb annual revenue: $219,387
- Average occupancy rate: 89%
5. US Open
- Attendees: 700,000+
- When: August
- Area: Flushing
- Best Property size: 2 bedrooms
- August Occupancy Rate: 89%
- August Revenue: $5,135
- August Nightly Rate: $197
- Airbnb annual revenue: $50,282
- Average occupancy rate: 77%
6. New York Comic Con
- Attendees: 200,000
- When: October
- Area: West Side
- Best Property size: 2 bedrooms
- October Occupancy Rate: 100%
- October Revenue: $9,302
- October Nightly Rate: $345
- Airbnb annual revenue: $110,944
- Average occupancy rate: 88%
7. Village Halloween Parade
- Attendees: 50,000 – 60,000
- When: October
- Area: Midtown Manhattan
- Best Property size: 2 bedrooms
- October Occupancy Rate: 100%
- October Revenue: $10,382
- October Nightly Rate: $380
- Airbnb annual revenue: $111,038
- Average occupancy rate: 92%
8. New York International Auto Show
- Attendees: 1 Million people
- When: April
- Area: Midtown Manhattan
- Best Property size: 2 bedrooms
- April Occupancy Rate: 100%
- April Revenue: $9,906
- April Nightly Rate: $334
- Airbnb annual revenue: $111,038
- Average occupancy rate: 92%
Conclusion
Buying property in NYC began has cost you a lot of money. So, it’s important to not leave money on the table should you decide to Airbnb your New York property. Part of this is adjusting your nightly rate without losing the number of bookings. And as we have learned, you can definitely do that with the help of short-term rental data analytics. You can start exploring what it can do for you by trying this Airbnb Profit Calculator for free!
On the other hand, you can research more profitable markets with the help of reliable analytics tools such as Airbtics. By doing so, you can also discover the average Airbnb occupancy rate in other cities, their annual revenue and much more!
Monitor Your Market & Have An Empire State of Returns!


