Mejores lugares para iniciar un Airbnb en Latinoamérica
Usando reseñas de huéspedes de Airbnb, identificamos miles de hotspots turísticos en Latinoamérica: lugares que los huéspedes mencionan cuando se alojan cerca. Para cada uno, medimos cuánto ingreso extra generan los alquileres vacacionales frente a anuncios similares en el mismo mercado.
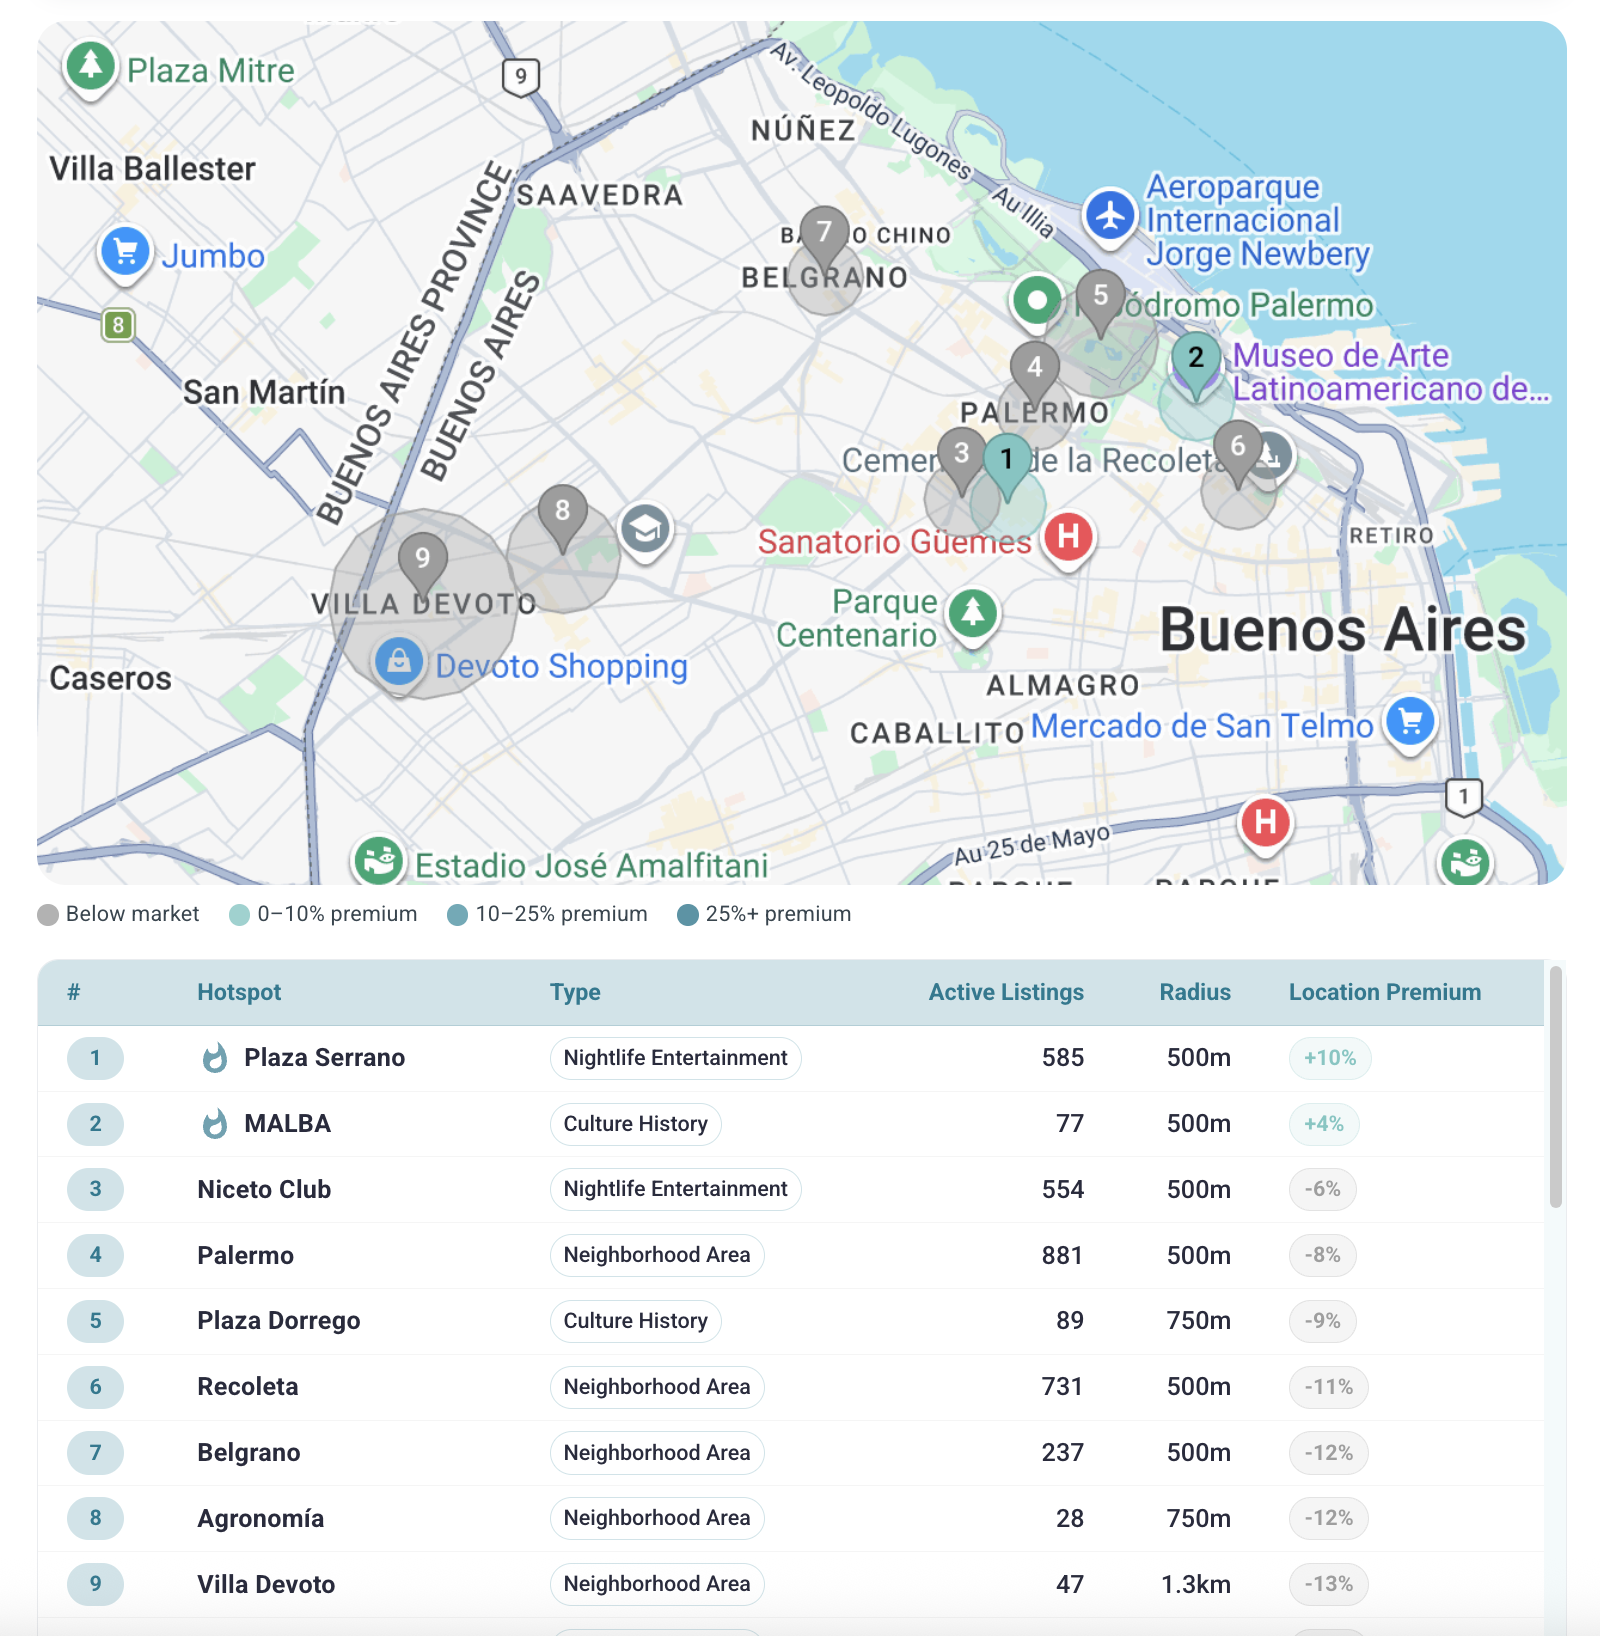
La tabla muestra 50 mercados de nuestra guía de mejores mercados Airbnb en Latinoamérica, con un hotspot principal por mercado, en orden de ranking de mercado y no por premium.
Para todos los tipos de hotspots, consulta nuestra guía global de mejores lugares para iniciar un Airbnb.
We pulled hotspots from Airbnb review text. These are locations guests name in reviews, not just entries from a generic tourist attraction list.
For each hotspot, we set a search radius based on listing density nearby. In central London, a major landmark might use a 500m radius. A national park might need 5 to 10 km.
For listings near each hotspot, we predicted revenue using comparable listings in the same market (bedrooms, property type, amenities, review scores). Actual revenue minus predicted revenue is the location premium. The table shows the average premium for nearby listings.
Last updated: June, 2026
Top 50 mercados y hotspots en Latinoamérica
| Rank | Market | Hotspot Name | Category | No. of Listings | Premium % | Country |
|---|---|---|---|---|---|---|
| 1 | Sao paulo | Interlagos | Neighborhood Areas | 17 | +67% | Brazil |
| 2 | Rio de janeiro | Leblon | Neighborhood Areas | 918 | +56% | Brazil |
| 3 | Buenos aires | Plaza Serrano | Nightlife & Entertainment | 585 | +10% | Argentina |
| 4 | Mexico city | Polanco | Neighborhood Areas | 133 | +21% | Mexico |
| 5 | Florianópolis | Cacupé | Neighborhood Areas | 30 | +31% | Brazil |
| 6 | Lima | Larcomar | Shopping & Retail | 301 | +16% | Peru |
| 7 | Medellín | El Tesoro Parque Comercial | Shopping & Retail | 303 | +34% | Colombia |
| 8 | Bogotá | Carrera Séptima | Geographic Areas | 67 | +80% | Colombia |
| 9 | Santiago | Providencia | Neighborhood Areas | 66 | +12% | Chile |
| 10 | Ubatuba | Praia de Itamambuca | Beaches & Coastlines | 166 | +26% | Brazil |
| 11 | Cartagena | Cartagena Historic Center / Walled City | Culture & History | 596 | +28% | Colombia |
| 12 | Playa del carmen | Playacar | Resort & Hotel Areas | 153 | +19% | Mexico |
| 13 | Guanajuato city | Guadalajara | Downtown & City Centers | 54 | -11% | Mexico |
| 14 | Guarujá | Astúrias Beach | Beaches & Coastlines | 164 | -2% | Brazil |
| 15 | Puerto vallarta | Sayan | Resort & Hotel Areas | 312 | +26% | Mexico |
| 16 | Praia grande | Vila Caiçara | Neighborhood Areas | 557 | -10% | Brazil |
| 17 | Bahia de banderas | Kupuri Beach Club | Beaches & Coastlines | 20 | +97% | Mexico |
| 18 | Martinique | Sainte-Luce | Neighborhood Areas | 33 | +25% | Martinique |
| 19 | Tulum | Tulum Beach Clubs | Geographic Areas | 15 | +158% | Mexico |
| 20 | Salvador de bahia | Canela | Neighborhood Areas | 182 | +21% | Brazil |
| 21 | São sebastião | Calhetas Beach | Beaches & Coastlines | 41 | +20% | Brazil |
| 22 | Cabo frio | Forte São Mateus | Culture & History | 444 | +6% | Brazil |
| 23 | Cancun | Mandala Cancun | Nightlife & Entertainment | 119 | +82% | Mexico |
| 24 | Brasilia | Asa Sul | Neighborhood Areas | 34 | +16% | Brazil |
| 25 | Bombinhas | Praia da Sepultura | Beaches & Coastlines | 40 | +3% | Brazil |
| 26 | Guadeloupe | Sainte-Anne | Neighborhood Areas | 129 | +12% | Guadeloupe |
| 27 | Guadalajara | Andares | Shopping & Retail | 55 | +55% | Mexico |
| 28 | Mazatlan | Playa Gaviotas | Beaches & Coastlines | 580 | +5% | Mexico |
| 29 | Mérida | Mérida Cathedral | Culture & History | 45 | +12% | Mexico |
| 30 | Curitiba | Batel | Neighborhood Areas | 177 | +37% | Brasil |
| 31 | San Juan | Plaza Las Américas | Shopping & Retail | 81 | +60% | Puerto Rico |
| 32 | Punta cana - caribers | Indigenous Eyes Ecological Reserve | Parks & Gardens | 68 | +22% | Republic |
| 33 | Santa Marta | Zuana Beach Resort | Resort & Hotel Areas | 136 | -19% | Colombia |
| 34 | Los cabos | Cabo San Lucas Marina | Transport Hubs | 56 | +115% | Mexico |
| 35 | Bertioga | Riviera de São Lourenço | Resort & Hotel Areas | 195 | +19% | Brazil |
| 36 | Acapulco | Las Brisas | Resort & Hotel Areas | 37 | +14% | Mexico |
| 37 | Balneário camboriú | Praia do Estaleirinho | Beaches & Coastlines | 32 | +7% | Brazil |
| 38 | Santo domingo | Zona Colonial | Culture & History | 150 | -7% | Republic |
| 39 | Havana | Casablanca | Neighborhood Areas | 27 | +44% | Cuba |
| 40 | Armação dos búzios | Ferradura Beach | Beaches & Coastlines | 96 | +13% | Brazil |
| 41 | Ipojuca | Nannai Resort | Resort & Hotel Areas | 333 | +24% | Brazil |
| 42 | Cali | Granada | Neighborhood Areas | 217 | +29% | Colombia |
| 43 | Aruba | Hadicurari Beach / Fisherman's Huts | Beaches & Coastlines | 75 | +92% | Aruba |
| 44 | Quito | Centro Comercial Iñaquito | Shopping & Retail | 172 | 0% | Ecuador |
| 45 | Oaxaca de juárez | Museo Rufino Tamayo | Culture & History | 287 | +32% | Mexico |
| 46 | San carlos de bariloche | Arelauquen | Resort & Hotel Areas | 34 | +29% | Argentina |
| 47 | Cusco | Cusco Historic Center | Downtown & City Centers | 200 | +49% | Peru |
| 48 | João pessoa | Letreiro João Pessoa | Landmarks & Attractions | 823 | +11% | Brazil |
| 49 | Campos do jordão | Horto Florestal / Parque Estadual Campos do Jordão | Parks & Gardens | 45 | +13% | Brazil |
| 50 | The bahamas | Atlantis Paradise Island | Resort & Hotel Areas | 42 | +143% | The Bahamas |
Conclusiones clave
- Estos 50 mercados Airbnb en Latinoamérica vienen de nuestra clasificación de mejores mercados. Cada fila incluye un hotspot principal, ordenado por ranking de mercado y no por premium. 44 hotspots tienen premium positivo y 5 están por debajo del mercado.
- La lista comienza con Sao paulo (+67%), Rio de janeiro (+56%), Buenos aires (+10%). Incluso los mercados mejor posicionados pueden tener premiums muy distintos.
- El premium más alto es Tulum Beach Clubs en Tulum (+158%).
What hotspot analysis tells you
Hotspot analysis shows where Airbnb guests pay more to stay, not just where tourists visit on a map.
Property prices and long-term rents often miss this. A neighborhood can look average on paper but still earn strong Airbnb revenue if it sits near a landmark, beach, venue, or other draw that guests mention in reviews.
That is the gap this data fills. It points to areas where acquisition may still be reasonable while short-term rental revenue runs above the market average.
In the Airbtics dashboard, each market includes its own hotspot breakdown so you can compare neighborhoods before buying or listing.
Preguntas frecuentes
See hotspot data for your market
Open any market in Airbtics to see which areas earn a location premium and compare neighborhoods side by side.
Open Airbtics Dashboard