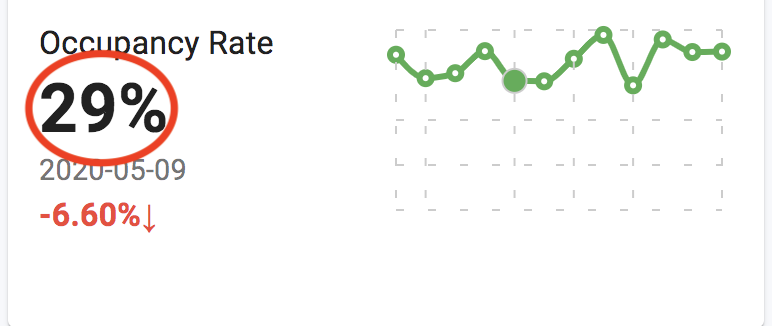
This represents an average occupancy rate of past 12 months.
Occupancy Rate = Number of booked day per year / Available days
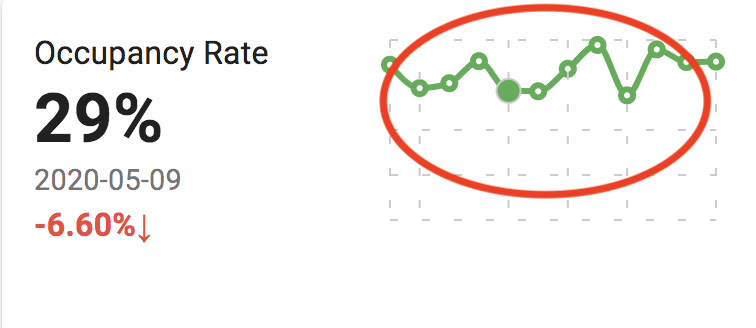
What is the Occupancy Rate graph?
This graph represents how the occupancy rate is changing throughout the whole year. It shows the past 12 months occupancy rates. Each dot represents an average monthly occupancy rate of a month.
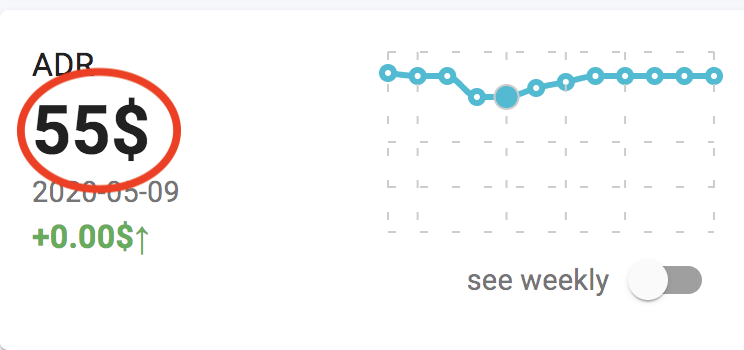
What is Yearly Average Daily Rate?
This represents a median of next 12 month ADR.
We are showing a median of ADR because we think it gives a better idea about how much a typical rental is charging on a nightly fee. A few luxury listings could skew the average of ADR.
A nightly price that guest is paying consists of 3 components. 1) Nightly fee 2) Extra fees for extra guests 3) Cleaning fee.
Our ADR doesn’t take into account of the cleaning fee. Instead, we have a separate section just showing the average cleaning fee.
ADR = Average ( nightly price + extra guest fee )
Continue to read below to learn about Seasonality of ADR.
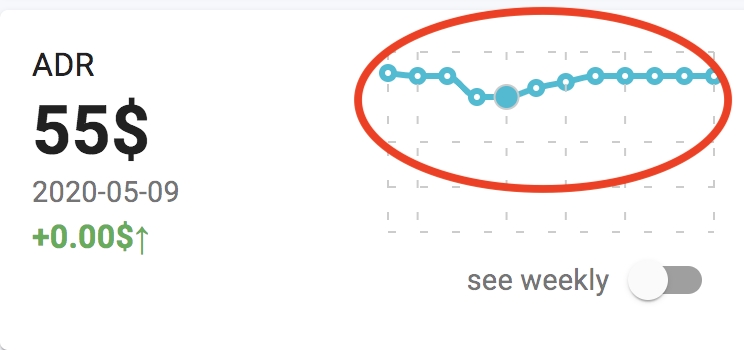
What is Seasonality of ADR?
This represents how the ADRs are priced throughout the next 12 months. Each dot represents a median of monthly ADR. For example, the first dot represents the median ADR of typical January.
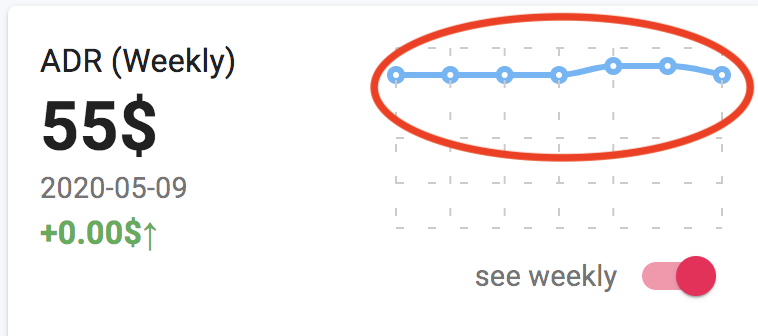
What is Weekly Seasonality of ADR?
This represents how the ADRs are priced throughout a week.
The first dot represents the ADR on Monday. For example, in the example on the left, you can see that the dots on Friday and Saturday are priced at a slightly higher rate.
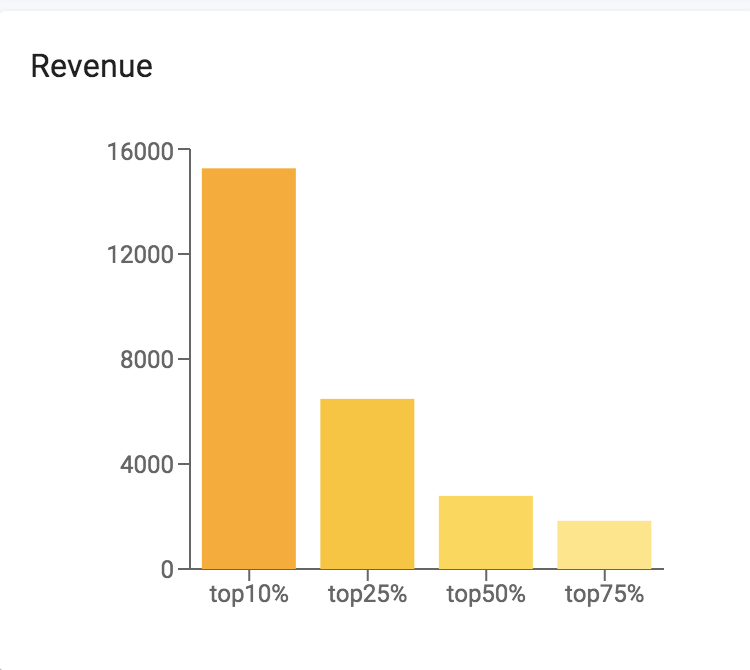
What does the Revenue Chart show?
This compares how the yearly revenues are different across different listings. The bar on top 10% show how much in average top 10% listings are generating in a year.
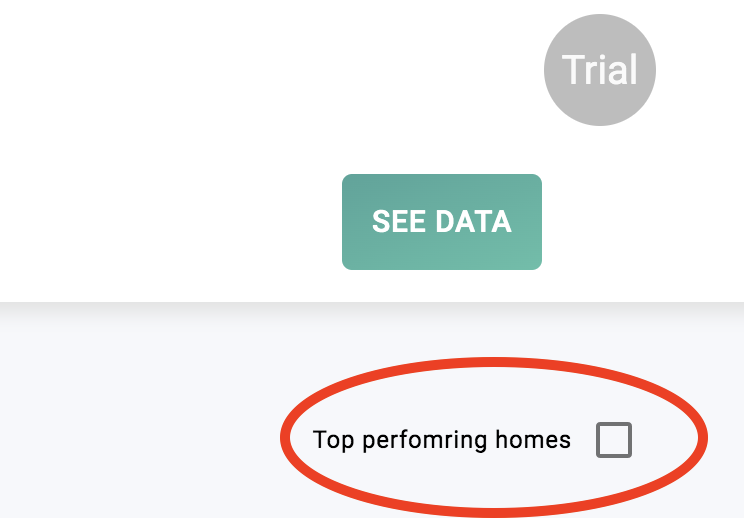
Click Top performing homes to see the top properties in the region with high demand.
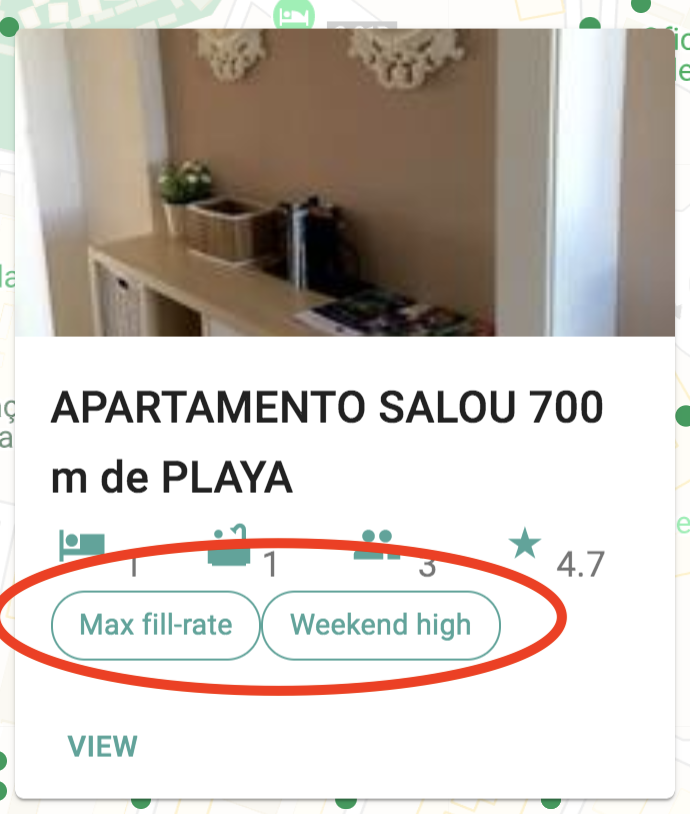
What are the Pricing Strategies?
We have so far implemented detecting three types of common pricing strategies used by rental hosts.
1) Mid-term rental – This indicates the rental is available for above two weeks at a time, and that the host is giving a significant amount of discounts for mid-term stay guests.
2) Max fill-rate – When our system detects that the host drops price at the last minute to increase the occupancy rate to the maximum level.
3) Weekend-high – This indicates that the rental is charging higher fees during the weekend.
What is the number of active listings?
An active listing is a listing that is available for rent above 320 days per year and has been active for more than 10 months.
For example, the number of active listings in 2019 is the number of active listings in 2019.
Want to see the latest vacation rental insights in your area?
 Airbtics | Airbnb Analytics