This article is written for experienced vacation rental managers who have a background an understanding of the rental market and its pricing.
There are two types of vacation rental pricing tools when it comes to price efficiency for your vacation rentals.
Dynamic pricing solution
PriceLabs, BeyondPricing, DPGO
Build your in-house pricing solution using data
SeeTransparent, Airbtics, AirDNA, Alltherooms Analytics, Key Data Dashboard
Dynamic pricing is convenient for vacation rental managers as they set the prices for you. They take care of events, supply-demand, and seasonality into account to price. Some of the providers allow you to apply customized rules too.
If you are a savvy rental manager or if you have a revenue management team, you need to have more control over the dynamic pricing algorithms. This is when you start using the in-house pricing solution. You start needing to have better control of your pricing while automatically applying seasonality, supply-demand, and events into consideration.
Here are three data-driven ways to perfect your pricing to maximize the RevPAR.
Track how competitors are pricing and adjust the price accordingly.
See the breakdown of your market by price and refine your market positioning.
Analyze the guest demands in your area and increase the daily rate by serving under-supplied needs.
Track how competitors are pricing and adjust the price accordingly with vacation rental pricing tools
AirDNA, SeeTransparent, and Airbtics are vacation rental data providers, but they also offer Airbnb Pricing Tool. All of them commonly have a calendar view of future 365 days rates and occupancy rates. This view allows you to understand the rate changes on specific events or over the seasons.
Make sure you only see the data of your competitors! If you are luxury rentals, it only makes sense to track the rating of other luxury rentals. Airbtics offers a custom calendar view that filters and shows your competitor rates only, grab a 15-minute demo!
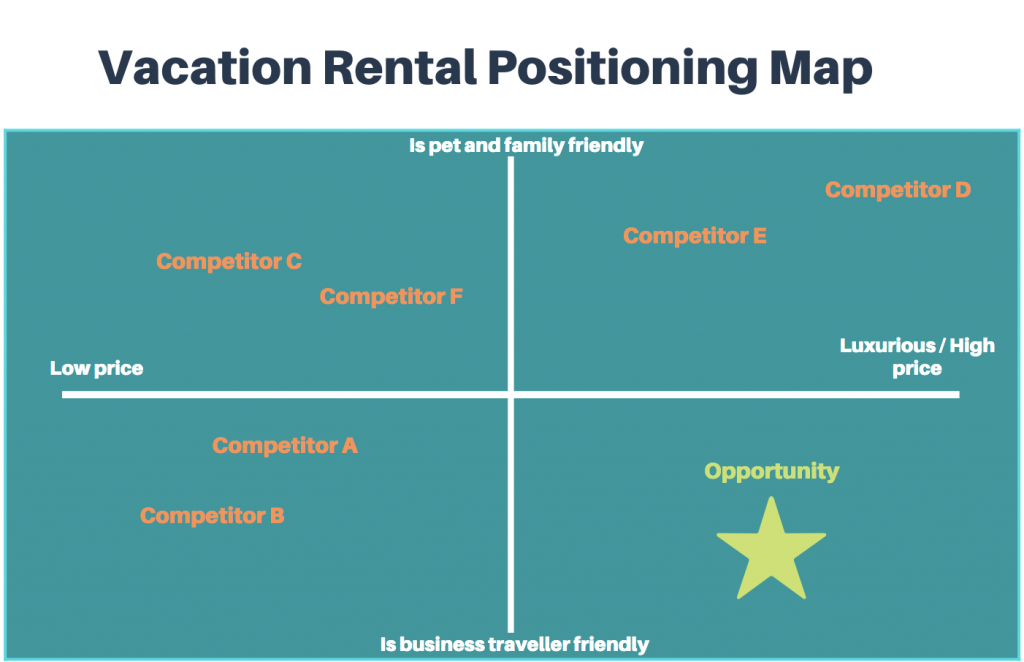
Enhance your vacation rental pricing strategy by understanding your market positioning
The objective of market positioning is to establish the image or identity of your vacation rental. By understanding this, you can advertise your vacation rental more efficiently.
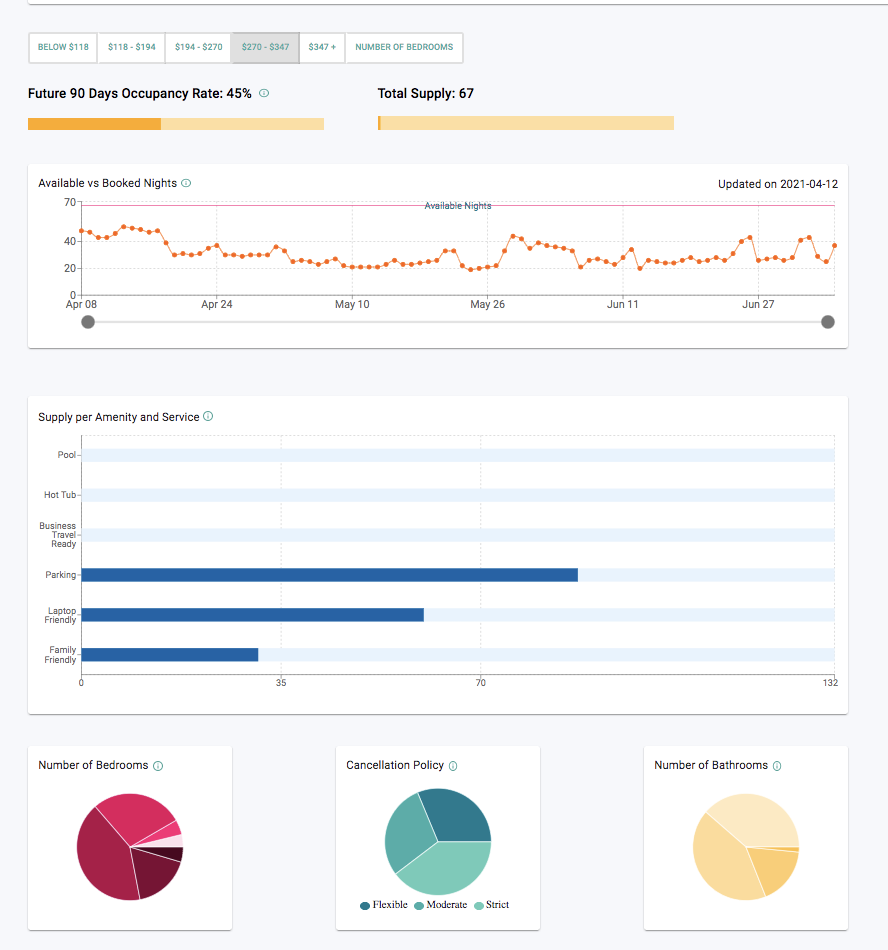
This is how a market positioning map for a vacation rental could look like. Airbtics provides market analytics per price range, which helps you to build this positioning map.
You can select your daily rate, and find out what a typical listing looks like with your pricing point. You can also go through different pricing ranges and see which pricing range your listing fit and research how you can move your pricing range.
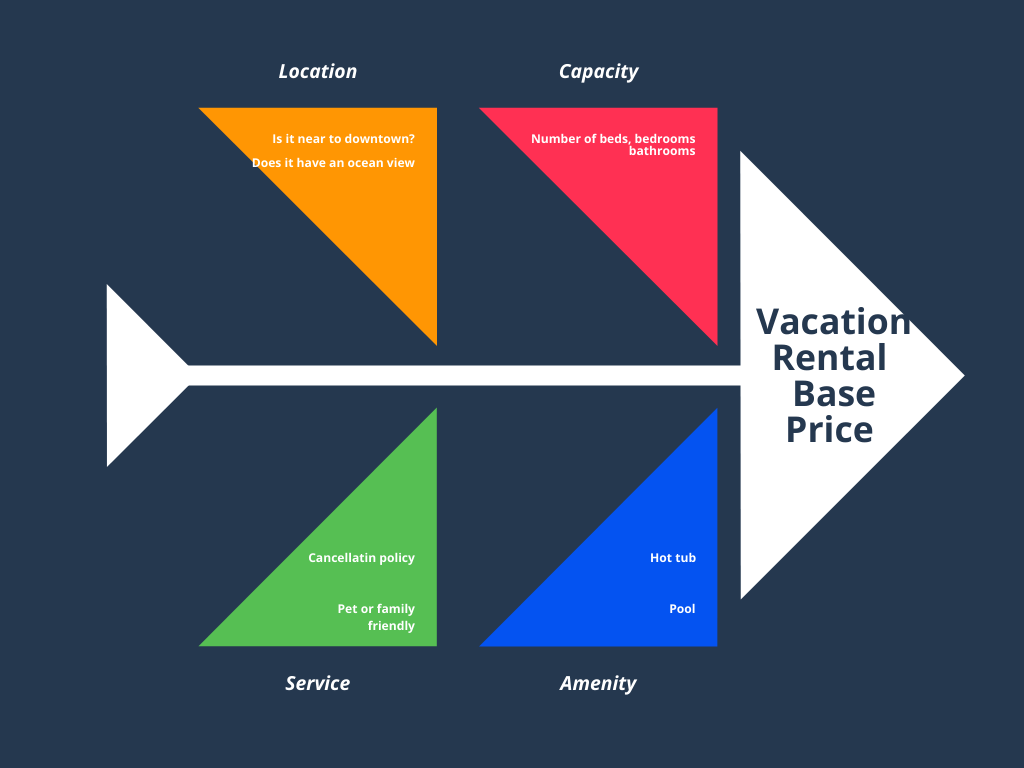
Analyze the guest demands in your area and increase the daily rate by serving under-supplied needs
Guests to your destination have different needs and those could be summed up into 4 forces –
Location
Capacity
Service
Amenity
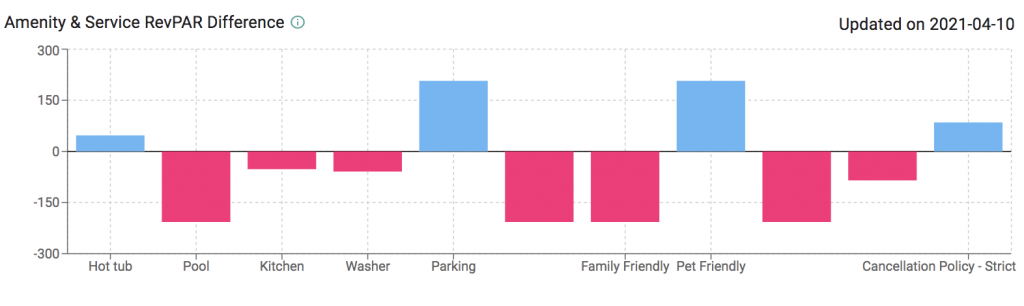
Using our research tool you can find out how the daily rate, occupancy rate, and RevPAR are being affected by those 4 demands. When there are under-supplied needs, it’ll have abruptly high.
Conclusion
The vacation rental industry has been continuously evolving and adapting to use better data to optimize their rental pricing. By going through the 3 steps I’ve mentioned above, you should have a better understanding of your pricing strategy. Nearly all of our customers had increased their RevPAR through fine-tuning their pricing using the data, and the number varies from 5 – 40%.
 Airbtics | Airbnb Analytics