The leading VRBO estimator in the short-term rental industry. Discover your VRBO rental income potential.
1
What is your goal?
Trusted by 50,000+ Short-Term Rental Businesses
Should I list my short-term rental property on
VRBO?
Airbnb is the biggest platform for booking vacation homes, but VRBO is more prevalent in some areas. Using our VRBO calculator, you can see how many VRBO and Airbnb listings are in your address. See how many VRBO listings are there in your market. This could give you insight into whether you should prioritize listing your property on VRBO. Furthermore, this VRBO calculator shows the listings’ average yearly revenue, occupancy rate, and nightly rate.
You will get more bookings by listing your property on multiple sites. But whether it’s worth the VRBO platform fee and your efforts to manage multiple channel listings depends on various factors. Estimate potential revenue from VRBO using our VRBO rental calculator.
How is VRBO profit calculator different from Airbnb calculator?
VRBO calculator shows the information you see on Airbnb calculator. On top of this, you also see VRBO listings on the map. You will see the average occupancy rate, daily rate, and revenue of listings if those VRBO listings are also on Airbnb. If they are not on Airbnb, unfortunately, you won’t be able to see their estimated revenue yet. We are going to publish this data soon.
How much can I make on
VRBO?
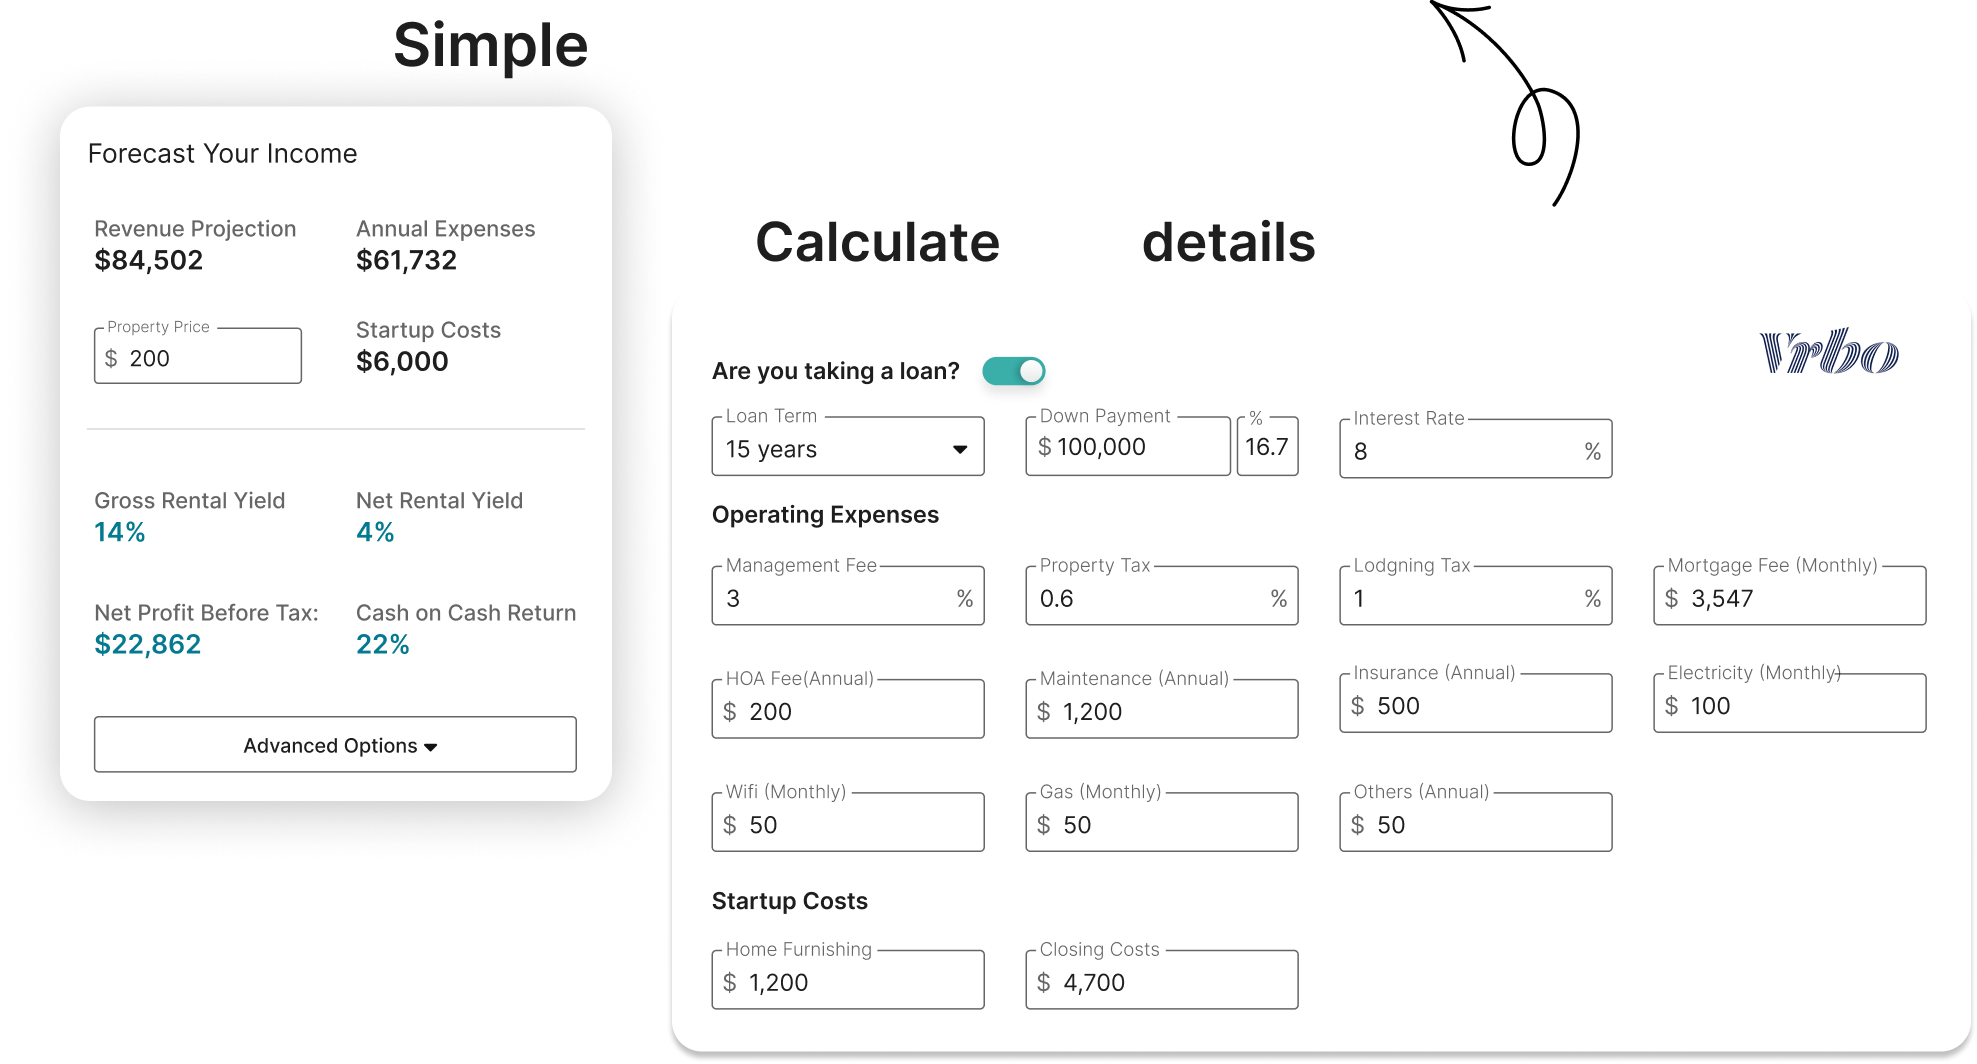
A simple way to estimate your VRBO revenue is by multiplying the year-round occupancy rate and your average daily rate of VRBO listings in your area. If they charge $150/night on average and achieve a 70% occupancy rate, it’s fair for you to assume that you will make around $150*0.70*365, which is $38,325 before expenses and taxes.
Occupancy Rate x Average Daily Rate x 365 = Your VRBO Revenue
Currently, there is a lack of good STR (short-term rental ) calculators in the market, and the ones that are available do not clearly show how they calculated the numbers. If you want to know how much can you make on VRBO, then use Airbtics’ free VRBO calculator to get a full transparent computation of your potential VRBO earnings based on 10 to 40 Airbnb comps.
We believe that making data-based decisions should be easy and accessible for you. Whether you’re an VRBO host, property manager, property investor, estate agent, or anything in between, access valuable data most relevant to you and your business.
 Airbtics | Airbnb Analytics