Airbtics | Airbnb Analytics
Precise Short-term Rental Analytics
Airbtics | Airbnb AnalyticsShort-term rental property managers and Airbnb hosts in Phoenix expected a high number of guests during this year’s Super Bowl. This highly anticipated sporting event, held last February at the State Farm Stadium, was sold out as it had always been, regardless of the host city. However, for the locals engaged in the short-term rental business, the number of bookings in their Airbnb listings was rather disappointing.
This led people to resurrect “Airbnbust” as a dreadful ghost delivering a warning that Airbnb’s glorious days are numbered. A term that gained traction on social media in late 2022, Airbnbust or Airbnb bust is a phenomenon of rising vacancies or decreasing occupancy rates in Airbnb due to the growing number of new listings. Understandably, this is a grave concern for a lot of people involved in the short-term rental industry.
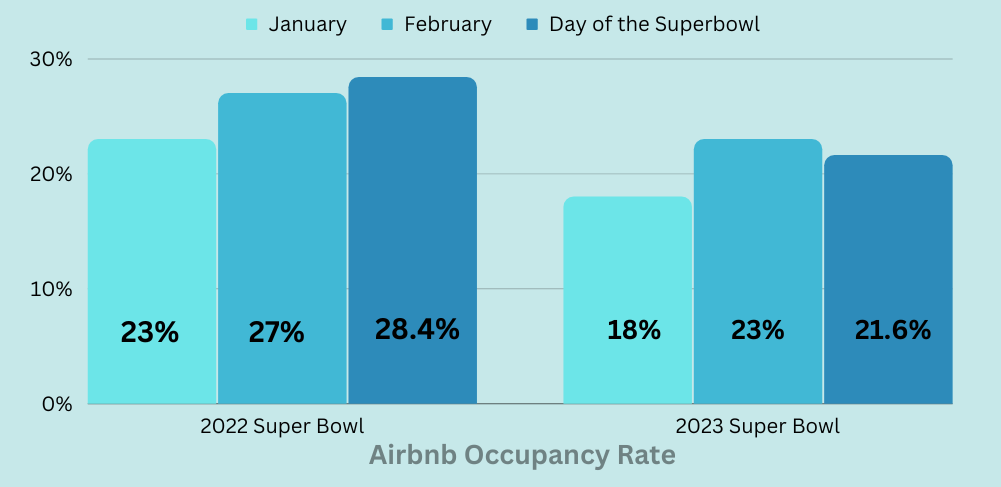
Let’s compare the two Super Bowls to put things into perspective. According to Airbtics’ Granular Data, the Airbnb average occupancy rate in Los Angeles on the day of the 2022 Super Bowl was 28.4%. This rate was 1.4% higher than the 27% average February occupancy rate in the city. The January 2022 occupancy rate in Los Angeles was 23%.
On the other hand, Phoenix had a 21.6% average occupancy rate during the 2023 Super Bowl, and the average monthly occupancy rate in February 2023 in the city was 23%. This was around 5% lower than the previous year’s occupancy rate for the Super Bowl in Los Angeles. However, we should also take note that the February average occupancy rate in Phoenix still increased by 5% from 18% in January 2023. We can clearly see that there was already a month-on-month increase during the two Super Bowls.
It is also interesting to know the booking lead time or the interval between the booking and check-in dates. The average booking lead time for last year’s event was 15 days, and 42 days for this year’s Super Bowl. This means that Airbnb guests made their bookings longer or around one and a half months in advance before the 2023 Super Bowl in Phoenix compared to last year’s Super Bowl in Los Angeles.
While the Airbnb occupancy rate for this year’s Super Bowl in Phoenix was not as high as last year’s indicator in Los Angeles, the Phoenix Airbnb monthly occupancy rate still increased by 5% in February 2023. Phoenix’s booking lead time also looked more favorable compared to Los Angeles. But if there was indeed such an increase, how come it did not make a strong impression on short-term rental managers and Airbnb hosts?
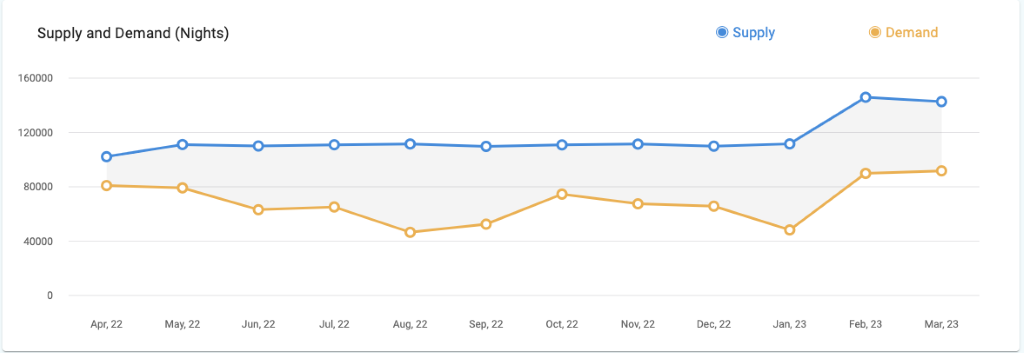
In January of this year, Phoenix had 39,470 Airbnb bookings. But during the month of the 2023 Super Bowl, the bookings made were 83,720. While it was evident that the number of bookings significantly increased, so did the number of nights available – from 71,309 to 123,891.
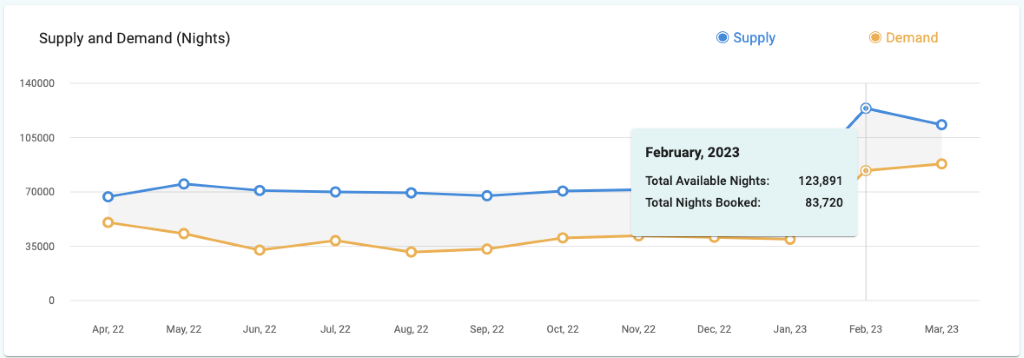
Airbnb connects hosts with guests. Hosts are the people in business to rent out their properties, while guests are the ones in need of accommodations. In the context of short-term rentals, demand represents the number of bookings made by people seeking accommodation on the platform. On the other hand, supply is the number of available nights listed by hosts.
When there is an oversupply of available short-term rental properties, hosts may face more competition that potentially forces them to lower their nightly rates. This happened in Phoenix which led a lot of Airbnb hosts and short-term rental managers in the city to lower their nightly rate to boost their Airbnb occupancy during the 2023 Super Bowl.
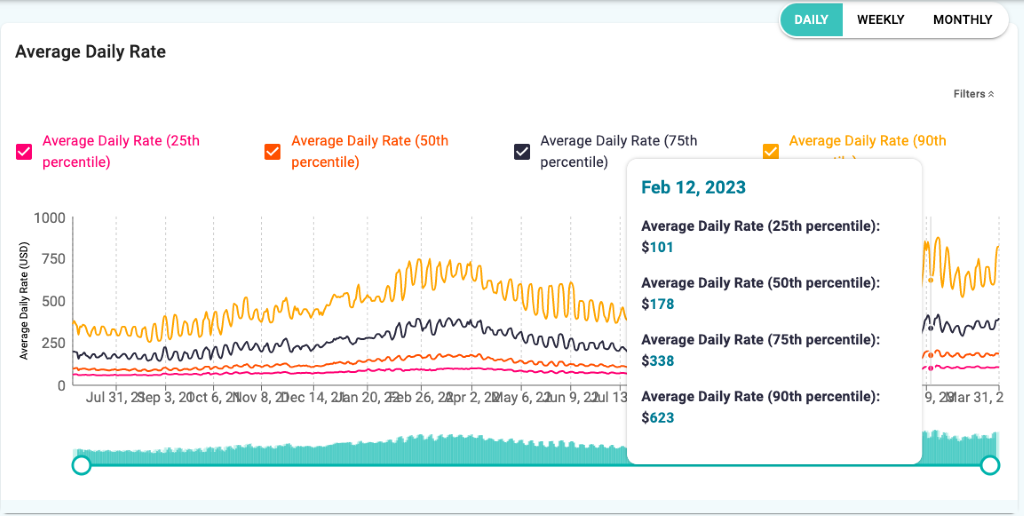
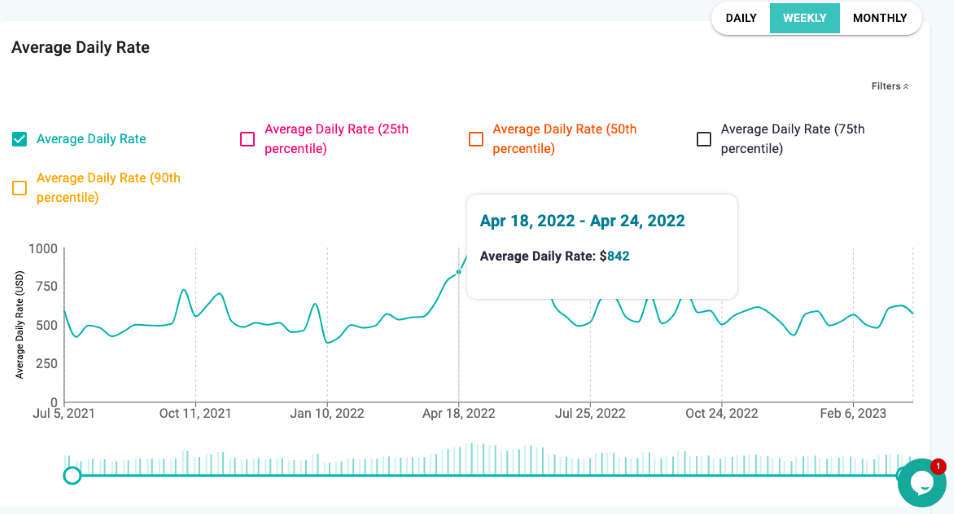
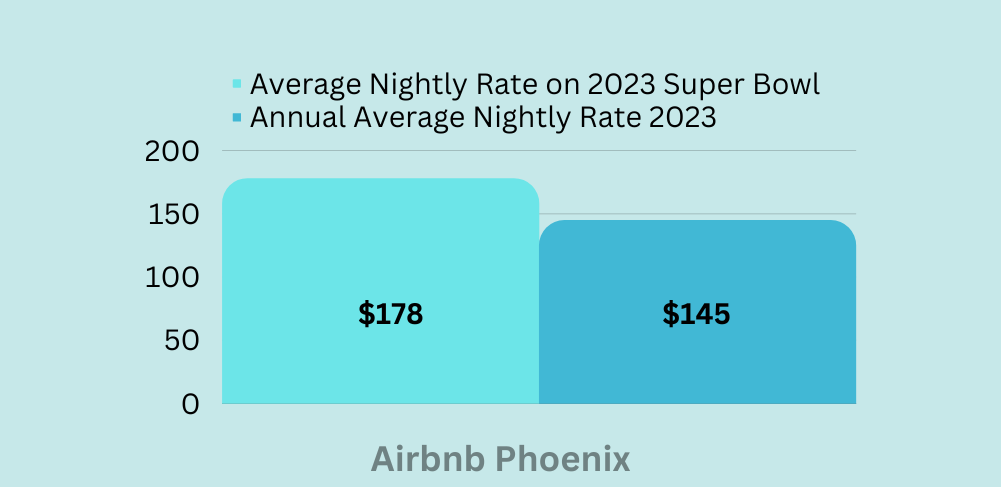
A local property manager in Phoenix even dropped the nightly rate from $1,200 to $500 for an unbooked prime 3-bedroom unit. But in my opinion, the nightly rate just fell below their expectations. Based on data from Airbtics, most hosts with booked properties were still able to gain profits and charge an average nightly rate of $178, or $33 more than the annual average nightly rate of $145. Some were even able to charge up to $623 per night. However, their concern was understandable due to the magnitude of the event which was expected to make a huge profit.
It is also worth noting that there are no restrictions on the number of Airbnb listings in Phoenix, which created an oversupply that led to an Airbnbust. There is also rental arbitrage, which allows people to profit from Airbnb without actually owning the rental property. Should we put the blame on the lenient regulations for this short-term rental bust? This is very different from the cities that have imposed strict Airbnb regulations that limit the number of listings.
In New Orleans, for example, the city put a pause on new short-term rental listing applications in October last year. Existing hosts earned an average nightly rate of $173.75 during the moratorium period. But when the city started accepting new listing applications in February, the average nightly rate rose to $211. February was also the start of the peak season in New Orleans. So more people started visiting the city when additional Airbnb units were allowed to operate. However, the city allows only 1 Airbnb listing per square block.
Demand for Airbnb accommodations is driven by travelers and visitors who prefer the flexibility, cost-effectiveness, and unique experiences offered by staying in someone’s home or property. Factors that impact demand include travel trends, tourist attractions, events, seasonality, and affordability compared to traditional hotels.
But when demand surpasses or gets closer to the supply, guests may experience limited availability and potentially higher prices due to increased competition among travelers. In Honolulu where there is a stable supply that adjusts to the changing Airbnb local demand, the average annual revenue of an Airbnb property is $56,452 from the average nightly rate of $170.
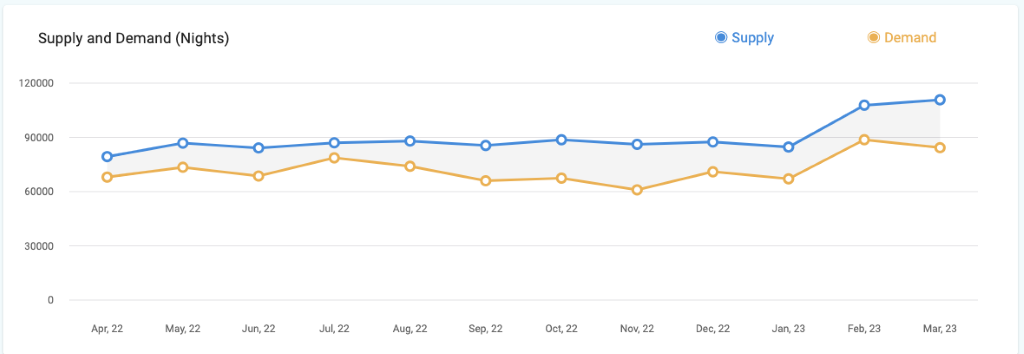
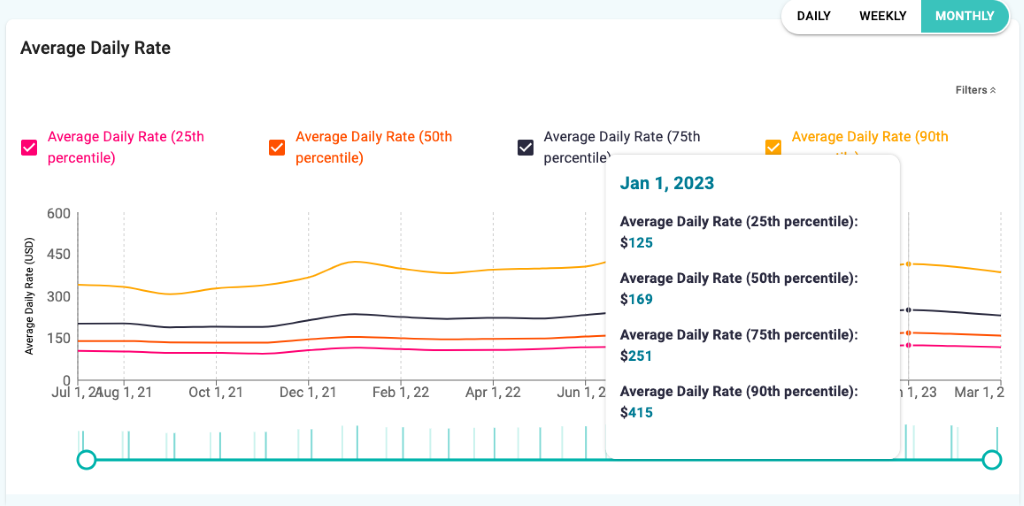
In January when the supply had stayed relatively the same since April, most Airbnb hosts were able to charge from $169 up to $415. But when the demand rose in February, the average nightly rate stayed relatively the same because supply kept up with the demand with the increase in additional nights available.
It is important to understand Airbnb demand and supply. With limited available listings, Airbnb hosts can definitely increase their nightly rate. On the other hand, an oversupply of Airbnb listings in a particular area can lead to competitive pricing. Hosts may lower their prices to attract guests and secure bookings, especially if they face competition from other hosts.
As we have learned, the short-term rental bust can be simplified into the dynamics of supply and demand. Airbnbust happens only in specific markets where there is an oversupply of listings. It does not encompass the entire short-term rental industry, which, as some fear, may result in an Airbnb collapse.
The rise of Airbnb has long disrupted the traditional hospitality sector, offering a platform that allows individuals to monetize their properties and travelers to find unique and affordable accommodations.
The demand for Airbnb listings has been driven by various factors such as saving money and increased flexibility compared to the traditional hospitality sector. On the supply side, property owners have been attracted to the opportunity to generate income and maximize the utilization of their assets, especially hosts located in markets with the highest Airbnb occupancy rates in 2022.
To navigate these evolving dynamics, hosts and property owners must stay attuned to market trends, employ effective marketing strategies, and continuously enhance the quality and uniqueness of their offerings. Leveraging data analytics and technology can help optimize pricing, improve guest satisfaction, and ensure a steady stream of bookings.
The future of the Airbnb industry will also be shaped by regulatory developments and the company’s response to stakeholder concerns. Collaboration between Airbnb, hosts, and local authorities is essential to strike a balance that allows for responsible growth and ensures a positive impact on local communities. Should we allow more Airbnb listings per city, or should we put a limit on them? This is still an ongoing discussion that requires all concerned parties to participate.
Overall, the demand and supply forces within the Airbnb industry are ever-evolving, requiring stakeholders to be adaptable, innovative, and responsive to changing market conditions – just like the threat of an Airbnbust. By understanding and effectively managing these dynamics, hosts and guests alike can continue to benefit from the opportunities provided by the Airbnb platform.