What is LTM in Airbnb data? Learn from this article what it means and how you can leverage it for your Airbnb success!
- Last updated January 10, 2024
The dynamic Airbnb marketplace demands staying ahead of the curve. This goes beyond having a knack for hospitality. It demands a keen understanding of data analytics. This article delves into the pivotal role of LTM or “last twelve months” data in your Airbnb investment success.
What is LTM?
LTM, or Last Twelve Months Data, refers to financial or performance data that covers the past 12-month period. This isn’t exclusive to short-term rentals. In fact, it is commonly used in business to provide a snapshot of a company’s performance over the past year.
For Airbnb investors, the Last Twelve Months (LTM) data serves as the financial compass guiding investment decisions in the short-term rental industry. It’s your lens to scrutinize the performance of Airbnb markets over the past year. This crucial tool allows you to brace yourself for the twists and turns of this sharing economy.
Where Can I Get The LTM Data of my Airbnb Market?
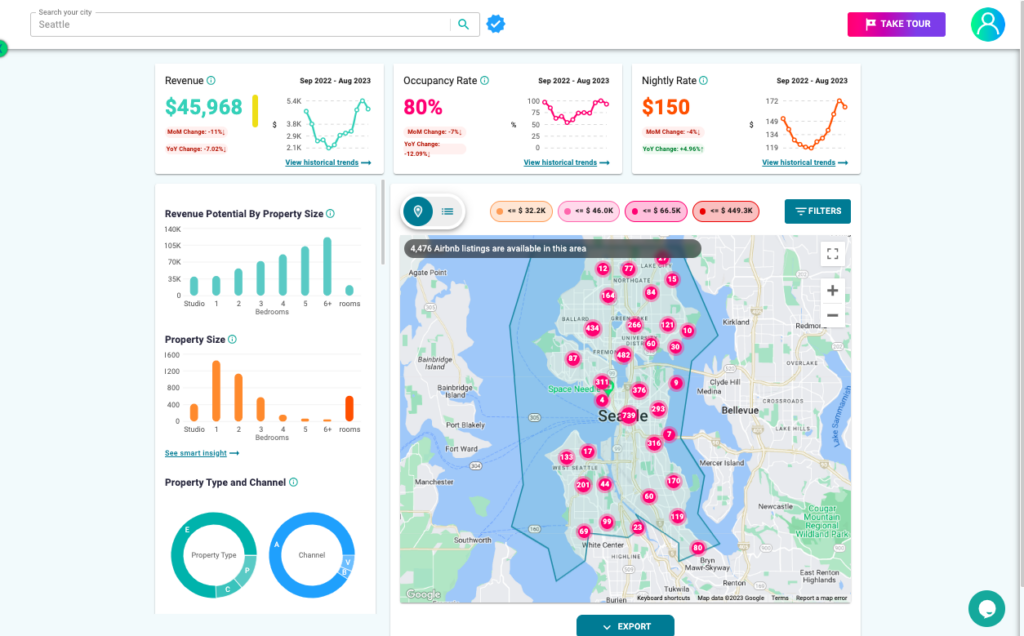
Type in your Airbnb market in the Airbtics Dashboard, and you will instantly see the LTM data of Revenue, Occupancy Rate, and Nightly Rate, along with other Airbnb metrics!
Source: Airbtics App
For a more comprehensive analysis, hover over the graphs to see the values!
The Uses of LTM in Short-Term Rental
The “Last Twelve Months” is a quantitative metric that holds immense value for investors, hosts, and property managers. By examining data from the past year, stakeholders can make informed decisions and implement strategic actions:
1. Understanding Seasonal Trends
Analyzing LTM Airbnb data offers a significant advantage in gaining a comprehensive grasp of seasonal patterns. This knowledge empowers hosts and property managers to make well-informed pricing decisions: lower the nightly rates when demand is low.
This is especially advantageous for Airbnb investors seeking to establish a more stable income stream by diversifying their investment portfolio. For instance, if their existing rental properties generate limited income during the third quarter of the year, they have the option to explore Airbnb markets that experience peak seasons during this period.
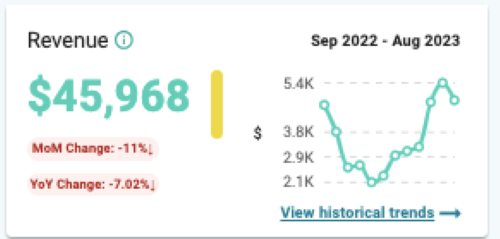
For example, the Seattle Airbnb market’s average monthly revenue started to increase in March and has continued to have a steady rise since.
This strategic diversification can help them balance and enhance their overall revenue flow.
For property investors and managers, the analysis of LTM data plays a pivotal role in budget allocation and resource planning. It provides insights into the expenses incurred over the preceding year, facilitating more accurate financial forecasting. Armed with this information, investors can strategically allocate funds for purposes such as property maintenance, marketing initiatives, or expansion efforts.
2. Competitive Benchmarking
Airbnb is a cutthroat industry. This is why hosts and property managers need to keep an eye on the competition. Analyzing LTM data allows you to compare your property’s performance to similar listings in your area.
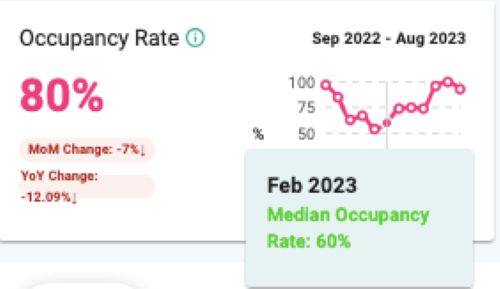
Seasonal fluctuations are expected in the hospitality industry, but has your rental fared well in the past 12 months in this regard? If you’re a host in Seattle, have you enjoyed at least a 60% Airbnb occupancy rate since March?
This benchmarking can help you identify the strengths and weaknesses of your Airbnb rental. Oftentimes, weaknesses can be addressed by pricing your property right!
3. Strategic Pricing
Airbnb is a dynamic platform that continually welcomes new listings. It’s essential to keep an eye on the average nightly rate to remain competitive. If you observe that similar listings consistently offer lower prices, you can fine-tune your pricing approach.
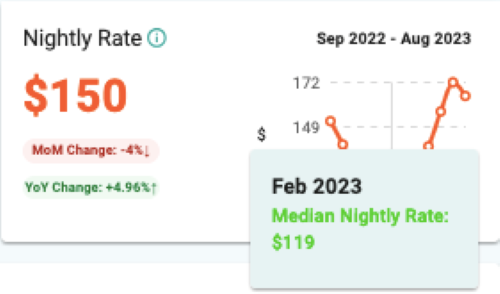
For example, the nightly rate in Seattle is $150. This is the average in the last twelve months. However, hosts set the nightly rate at $119 in February. If you kept a $150 rate around this time, that might be the reason behind not hitting at least 60% occupancy during that month.
You can uncover pricing trends by delving into the LTM data. For instance, you may notice that specific seasons or regular local events increase the demand, which results in a higher nightly rate.
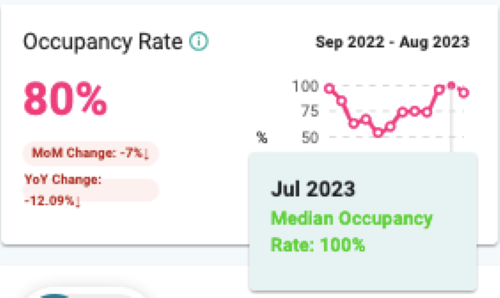
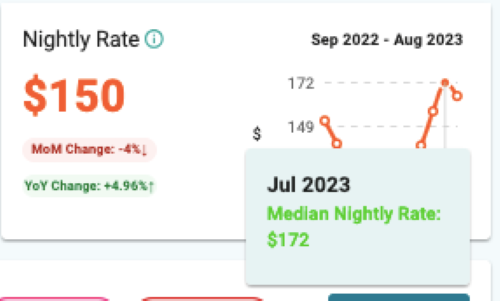
Adjusting your pricing strategy enables you to maximize your earnings during peak seasons. In Seattle, the market had a 100% median occupancy rate. This allowed hosts to earn around $172 nightly.
Striking the perfect balance between price and occupancy is crucial. Overpricing may lead to fewer bookings and more vacant nights. On the other hand, underpricing might attract bookings but limit your income potential. Regularly monitoring the average nightly rate allows you to pinpoint the optimal pricing strategy.
Harness the Power of LTM Data with Airbtics
In the fast-paced world of Airbnb investments, success hinges on data-driven decisions. Last Twelve Months Data is your compass, guiding you through the ups and downs of the short-term rental market.
To harness its power, look no further than Airbtics. As you have seen, it’s so easy to use, allowing you to instantly gain insights into seasonal trends, competitive benchmarks, and strategic pricing. Elevate your game today and stay ahead of the curve!
Eyeing a rental property and wanna know its profit potential? The answer lies in
the most powerful Airbnb Calculator!
Short-Term Rental Data
Short-Term Rental Data
-
Quick Links
Airbnb Promotion: Effective Ways to Get More Airbnb Bookings
Starting an Airbnb business is certainly exciting when you have an overview of your property’s potential revenue and are more than ready to welcome guests. …
Annual Airbnb Revenue in Tehachapi california, USA
Tehachapi, California| Airbnb Market Data & Overview | USA Tehachapi, California Airbnb Market Data & Overview USA Is it profitable to do Airbnb in Tehachapi, …
Top Property Management Companies San diego united states
Top 15 Property Managers in San diego, United states Top 15 Property Managers in San diego, United states Last updated on: 5th July, 2024 This …
Ingresos anuales de Airbnb en taxco-méxico
Taxco| Ingresos Airbnb y Rentabilidad Airbnb | México Taxco Ingresos Airbnb y Rentabilidad AirbnbMéxico ¿Es rentable hacer Airbnb en Taxco? ¿Cuál es la tasa de …
Vacation Rentals Greece: Top markets for investment
Vacation Rentals Greece – Top markets for investment: Explore the allure of Greece as a prime destination for vacation rentals and fulfill your dream of …
Annual Airbnb Revenue in Easton washington, USA
Easton, Washington| Airbnb Market Data & Overview | USA Easton, Washington Airbnb Market Data & Overview USA Is it profitable to do Airbnb in Easton, …


