 Airbtics | Airbnb Analytics
Precise Short-term Rental Analytics
Airbtics | Airbnb AnalyticsAirbnb Data: Occupancy Rates by Zipcode: Looking to get FREE and accurate Airbnb data in 2023? Check this blog and follow the 3 easy steps to get Airbnb data by zipcode!
Home > Resources > Airbnb Occupancy >

Looking to get FREE and accurate Airbnb data in 2024? Check this blog and follow the 3 easy steps to get Airbnb data by zipcode!
[elementor-template id=”61228″]
Airbnb occupancy rate is one of the important metrics to gauge a property’s success. This refers to the number of days that a property is booked by guests in a particular calendar year.
If you’re looking for ways to find the best Airbnb occupancy rate by zipcode, we have it here!
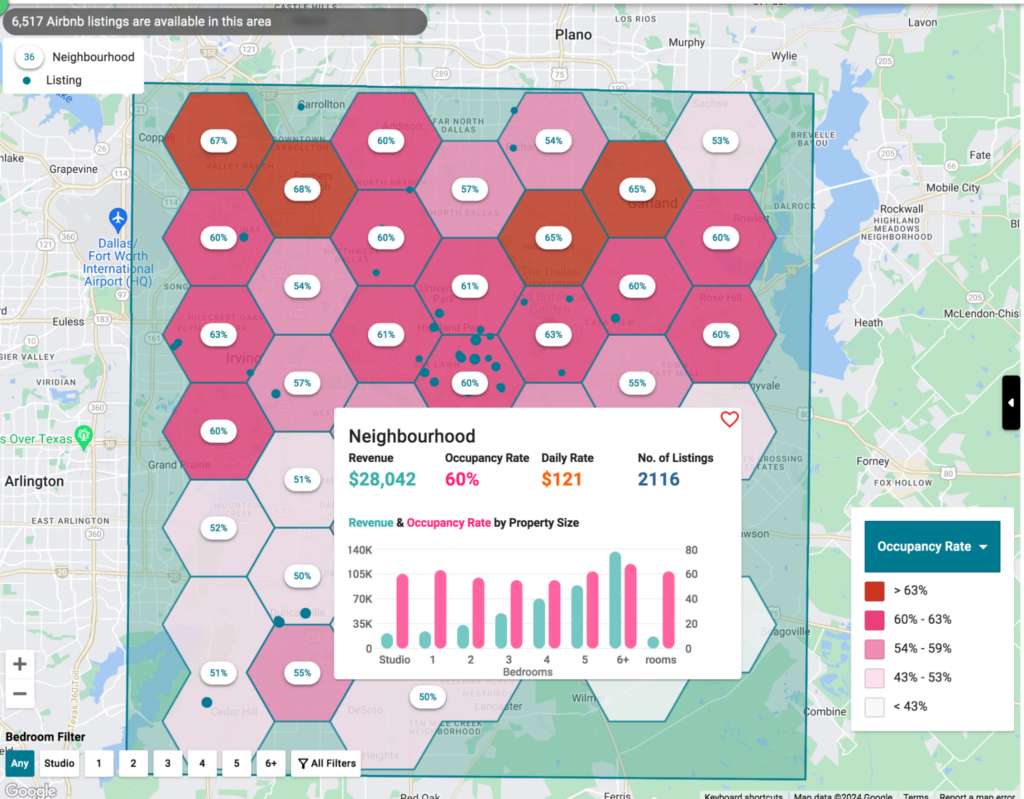
1) If you are looking to find a zipcode of your specific area, you can get that data by free from our Airbnb Analyzer app 🙂
2) Check out the largest 100 Airbnb cities in the US in a table view here.
3) In this article, we featured 5 states in the USA and ranked the cities with the highest and lowest occupancy rates based on accurate numbers. Continue reading to learn more!
One of the most important performance indicators of an Airbnb property is the occupancy rate. Average Airbnb Occupancy rate vary from one place to another and are constantly changing.
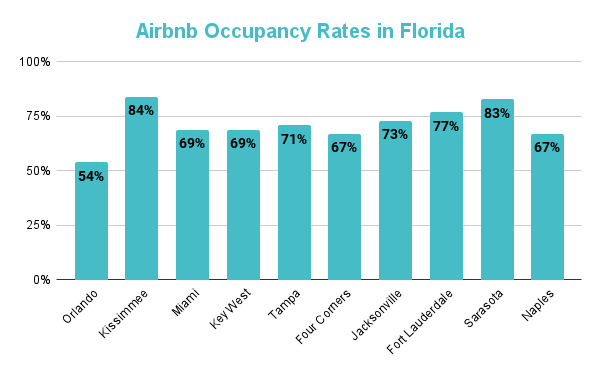
These figures are important to properly understand which markets are best for investment. According to Airbtics, the city with the highest occupancy rates in Florida is Kissimmee. With a solid 84%, you can distinguish that this city receives the most bookings.
However, you should also consider other Airbnb Statistics such as occupancy rates, average daily rate, seasonality, property types, and amenities among others.
If you’re looking for Airbnb data by zipcode, Airbtics has this service! Check out and download the sample Airbnb data by city here. It can also be extracted in a zip code level:
Here are the highest and lowest Airbnb data by zipcodes in Florida, California, Texas, Arizona, and New York:
Florida’s sunny weather and fascinating coastlines have definitely attracted returning tourists from across the globe. Here are the top 10 cities in Florida ranked from the highest and lowest occupancy rates with zipcodes:
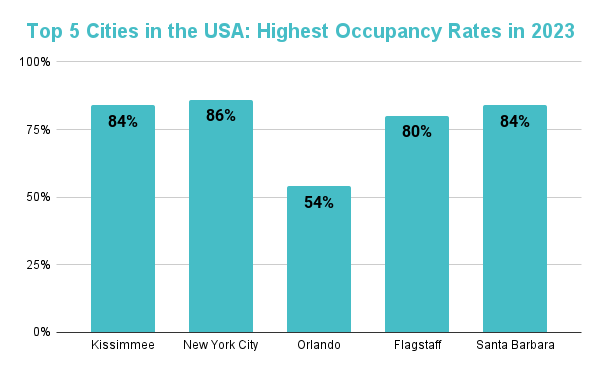
Kissimmee (34741 – 34759)
Airbnb Occupancy Rate: 84%
Average Daily Rate: $98
Annual Revenue: $35,464
Peak Season: March
Sarasota (34231 – 34249)
Airbnb Occupancy Rate: 83%
Average Daily Rate: $187
Annual Revenue: $65,481
Peak Season: March
Fort Lauderdale (33301 – 33394)
Airbnb Occupancy Rate: 73%
Average Daily Rate: $174
Annual Revenue: $49,713
Peak Season: March
Jacksonville (32202 – 32277)
Airbnb Occupancy Rate: 73%
Average Daily Rate: $174
Annual Revenue: $49,713
Peak Season: March
Tampa (33602 – 33664)
Airbnb Occupancy Rate: 71%
Average Daily Rate: $143
Annual Revenue: $40,872
Peak Season: February
Miami (33101 – 33206)
Airbnb Occupancy Rate: 69%
Average Daily Rate: $180
Annual Revenue: $46,314
Peak Season: March
Key West (33040 – 33045)
Airbnb Occupancy Rate: 69%
Average Daily Rate: $419
Annual Revenue: $112,721
Peak Season: March
Naples (34102 – 34120)
Airbnb Occupancy Rate: 67%
Average Daily Rate: $255
Annual Revenue: $70,844
Peak Season: March
Four Corners (33896 – 34787)
Airbnb Occupancy Rate: 67%
Average Daily Rate: $136
Annual Revenue: $36,529
Peak Season: July
Orlando (32801 – 32899)
Airbnb Occupancy Rate: 54%
Average Daily Rate: $115
Annual Revenue: $27,828
Peak Season: February
Popular as the home of actors in Hollywood, California has a large economy with several beaches and tourist destinations such as Disneyland. Here are the top 10 cities in California ranked from the highest and lowest occupancy rates with zipcodes:
Santa Barbara (93101 – 93190)
Airbnb Occupancy Rate: 84%
Average Daily Rate: $269
Annual Revenue: $91,062
Peak Season: July
Yosemite (95389)
Airbnb Occupancy Rate: 84%
Average Daily Rate: $239
Annual Revenue: $77,168
Peak Season: July
Sacramento (94203 – 94299)
Airbnb Occupancy Rate: 62%
Average Daily Rate: $125
Annual Revenue: $30,286
Peak Season: July
San Jose (95103 – 95196)
Airbnb Occupancy Rate: 61%
Average Daily Rate: $125
Annual Revenue: $30,286
Peak Season: July
Long Beach (90745 – 90899)
Airbnb Occupancy Rate: 79%
Average Daily Rate: $159
Annual Revenue: $49,431
Peak Season: July
Palm Springs (92258 – 92292)
Airbnb Occupancy Rate: 59%
Average Daily Rate: $413
Annual Revenue: $85,254
Peak Season: March
Los Angeles (90001 – 90189)
Airbnb Occupancy Rate: 76%
Average Daily Rate: $148
Annual Revenue: $41,749
Peak Season: July
San Francisco (94101 – 94188)
Airbnb Occupancy Rate: 80%
Average Daily Rate: $144
Annual Revenue: $44,190
Peak Season: July
Fresno (93701 – 92199)
Airbnb Occupancy Rate: 30%
Average Daily Rate: $139
Annual Revenue: $21,318
Peak Season: January
San Diego (92101 – 34120)
Airbnb Occupancy Rate: 75%
Average Daily Rate: $238
Annual Revenue: $65,904
Peak Season: July
Known as the second largest state in America, Texas is popular for its live music, hot temperature, and distinct culture. Here are the top 10 cities in Texas ranked from the highest and lowest occupancy rates:
Irving (75014 – 75064)
Airbnb Occupancy Rate: 74%
Average Daily Rate: $92
Annual Revenue: $28,526
Peak Season: July
Austin (78701 – 78799)
Airbnb Occupancy Rate: 72%
Average Daily Rate: $176
Annual Revenue: $46,767
Peak Season: March
Frisco (75033 – 75036)
Airbnb Occupancy Rate: 71%
Average Daily Rate: $140
Annual Revenue: $34,267
Peak Season: September
Fort Worth (76101 – 76199)
Airbnb Occupancy Rate: 66%
Average Daily Rate: $124
Annual Revenue: $31,585
Peak Season: August
Plano (75023 – 75093)
Airbnb Occupancy Rate: 62%
Average Daily Rate: $171
Annual Revenue: $36,500
Peak Season: July
Dallas (75201 – 75398)
Airbnb Occupancy Rate: 61%
Average Daily Rate: $127
Annual Revenue: $30,380
Peak Season: July
San Antonio (78201 – 78299)
Airbnb Occupancy Rate: 59%
Average Daily Rate: $134
Annual Revenue: $30,784
Peak Season: July
El Paso (799901 – 88595)
Airbnb Occupancy Rate: 56%
Average Daily Rate: $89
Annual Revenue: $19,219
Peak Season: July
Corpus Christi (78401 – 78480)
Airbnb Occupancy Rate: 48%
Average Daily Rate: $180
Annual Revenue: $36,166
Peak Season: July
Houston (77003 – 77299)
Airbnb Occupancy Rate: 47%
Average Daily Rate: $113
Annual Revenue: $21,704
Peak Season: March
Arizona is mostly known for its iconic landmark, the Grand Canyon, and its rich history. Here are the top 10 cities in Arizona ranked from the highest and lowest occupancy rates:
Flagstaff (86001 – 86011)
Airbnb Occupancy Rate: 80%
Average Daily Rate: $164
Annual Revenue: $51,232
Peak Season: March
Chandler (85224 – 85249)
Airbnb Occupancy Rate: 73%
Average Daily Rate: $120
Annual Revenue: $40,265
Peak Season: March
Gilbert (75033 – 75036)
Airbnb Occupancy Rate: 72%
Average Daily Rate: $123
Annual Revenue: $39,401
Peak Season: March
Yuma (85364 – 85369)
Airbnb Occupancy Rate: 71%
Average Daily Rate: $156
Annual Revenue: $39,631
Peak Season: July
Tempe (85280 – 85289)
Airbnb Occupancy Rate: 70%
Average Daily Rate: $125
Annual Revenue: $37,742
Peak Season: March
Scottsdale (85250 – 85266)
Airbnb Occupancy Rate: 69%
Average Daily Rate: $142
Annual Revenue: $44,880
Peak Season: March
Tucson (85701 – 85777)
Airbnb Occupancy Rate: 68%
Average Daily Rate: $98
Annual Revenue: $28,783
Peak Season: February
Phoenix (85001 – 85099)
Airbnb Occupancy Rate: 67%
Average Daily Rate: $123
Annual Revenue: $36,560
Peak Season: March
Glendale (85301 – 85318)
Airbnb Occupancy Rate: 59%
Average Daily Rate: $210
Annual Revenue: $60,513
Peak Season: July
Sedona (86336 – 86351)
Airbnb Occupancy Rate: 53%
Average Daily Rate: $170
Annual Revenue: $36,209
Peak Season: March
New York is mostly known for some of its popular tourist destinations such as Times Square, The Statue of Liberty, and Central Park among others. Here are the top 10 cities in New York ranked from the highest and lowest occupancy rates:
New York City (10259)
Airbnb Occupancy Rate: 86%
Average Daily Rate: $170
Annual Revenue: $52,910
Peak Season: July
Brooklyn (11201 – 11256)
Airbnb Occupancy Rate: 85%
Average Daily Rate: $133
Annual Revenue: $40,646
Peak Season: July
Buffalo (14201 – 14280)
Airbnb Occupancy Rate: 72%
Average Daily Rate: $120
Annual Revenue: $32,773
Peak Season: July
Rochester (14602 – 14694)
Airbnb Occupancy Rate: 68%
Average Daily Rate: $126
Annual Revenue: $32,789
Peak Season: July
Yonkers (10701 – 10710)
Airbnb Occupancy Rate: 66%
Average Daily Rate: $99
Annual Revenue: $22,018
Peak Season: July
New Rochelle (10801 – 10805)
Airbnb Occupancy Rate: 66%
Average Daily Rate: $141
Annual Revenue: $30,280
Peak Season: July
Syracuse (13201 – 13290)
Airbnb Occupancy Rate: 62%
Average Daily Rate: $151
Annual Revenue: $31,868
Peak Season: August
Albany (85701 – 85777)
Airbnb Occupancy Rate: 73%
Average Daily Rate: $174
Annual Revenue: $49,713
Peak Season: March
Cheektowaga (14043 – 14215)
Airbnb Occupancy Rate: 83%
Average Daily Rate: $187
Annual Revenue: $65,481
Peak Season: March
Middletown(10940 – 10943)
Airbnb Occupancy Rate: 67%
Average Daily Rate: $255
Annual Revenue: $70,844
Peak Season: March
There are ready-made solutions by analytics company where you can just purchase a CSV file of US airbnb data by zipocde.
If you want something free, you can sign up and use Airbnb analytics to get occupancy rate data of a specific zipcode.
If a market has above 70% average occupancy rate, you can consider that market to be attractive place to start an Airbnb, at least, as of now.
Airbnb investment in any city can be risky if market research is not done as the first step.
[elementor-template id=”61999″]
[elementor-template id=”61124″]