fbpx
Categories
Airbnb Occupancy All About Airbnb

Airbnb Data: Occupancy Rates by Zipcode

Airbnb Data: Occupancy Rates by Zipcode: Looking to get FREE and accurate Airbnb data in 2023? Check this blog and follow the 3 easy steps to get Airbnb data by zipcode!

Airbnb Data: Occupancy Rates by Zipcode

Airbnb data by zipcode

Airbnb Data: Occupancy Rates by Zipcode

Looking to get FREE and accurate Airbnb data in 2024? Check this blog and follow the 3 easy steps to get Airbnb data by zipcode!

Airbnb occupancy rate is one of the important metrics to gauge a property’s success. This refers to the number of days that a property is booked by guests in a particular calendar year.

If you’re looking for ways to find the best Airbnb occupancy rate by zipcode, we have it here! 

1) If you are looking to find a zipcode of your specific area, you can get that data by free from our Airbnb Analyzer app 🙂  

2) In this article, we featured 5 states in the USA and ranked the cities with the highest and lowest occupancy rates based on accurate numbers. Continue reading to learn more!

What is Airbnb Occupancy Rate?

One of the most important performance indicators of an Airbnb property is the occupancy rate. Average Airbnb Occupancy rate vary from one place to another and are constantly changing. 

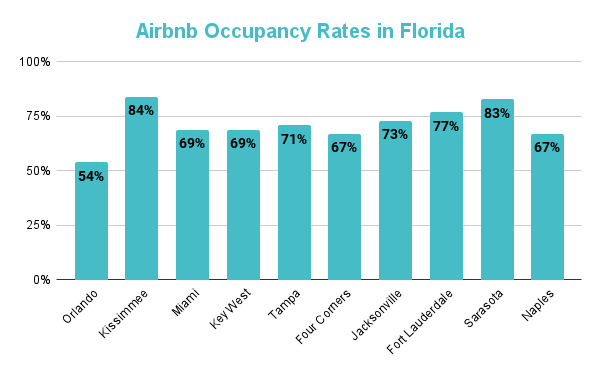
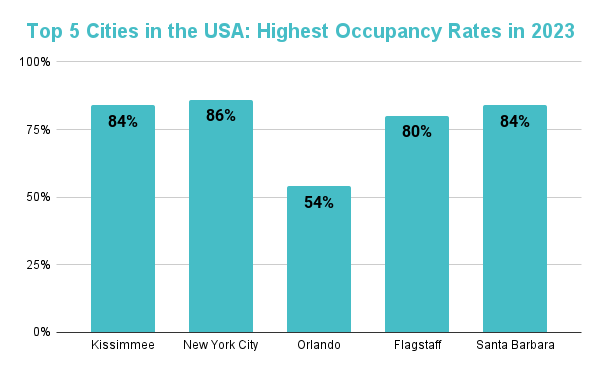
These figures are important to properly understand which markets are best for investment. According to Airbtics, the city with the highest occupancy rates in Florida is Kissimmee. With a solid 84%, you can distinguish that this city receives the most bookings. 

However, you should also consider other Airbnb Statistics such as occupancy rates, average daily rate, seasonality, property types, and amenities among others.

If you’re looking for Airbnb data by zipcode, Airbtics has this service! Check out and download the sample Airbnb data by city here. It can also be extracted in a zip code level:

Airbnb Occupancy Rates by Zipcode

Here are the highest and lowest Airbnb data by zipcodes in Florida, California, Texas, Arizona, and New York:
Airbnb data by zipcode
1. FLORIDA

Florida’s sunny weather and fascinating coastlines have definitely attracted returning tourists from across the globe. Here are the top 10 cities in Florida ranked from the highest and lowest occupancy rates with zipcodes:

airbtics-logo-300x87
City in Florida Occupancy Rate Zip codes
1. Kissimmee 84% 34741 - 34759
2. Sarasota 83% 34231 - 34249
3. Fort Lauderdale 77% 33301 - 33394
4. Jacksonville 73% 32202 - 32277
5. Tampa 71% 33602 - 33664
6. Miami 69% 33101 - 33206
7. Key West 69% 33040 - 33045
8. Naples 67% 34102 - 34120
9. Four Corners 67% 33896 - 34787
10. Orlando 54% 32801 - 32899
  • Kissimmee (34741 – 34759)
    Airbnb Occupancy Rate: 84%
    Average Daily Rate: $98
    Annual Revenue: $35,464
    Peak Season: March

  • Sarasota (34231 – 34249)
    Airbnb Occupancy Rate: 83% 
    Average Daily Rate: $187
    Annual Revenue: $65,481
    Peak Season: March

  • Fort Lauderdale (33301 – 33394)
    Airbnb Occupancy Rate: 73% 
    Average Daily Rate: $174
    Annual Revenue: $49,713
    Peak Season: March

  • Jacksonville (32202 – 32277)
    Airbnb Occupancy Rate: 73% 
    Average Daily Rate: $174
    Annual Revenue: $49,713
    Peak Season: March

  • Tampa (33602 – 33664)
    Airbnb Occupancy Rate: 71% 
    Average Daily Rate: $143
    Annual Revenue: $40,872
    Peak Season: February

  • Miami (33101 – 33206)
    Airbnb Occupancy Rate: 69% 
    Average Daily Rate: $180
    Annual Revenue: $46,314
    Peak Season: March

  • Key West (33040 – 33045)
    Airbnb Occupancy Rate: 69% 
    Average Daily Rate: $419
    Annual Revenue: $112,721
    Peak Season: March

  • Naples (34102 – 34120)
    Airbnb Occupancy Rate: 67% 
    Average Daily Rate: $255
    Annual Revenue: $70,844
    Peak Season: March

  • Four Corners (33896 – 34787)
    Airbnb Occupancy Rate: 67% 
    Average Daily Rate: $136
    Annual Revenue: $36,529
    Peak Season: July

  • Orlando (32801 – 32899)
    Airbnb Occupancy Rate: 54% 
    Average Daily Rate: $115
    Annual Revenue: $27,828
    Peak Season: February

2. CALIFORNIA

Popular as the home of actors in Hollywood, California has a large economy with several beaches and tourist destinations such as Disneyland. Here are the top 10 cities in California ranked from the highest and lowest occupancy rates with zipcodes:

airbtics-logo-300x87
City in California Occupancy Rate Zip codes
1. Santa Barbara 84% 93101 - 93190
2. Yosemite 84% 95389
3. San Francisco 80% 33301 - 33394
4. Long Beach 79% 90745 - 90899
5. Los Angeles 76% 94101 - 94188
6. San Diego 75% 34102 - 34120
7. Sacramento 62% 94203 - 94299
8. San Jose 61% 95103 - 95196
9. Palm Springs 59% 92258 - 92292
10. Fresno 30% 34231 - 34249
  • Santa Barbara (93101 – 93190)
    Airbnb Occupancy Rate: 84%
    Average Daily Rate: $269
    Annual Revenue: $91,062
    Peak Season: July

  • Yosemite (95389)
    Airbnb Occupancy Rate: 84%
    Average Daily Rate: $239
    Annual Revenue: $77,168
    Peak Season: July

  • Sacramento (94203 – 94299)
    Airbnb Occupancy Rate: 62%
    Average Daily Rate: $125
    Annual Revenue: $30,286
    Peak Season: July

  • San Jose (95103 – 95196)
    Airbnb Occupancy Rate: 61%
    Average Daily Rate: $125
    Annual Revenue: $30,286
    Peak Season: July

  • Long Beach (90745 – 90899)
    Airbnb Occupancy Rate: 79%
    Average Daily Rate: $159
    Annual Revenue: $49,431
    Peak Season: July

  • Palm Springs (92258 – 92292)
    Airbnb Occupancy Rate: 59%
    Average Daily Rate: $413
    Annual Revenue: $85,254
    Peak Season: March

  • Los Angeles (90001 – 90189)
    Airbnb Occupancy Rate: 76%
    Average Daily Rate: $148
    Annual Revenue: $41,749
    Peak Season: July

  • San Francisco (94101 – 94188)
    Airbnb Occupancy Rate: 80%
    Average Daily Rate: $144
    Annual Revenue: $44,190
    Peak Season: July

  • Fresno (93701 – 92199)
    Airbnb Occupancy Rate: 30%
    Average Daily Rate: $139
    Annual Revenue: $21,318
    Peak Season: January

  • San Diego (92101 – 34120)
    Airbnb Occupancy Rate: 75%
    Average Daily Rate: $238
    Annual Revenue: $65,904
    Peak Season: July

3. TEXAS

Known as the second largest state in America, Texas is popular for its live music, hot temperature, and distinct culture. Here are the top 10 cities in Texas ranked from the highest and lowest occupancy rates:

airbtics-logo-300x87
City in Texas Occupancy Rate Zip codes
1. Irving 74% 75014 - 75064
2. Austin 72% 78701 - 78799
3. Frisco 71% 75033 - 75036
4. Fort Worth 66% 76101 - 76199
5. Plano 62% 75023 - 75093
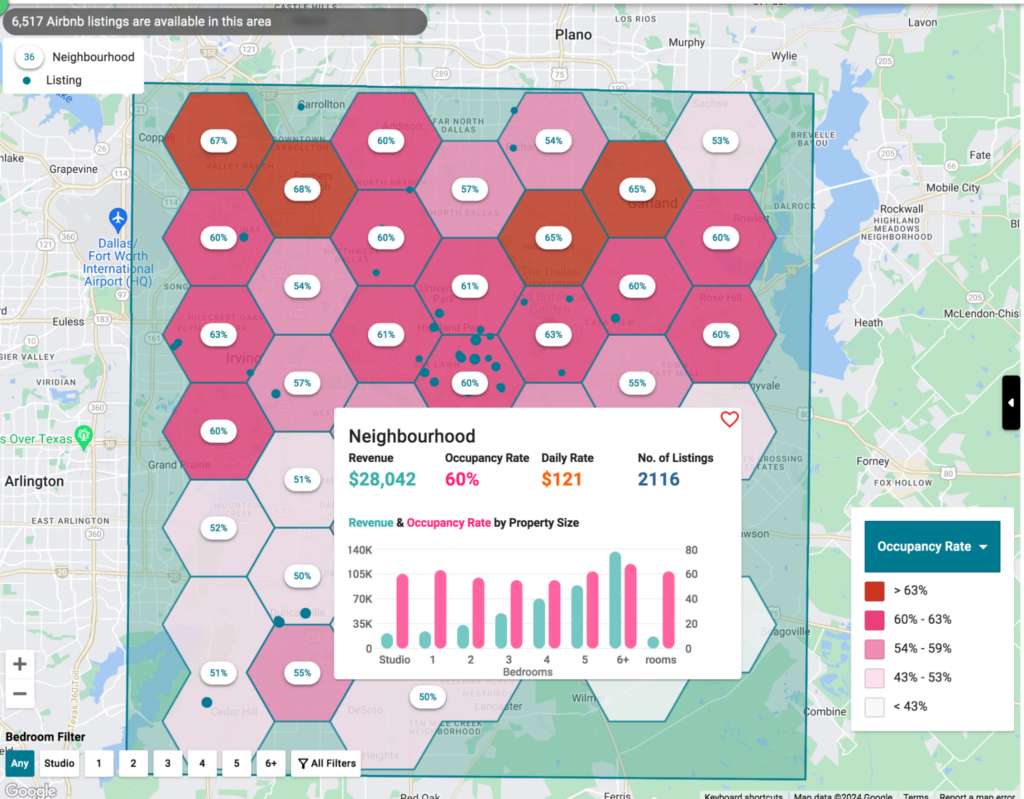
6. Dallas 61% 75201 - 75398
7. San Antonio 59% 78201 - 78299
8. El Paso 56% 799901 - 88595
9. Corpus Christi 48% 78401 - 78480
10. Houston 47% 77003 - 77299
  • Irving (75014 – 75064)
    Airbnb Occupancy Rate: 74%
    Average Daily Rate: $92
    Annual Revenue: $28,526
    Peak Season: July

  • Austin (78701 – 78799)
    Airbnb Occupancy Rate: 72%
    Average Daily Rate: $176
    Annual Revenue: $46,767
    Peak Season: March

  • Frisco (75033 – 75036)
    Airbnb Occupancy Rate: 71%
    Average Daily Rate: $140
    Annual Revenue: $34,267
    Peak Season: September

  • Fort Worth (76101 – 76199)
    Airbnb Occupancy Rate: 66%
    Average Daily Rate: $124
    Annual Revenue: $31,585
    Peak Season: August

  • Plano (75023 – 75093)
    Airbnb Occupancy Rate: 62%
    Average Daily Rate: $171
    Annual Revenue: $36,500
    Peak Season: July

  • Dallas (75201 – 75398)
    Airbnb Occupancy Rate: 61%
    Average Daily Rate: $127
    Annual Revenue: $30,380
    Peak Season: July

  • San Antonio (78201 – 78299)
    Airbnb Occupancy Rate: 59%
    Average Daily Rate: $134
    Annual Revenue: $30,784
    Peak Season: July

  • El Paso (799901 – 88595)
    Airbnb Occupancy Rate: 56%
    Average Daily Rate: $89
    Annual Revenue: $19,219
    Peak Season: July

  • Corpus Christi (78401 – 78480)
    Airbnb Occupancy Rate: 48%
    Average Daily Rate: $180
    Annual Revenue: $36,166
    Peak Season: July

  • Houston (77003 – 77299)
    Airbnb Occupancy Rate: 47%
    Average Daily Rate: $113
    Annual Revenue: $21,704
    Peak Season: March

4. ARIZONA

Arizona is mostly known for its iconic landmark, the Grand Canyon, and its rich history. Here are the top 10 cities in Arizona ranked from the highest and lowest occupancy rates:

airbtics-logo-300x87
City in Arizona Occupancy Rate Zip codes
1. Flagstaff 74% 86001 - 86011
2. Chandler 72% 85224 - 85249
3. Gilbert 71% 75033 - 75036
4. Yuma 71% 85364 - 85369
5. Tempe 70% 85280 - 85289
6. Scottsdale 69% 85250 - 85266
7. Tucson 68% 85701 - 85777
8. Phoenix 67% 85001 - 85099
9. Glendale 59% 85301 - 85318
10. Sedona 53% 86336 - 86351
  • Flagstaff (86001 – 86011)
    Airbnb Occupancy Rate: 80%
    Average Daily Rate: $164
    Annual Revenue: $51,232
    Peak Season: March

  • Chandler (85224 – 85249)
    Airbnb Occupancy Rate: 73%
    Average Daily Rate: $120
    Annual Revenue: $40,265
    Peak Season: March

  • Gilbert (75033 – 75036)
    Airbnb Occupancy Rate: 72%
    Average Daily Rate: $123
    Annual Revenue: $39,401
    Peak Season: March

  • Yuma (85364 – 85369)
    Airbnb Occupancy Rate: 71%
    Average Daily Rate: $156
    Annual Revenue: $39,631
    Peak Season: July

  • Tempe (85280 – 85289)
    Airbnb Occupancy Rate: 70%
    Average Daily Rate: $125
    Annual Revenue: $37,742
    Peak Season: March

  • Scottsdale (85250 – 85266)
    Airbnb Occupancy Rate: 69%
    Average Daily Rate: $142
    Annual Revenue: $44,880
    Peak Season: March

  • Tucson (85701 – 85777)
    Airbnb Occupancy Rate: 68%
    Average Daily Rate: $98
    Annual Revenue: $28,783
    Peak Season: February

  • Phoenix (85001 – 85099)
    Airbnb Occupancy Rate: 67%
    Average Daily Rate: $123
    Annual Revenue: $36,560
    Peak Season: March

  • Glendale (85301 – 85318)
    Airbnb Occupancy Rate: 59%
    Average Daily Rate: $210
    Annual Revenue: $60,513
    Peak Season: July

  • Sedona (86336 – 86351)
    Airbnb Occupancy Rate: 53%
    Average Daily Rate: $170
    Annual Revenue: $36,209
    Peak Season: March

5. NEW YORK

New York is mostly known for some of its popular tourist destinations such as Times Square, The Statue of Liberty, and Central Park among others. Here are the top 10 cities in New York ranked from the highest and lowest occupancy rates:

airbtics-logo-300x87
City in New York Occupancy Rate Zip codes
1. New York City 86% 10259
2. Brooklyn 85% 11201 - 11256
3. Buffalo 72% 14201 - 14280
4. Rochester 68% 14602 - 14694
5. Yonkers 66% 10701 - 10710
6. New Rochelle 66% 10801 - 10805
7. Syracuse 62% 13201 - 13290
8. Albany 60% 12201 - 12288
9. Cheektowaga 42% 14043 - 14215
10. Middletown 37% 10940 - 10943
  • New York City (10259)
    Airbnb Occupancy Rate: 86%
    Average Daily Rate: $170
    Annual Revenue: $52,910
    Peak Season: July

  • Brooklyn (11201 – 11256)
    Airbnb Occupancy Rate: 85%
    Average Daily Rate: $133
    Annual Revenue: $40,646
    Peak Season: July

  • Buffalo (14201 – 14280)
    Airbnb Occupancy Rate: 72%
    Average Daily Rate: $120
    Annual Revenue: $32,773
    Peak Season: July

  • Rochester (14602 – 14694)
    Airbnb Occupancy Rate: 68%
    Average Daily Rate: $126
    Annual Revenue: $32,789
    Peak Season: July

  • Yonkers (10701 – 10710)
    Airbnb Occupancy Rate: 66%
    Average Daily Rate: $99
    Annual Revenue: $22,018
    Peak Season: July

  • New Rochelle (10801 – 10805)
    Airbnb Occupancy Rate: 66%
    Average Daily Rate: $141
    Annual Revenue: $30,280
    Peak Season: July

  • Syracuse (13201 – 13290)
    Airbnb Occupancy Rate: 62%
    Average Daily Rate: $151
    Annual Revenue: $31,868
    Peak Season: August

  • Albany (85701 – 85777)
    Airbnb Occupancy Rate: 73%
    Average Daily Rate: $174
    Annual Revenue: $49,713
    Peak Season: March

  • Cheektowaga (14043 – 14215)
    Airbnb Occupancy Rate: 83%
    Average Daily Rate: $187
    Annual Revenue: $65,481
    Peak Season: March

  • Middletown(10940 – 10943)
    Airbnb Occupancy Rate: 67%
    Average Daily Rate: $255
    Annual Revenue: $70,844
    Peak Season: March

Takeaway

There are ready-made solutions by analytics company where you can just purchase a CSV file of US airbnb data by zipocde. 

If you want something free, you can sign up and use Airbnb analytics to get occupancy rate data of a specific zipcode.  

If a market has above 70% average occupancy rate, you can consider that market to be attractive place to start an Airbnb, at least, as of now. 

Airbnb investment in any city can be risky if market research is not done as the first step. 

Unlock Worldwide
Short-Term Rental Data
Find unsaturated neighborhoods with the highest occupancy history.

Categories
Guides

Airbnb Data New York: Top 5 Areas to do Airbnb in NYC!

Airbnb data new york

New York is undeniably a beautiful city with plenty of attractions, cafes, and even investment opportunities. It will not only satisfy your eyes with pristine sceneries – but also generate extra income with Airbnb! 

Did you know that New York City welcomed about 56 million tourists in 2022 alone? According to City Guide New York, hotels and accommodations have reported great holiday sales numbers.

Investing in a property in New York City can certainly bring a good cash flow for Airbnb hosts. However, there was a recent rule in NYC that was implemented last January 9th, 2023. This new Airbnb Regulation in NYC states that all short-term rentals are required to register in the Mayor’s Office of Special Enforcement.

While there are more requirements to be a host in NYC, it’s best to consider your potential profitability first before moving forward. Analyzing the Airbnb data for your target neighborhood will help you decide if it’s worth investing in!

In this article, we’ll feature a free Airbnb NYC dataset and the most recommended areas for Airbnb in New York. Continue reading – we’re stoked to let you know more.

Reasons for Investing in New York City

Let’s imagine that New York City is one of your dream cities to live, work, and play in. It will be an even more inspiring journey knowing that you can earn a passive income by investing in a property! Check out the top three reasons why you should consider investing in this city:

1. High quality of Living & Diverse Culture

NYC is ranked as the first city across the globe that attracts capital, business, and tourists. So if you’re looking to cater to entrepreneurs, tourists, or young professionals – this might be the best city for investing! In relation to this, people who reside in this city can expect a high quality of living. As the most populous city in America, NYC has consistently been one of the hottest real estate markets.

2. Price Appreciation

One of the major benefits of real estate investment is when the value of a property increases – especially in New York City! Real estate in NYC is a good investment in the long run due to inflation and market conditions. Norada Real Estate Investments confirms that New York’s appreciation rate is 10.54%.

3. Leverage Investments

To make a fortune by investing in NYC, you have to use your ability to leverage investments! One of the most typical examples is buying a house with mortgage financing. You can limit your own investment by putting down a small percentage of the property’s value and sharing the risk with financial institutions. The good news is that there are plenty of mortgage lenders in NYC!

Instead of spending all your money on investing in a property that you intend for Airbnb, you will only need to deposit at least 20% as a down payment with the help of a mortgage. This means that your return can potentially be much higher than what it would be without leverage.

Where to Get Airbnb Data in New York?

There are three ways how to get Airbnb data – free and paid solutions, and the traditional technique. You can get free Airbnb data by using data scraping tools such as Apify or Scrapy, but this process is a lot more complicated for newbies. 

As to the traditional way of getting Airbnb data, you will have to manually go through each listing in your target market and analyze their performance. Some of the most important Airbnb key metrics that you’ll need to collect are average daily rates, occupancy rates, and annual revenue among others. You’ll need to compare each market – and it is terribly time consuming. Even more crucial if the data is inaccurate!

The paid solution for getting Airbnb data is by subscribing to Airbnb data analytics tool. It does all the heavy lifting and time-consuming work! But most importantly, it presents accurate data for the success of your business.

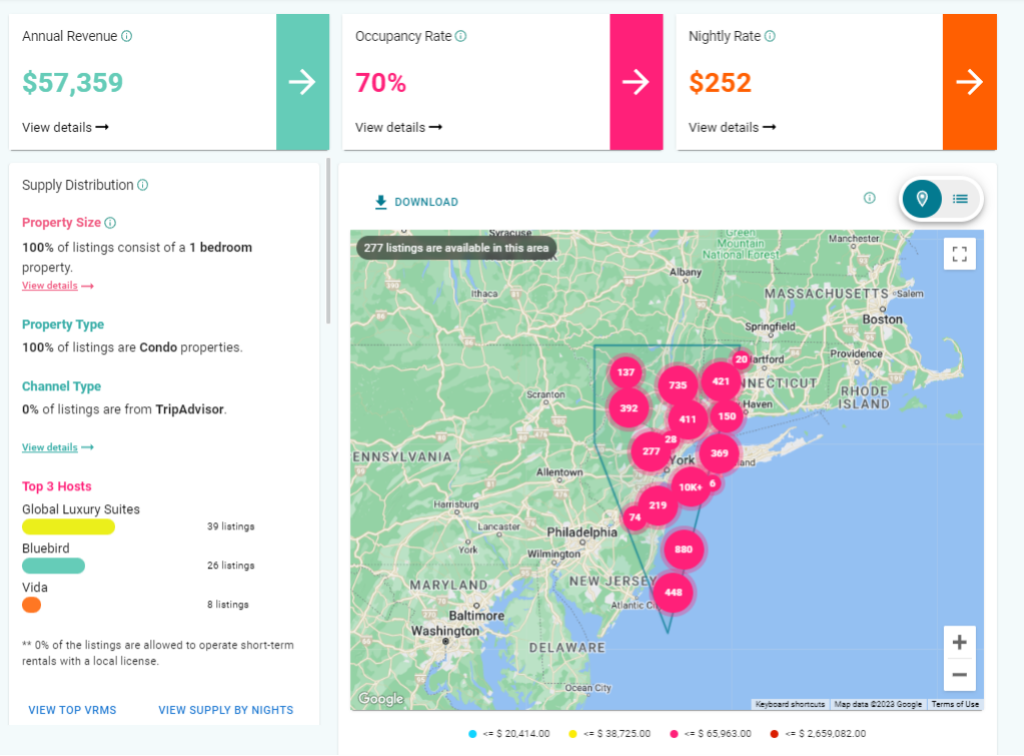
It’s important to look and understand the data first before investing in a property in New York. This is a crucial step to identifying whether you’re making the best investment decisions. Let’s take a look at the Airbnb data in New York as seen on Airbtics:

Airbnb data new york
  • Average Daily Rate in New York City: $252
  • Average Occupancy Rate in New York City: 70%
  • Annual Revenue in New York City (1-bedroom apartment): $57,359

Best Places to Airbnb in New York City:

Wondering where to Airbnb in New York? We’ve taken a close look at the 5 boroughs and distinguished their highest & lowest seasons:

1. Manhattan

The fascinating city of Manhattan attracts several tourists and business travelers. Known for some of its popular attractions such as the Times Square, One World Observatory, The Rockefeller Center, and many others. Here’s an overview of Airbnb data in Manhattan:

  • Annual Revenue (1-bedroom apartment): $74,826
  • Common Amenities Offered: Hot tub (6%) & pet-friendly spaces (20%)
  • Number of Airbnb Listings: 7,117
  • Highest Revenue (Peak Season): $7,552 in June
  • Lowest Revenue (Off-Season): $4,187 in February
2. Brooklyn

Brooklyn is not only a tourist’s fave spot – but many famous actors have also filmed their scenes in this borough. Particularly in Brooklyn Bridge and its several wondrous parks including Botanic Garden and Prospect Park. Check out the Airbnb data in Brooklyn:

  • Annual Revenue (1-bedroom apartment): $62,554
  • Common Amenities Offered: Pools (7%) & pet-friendly spaces (21%)
  • Number of Airbnb Listings: 6,410
  • Highest Revenue (Peak Season): $6,937 in October
  • Lowest Revenue (Off-Season): $3,313 in January
3. Bronx

Home of the New York Yankees, Bronx isn’t limited to baseball fans but also for those who love arts & nature! Some of the most visited attractions in Bronx include the Botanical Garden, Museum of the Arts, and Pelham Bay Park. Here’s the overview of Airbnb statistics in Bronx:

  • Annual Revenue (1-bedroom apartment): $30,660
  • Common Amenities Offered: Hot Tub (13%) & pet-friendly spaces (34%)
  • Number of Airbnb Listings: 800
  • Highest Revenue (Peak Season): $3,905 in July
  • Lowest Revenue (Off-Season): $1,078 in January
4. Staten Island

Staten Island is surrounded by rich cultural establishments and historical buildings. At the same time, one can certainly enjoy the vast green spaces! Popular attractions include Gulliver’s Gate, Jacques Marchais Museum of Tibetan Art, and Staten Island Zoo. Check out the Airbnb data in Staten Island:

  • Annual Revenue (1-bedroom apartment): $28,363
  • Common Amenities Offered: Flexible Cancellation Policy (34%) & pet-friendly spaces (22%)
  • Number of Airbnb Listings: 209
  • Highest Revenue (Peak Season): $3,348 in July
  • Lowest Revenue (Off-Season): $1,362 in January
5. Queens

Queens is best known for two of its major airports in New York City area including JFK and LaGuardia. This borough in NYC is also home to several attractions such as the Museum of Moving Image & Socrates Sculpture Park. But it’s also a tourist’s fave for its museums and restaurants. Take a look at the Airbnb statistics in Queens:

  • Annual Revenue (1-bedroom apartment): $34,927
  • Common Amenities Offered: Hot Tub (3%) & pet-friendly spaces (12%)
  • Number of Airbnb Listings: 877
  • Highest Revenue (Peak Season): $4,535 in July
  • Lowest Revenue (Off-Season): $200 in February

Summary

Getting your preferred city’s Airbnb data is an important part of successful investments. Particularly in New York City, since each neighborhood varies from one to another. New York has a lot of promising property investments that can generate long-term income, so it’s always best to discover these areas before it’s too late. Airbnb host NYC can expect more revenue with the help of Airbnb analytics tools & save precious time for research!

The markets in NYC can be quite competitive since there are several property investors eyeing on this area. Use an Airbnb profit calculator and make the best investment decisions!

Categories
Airbnb Investment All About Airbnb

Airbnb Host Japan: Rules, Requirements, and Profitable Airbnb Cities in Japan

Airbnb host Japan

If you were ever to visit an East Asian country, you surely wouldn’t want to miss Japan. Millions of tourists every year visit Japan for its cherry blossom trees, anime, and sushi boat restaurants among others. In fact, Airbnb revealed that plenty of tourists have Japan on their wishlists! The top searched destinations in Japan by global travelers in 2022 are Osaka, Tokyo, Shinjuku, Shibuya, and Fukuoka.

But if you are considering starting an Airbnb business, the question is: Is Airbnb legal in Japan? 

In this article, we’ll feature the Airbnb rules in Japan and requirements for hosting. Bonus: We also added the top 5 profitable Airbnb cities in Japan for your guide! Continue reading to learn more.

Is Airbnb Legal in Japan?

Yes – Airbnb is legal in Japan! If you’re wondering, “is Airbnb legal in Tokyo or other cities?” – then the answer is also yes. Here is the list of requirements for being an Airbnb host in Japan:

  • Register your property & display a license number on the listing.
  • Submit a copy of your passport (for foreigners). This is not required for those who have a permanent residency card.
  • Local laws and regulations may vary depending on where your property is located. For more information, you can check Japan’s enforcement order.

How to become an Airbnb host in Japan?

Being an Airbnb host in Japan is easy if you are a Japanese national. All you have to do is register your property at the local city hall and report all your guests’ information once every two months. However, it can be a different process for foreigners. Let’s not forget – if you don’t speak Japanese, it can be a major challenge to host an Airbnb in Japan.

Other foreigners who own Airbnbs in Japan had to go through agencies and their local embassy. If you have a few friends in Japan, they may be able to help you communicate with locals and fill out certain forms! 

What to Expect When Hosting an Airbnb in Japan?

Some Airbnb Japan rules can be frustrating if you’re a foreigner. As an Airbnb host in Japan, you are capped at 180 days out of a year. But there are also exceptions! You can apply for a Special Zone Private Lodging certificate if your property is located in special zone areas. You will NOT be capped for 180 days a year, but your guests are required to stay a minimum of two nights at a time.

If your property is within the Special Zone areas, this means that your location is mostly visited by tourists. Therefore, it’s considered an important area by the Japanese government! Some parts of Osaka, Tokyo, Niigata, and Kyushu are included in the special zone areas. 

At the same time, you can also expect to host various international & local guests from across the world. It can be difficult to converse with Japanese locals, so you might also consider learning their language.

Superhost pro tip: It’s helpful to print a local map for international guests so they can know their way around! This can include the top recommendations for tourist destinations, restaurants, and coffee shops.

How much can I earn to do Airbnb in Japan?

Let’s get to the money talks. How much revenue can you earn by doing Airbnb in Japan? This varies according to your location, property type, and amenities offered among others.

To be more specific, we cited Tokyo as an example. Here’s how much an Airbnb host in Tokyo can earn:

  • Airbnb data for Studio-type apartment:
    Average daily rate in Tokyo: $76
    Occupancy rate in Tokyo: 20%
    Annual revenue in Tokyo: $6,590

  • Airbnb data for 1-bedroom apartment:
    Average daily rate in Tokyo: $71
    Occupancy rate in Tokyo: 38%
    Annual revenue in Tokyo: $10,935

  • Airbnb data for 2-3 bedrooms apartment:
    Average daily rate in Tokyo: $115
    Occupancy rate in Tokyo: 23%
    Annual revenue in Tokyo: $11,164

Top 5 Most Profitable Airbnb Locations in Japan

1. Saitama
  • Average Property Price: ¥28,140,000 ($217,674)
  • Average Annual Revenue: ¥1,507,743 ($11,663)
  • Gross Rental Yield: 5.3%
  • Average Daily Rate: ¥9,178 ($71)
  • Occupancy Rate: 39% 
  • Seasonality: 62%
2. Kyoto
  • Average Property Price: ¥34,190,000 ($264,473)
  • Average Annual Revenue: ¥992,708 ($7,679)
  • Gross Rental Yield: 2.9%
  • Average Daily Rate: ¥11,376 ($88)
  • Occupancy Rate: 22% 
  • Seasonality: 74%
3. Osaka
  • Average Property Price: ¥30,000,000 ($232,062)
  • Average Annual Revenue: ¥700, 286 ($5,417)
  • Gross Rental Yield: 2.3%
  • Average Daily Rate: ¥8,402 ($65)
  • Occupancy Rate: 86% 
  • Seasonality: 74%
4. Nagasaki
  • Average Property Price: ¥20,440,000 ($158,111)
  • Average Annual Revenue: ¥914,626 ($7,075)
  • Gross Rental Yield: 4.4%
  • Average Daily Rate: ¥302 
  • Occupancy Rate: 41% 
  • Seasonality: 57%
5. Okinawa
  • Average Property Price: ¥34,300,000 ($265,324)
  • Average Annual Revenue: ¥1,197,093 ($9,260)
  • Gross Rental Yield: 3.4%
  • Average Daily Rate: ¥9,049 ($70) 
  • Occupancy Rate: 30% 
  • Seasonality: 60%

Summary

Now that you have a complete overview of how Airbnb hosts operate in Japan, it’s time to take the business to the next step and make more money! Using an Airbnb analytics tool like Airbtics, you can discover profitable properties and predict your profitability with an Airbnb profit calculator.

This will help you leverage your Airbnb business – no matter which city you choose. By looking at your competitors’ performance, anticipating off-seasons, and knowing your potential revenue – you’re off to a successful start. 

Try using an Airbnb income calculator now and stand out among the rest!

Categories
Airbnb Investment All About Airbnb

Top 10 Most Profitable Airbnb Cities in Australia

Top 10 Most Profitable Airbnb Cities in Australia: Do you want to invest in an Airbnb property in Australia? Continue reading to check out the most profitable Airbnb locations in Australia!

Top 10 Most Profitable Airbnb Cities in Australia

Most profitable Airbnb locations Australia

Top 10 Most Profitable Airbnb Cities in Australia

Do you want to invest in an Airbnb property in Australia? Continue reading to check out the most profitable Airbnb locations in Australia!

Australia is undeniably one of the global destinations visited by most tourists. Particularly during the summertime! Not only does it offer pristine beachfront areas, but also lakefront, camping sites, cabins, and many others. All the existing rental opportunities you can find here.

In fact, Airbnb News recently revealed the most-searched beach areas in Australia. They even stated that now, during the winter time in January, is the perfect time to become a host and earn a side income!

In this article, we’ll take a look at Airbnb data in Australia to help you make an informed investment decision. This includes potential annual revenue, seasonality, and Airbnb occupancy rates in Australia

Bonus: we also added the top 10 most profitable Airbnb cities in Australia – continue reading to learn more!

Why Invest in Airbnb Properties in Australia?

Some of the favorite attractions in Australia are Sydney Opera House, Harbour Bridge, and Bondi Beach among others. Investing in a property is an exciting journey, but it’s important to look at facts too. Here’s why we recommend investing in Airbnb properties in Australia: 

1. Offers Undervalued Properties

There are several undervalued properties in Australia that are excellent for Airbnb. 

For instance, Perth has the most undervalued properties in all Australian capital cities based on Investor Kit. The median property price in Perth costs A$510,000. This is 64% less than the maximum price that a local household can afford.

Buying an expensive property in a high-revenue market can take more than 10 years for your investment to recoup. It’s important to find undervalued properties for Airbnb if you want to generate a good return. And the good news is Australia offers undervalued properties for your Airbnb!

2. Economic stability

Australia is a highly developed country with low unemployment rates & accessible transportation. There is also a notable high demand for rental properties. Particularly because of young professionals and entrepreneurs working within the city centers. 

Investing in a property in Australia can be a perfect source of income for Airbnb hosts. Primarily because of its stable and flourishing economy.

3. Excellent Source of Passive Income

Investing in Airbnb properties in Australia can definitely be a great source of income. This is why more and more Airbnb hosts join the community each year!

Airbnb properties can generate more money than traditional renting. This is because you can adjust your prices per night according to seasonality, demand, local events, and others.

According to Airbtics, an Airbnb host in Australia can expect the following:

    • Average Airbnb occupancy rate in Australia: 53%
    • Average Daily Rate Australia: A$278
    • Average Annual Revenue Australia: A$48,760
Pro Book

Deeper STR Insights. Broader Investment Opportunities.

Want to go deeper, broader, and faster? Supercharge your Airbnb Investment by accessing the most in-depth Airbnb & real estate insights with our exclusive STR report.

Top 10 Most Profitable Airbnb Cities in Australia

Before you invest in a particular city or neighborhood, it’s best to make a comparison first! This will help you gauge the budget and meet your financial goals. Discover Airbnb data Australia:

Most profitable Airbnb locations Australia
1. Sydney, New South Wales

Known as the capital of New South Wales, Sydney has certainly impressed millions of people around the world. With over 2.2 million tourist arrivals in 2022, this city will not disappoint! Airbnb hosts can expect the following when investing in a property in Sydney:

  • Average Property Price (1-bedroom property): A$737,500
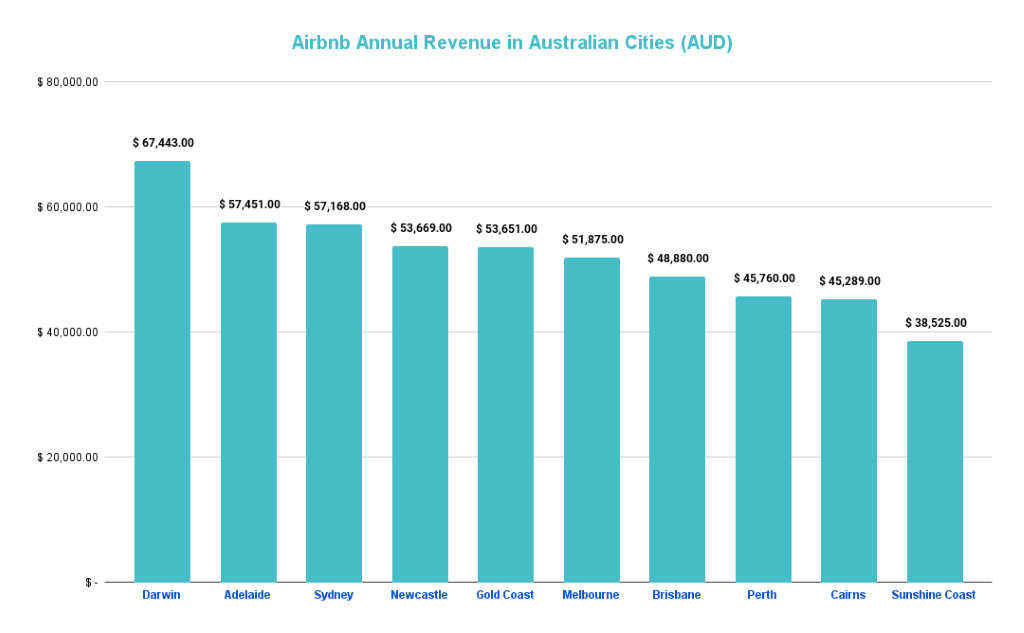
  • Average Annual Revenue in Sydney: A$57,168
  • Gross Rental Yield: 7.75%
  • Average Daily Rate in Sydney: A$252 
  • Occupancy Rate in Sydney: 61% 
  • Seasonality: 51%
2. Melbourne, Victoria

Melbourne is home to Australia’s major sports and cultural events. Because of its rich history and top-notch universities, this city has become more of a favorite tourist destination. Check out the Airbnb data in Melbourne:

  • Average Property Price (1-bedroom property): A$542,000
  • Average Annual Revenue in Melbourne: A$51,875
  • Gross Rental Yield: 9.57%
  • Average Daily Rate in Melbourne: A$212 
  • Airbnb Occupancy Rate Melbourne: 67% 
  • Seasonality: 33%
3. Brisbane

If you’re looking to experience authentic Australian adventure, Brisbane is one of the best cities to go to! Its world-renowned Australia Zoo and City Botanic Gardens will certainly not disappoint. Here’s what you can expect if you invest in a property in Brisbane:

  • Average Property Price (1-bedroom property): A$325,000
  • Average Annual Revenue in Brisbane: A$48,880
  • Gross Rental Yield: 15.04%
  • Average Daily Rate in Brisbane: A$209
  • Occupancy Rate in Brisbane: 63% 
  • Seasonality: 52%
4. Adelaide

If you are looking for a vibrant city life with multi-cultural cuisine, Adelaide is the best city for this! This city also offers pristine beach areas and fun outdoor activities that most tourists would dig into. Discover the Airbnb statistics in Adelaide:

  • Average Property Price (1-bedroom property): A$375,000
  • Average Annual Revenue in Adelaide: A$57,451
  • Gross Rental Yield: 15.32%
  • Average Daily Rate in Adelaide: A$190
  • Occupancy Rate in Adelaide: 82% 
  • Seasonality: 29%
5. Perth

Aside from the fact that there are several undervalued properties in this city, Perth can offer so much more! This city is surrounded by Australia’s most fascinating nature. Known for being the most isolated capital in the world, Perth still offers bright and sunny weather. Here’s what you need to know when investing in a property in Perth:

  • Average Property Price (1-bedroom property): A$370,000
  • Average Annual Revenue in Perth: A$45,760
  • Gross Rental Yield: 12.36%
  • Average Daily Rate in Perth: A$135 
  • Occupancy Rate in Perth: 87% 
  • Seasonality: 30%
6. Darwin

Darwin is the capital of Australia’s Northern Territory and is one of the fastest growing economies in the country. From museums and art galleries to beachfront areas, this city is a crowd favorite! Based on Airbtics, this city has the highest annual revenue of A$67,443 for a 1-bedroom property alone. Check out the Airbnb data in Darwin:

  • Average Property Price (1-bedroom property): A$430,000
  • Average Annual Revenue in Darwin: A$67,443
  • Gross Rental Yield: 15.68%
  • Average Daily Rate in Darwin: A$220
  • Occupancy Rate in Darwin: 69% 
  • Seasonality: 82%
7. Gold Coast, Queensland

Gold Coast is a favorite summer destination for most local & international tourists. Because of its theme parks and peaceful beach areas, this city has attracted more than 4.2 million visitors yearly. Before investing in a property in Gold Coast, here’s what you can expect:

  • Average Property Price (1-bedroom property): A$529,500
  • Average Annual Revenue in Gold Coast: A$53,651
  • Gross Rental Yield: 10.13%
  • Average Daily Rate in Gold Coast: A$200
  • Occupancy Rate in Gold Coast: 74% 
  • Seasonality: 43%
8. Newcastle, New South Wales

Looking for a gateway to the Hunter Valley? Newcastle is the second-largest city in NSW and has several cafes and restaurants that digital nomads can enjoy. Discover what you can earn in Newcastle with the Airbnb data below:

  • Average Property Price (1-bedroom property): A$695,000
  • Average Annual Revenue in Newcastle: A$53,669
  • Gross Rental Yield: 7.72%
  • Average Daily Rate in Newcastle: A$220
  • Occupancy Rate in Newcastle: 67% 
  • Seasonality: 34%
9. Cairns, Queensland

Cairns is best known for exploring Australian nature. From waterfalls, rainforests, to snorkeling – this city has you covered! Most of the tourists and students visiting Cairns are up for discovering the Great Barrier Reef. Here’s what you need to know before investing in a property in Cairns:

  • Average Property Price (1-bedroom property): A$399,500
  • Average Annual Revenue in Cairns: A$45,289
  • Gross Rental Yield: 11.33%
  • Average Daily Rate in Cairns: A$155 
  • Occupancy Rate in Cairns: 77% 
  • Seasonality: 62%
10. Sunshine Coast, Queensland

Known for being one of the most popular holiday destinations in Australia, Sunshine Coast is truly a tourist favorite! This region has the most pristine natural environments and offers a laid-back environment. Check out the Airbnb data in Sunshine Coast:

  • Average Property Price (1-bedroom property): A$650,000
  • Average Annual Revenue in Sunshine Coast: A$
  • Gross Rental Yield: 
  • Average Daily Rate in Sunshine Coast: A$302 
  • Occupancy Rate in Sunshine Coast: 68% 
  • Seasonality: 30%

Takeaway

Each neighborhood in the following Australian cities has various property prices and profitability. Therefore, if you want to explore other areas, you definitely can! With the help of an Airbnb profit calculator, you can discover profitable properties and make informed decisions.

Now more than ever is the best time to take advantage of Airbnb analytics tools to leverage your game in the short-term rental industry. Choose to stand out among the rest and try Airbtics!

Unlock Worldwide
Short-Term Rental Data
Find unsaturated neighborhoods with the highest occupancy history.

Unlock Worldwide
Short-Term Rental Data
Find unsaturated neighborhoods with the highest occupancy history.

Keep Reading

Airbnb House cleaning checklist
Ultimate Airbnb House cleaning checklist 2021

A clean home is a happy home, even if it’s only temporary. Your Airbnb listing serves as a temporary home for your guests. When they …

Read More →
Annual Airbnb Revenue in Daytona beach shores florida, USA

Daytona Beach Shores, Florida| Airbnb Market Data & Overview | USA Daytona Beach Shores, Florida Airbnb Market Data & Overview USA Is it profitable to …

Read More →
Annual Airbnb Revenue in Silverado california, USA

Silverado, California| Airbnb Market Data & Overview | USA Silverado, California Airbnb Market Data & Overview USA Is it profitable to do Airbnb in Silverado, …

Read More →
Annual Airbnb Revenue in Reading ohio, USA

Reading, Ohio| Airbnb Market Data & Overview | USA Reading, Ohio Airbnb Market Data & Overview USA Is it profitable to do Airbnb in Reading, …

Read More →
Annual Airbnb Revenue in Springfield massachusetts, USA

Springfield, Massachusetts| Airbnb Market Data & Overview | USA Springfield, Massachusetts Airbnb Market Data & Overview USA Is it profitable to do Airbnb in Springfield, …

Read More →
Reglas Airbnb en Zaragoza

Si es que deseas comprar inversiones inmobiliarias en España, el primer paso que debes realizar es conocer más a fondo las reglas de Airbnb! En …

Read More →

Airbnb Data
Airbnb Data

Join The Club!

Get a free weekly
Data-DRIVEN REPORT

will only send you value bombs

ARE YOU IN?

Get Access to our weekly data-driven airbnb report!