Residential property investment is one of the lowest-risk investments. But did you know you can achieve a 10% net rental yield by listing your property on Airbnb? By combining property appreciation and high cash flow, you can achieve 3-4 times the return on your investment in 10 years.
How can you make the most money out of your residential investment property? I believe the answer is running an Airbnb.
By combining high monthly cash flow from short-term rentals with annual property appreciation, you can easily achieve 3 times return on your investment in the next 10 years.
“ Hi, I’m Jae, the founder and data scientist at Airbtics. We help investors to achieve ten thousand dollars in monthly passive income faster with short-term rental data.”
Why Short-term rental market analysis?
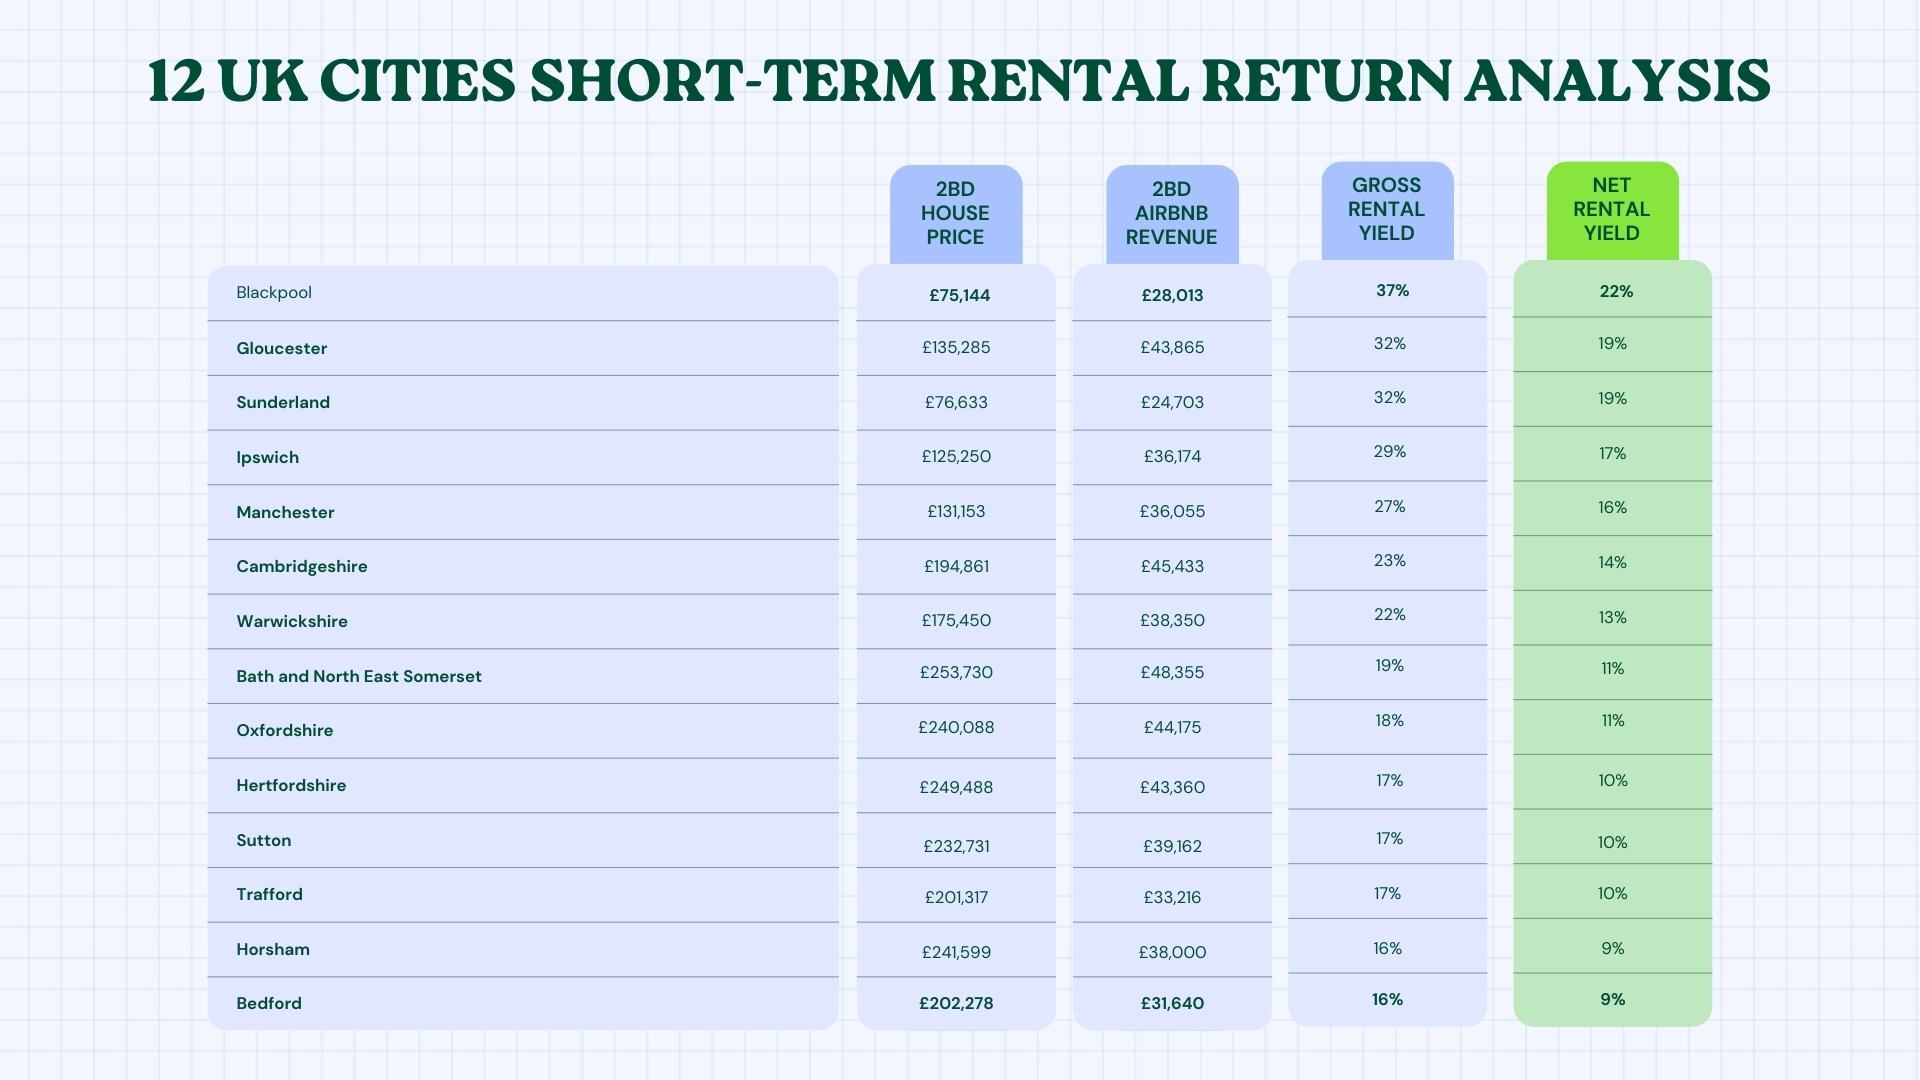
So, I’ve looked into short-term rental yields of more than 100 markets worldwide. As expected, there are many markets where the average expected Airbnb revenue is about the same in two cities, but the property prices are much cheaper in one city.
Here, you can find that the average net short-term rental yield varies between 9% and 22%. What I want to emphasize is that the yield varies significantly depending on the market. Keep in mind, that this is just an average. The net yield in the best market is 2.3 times higher than in the worst market.
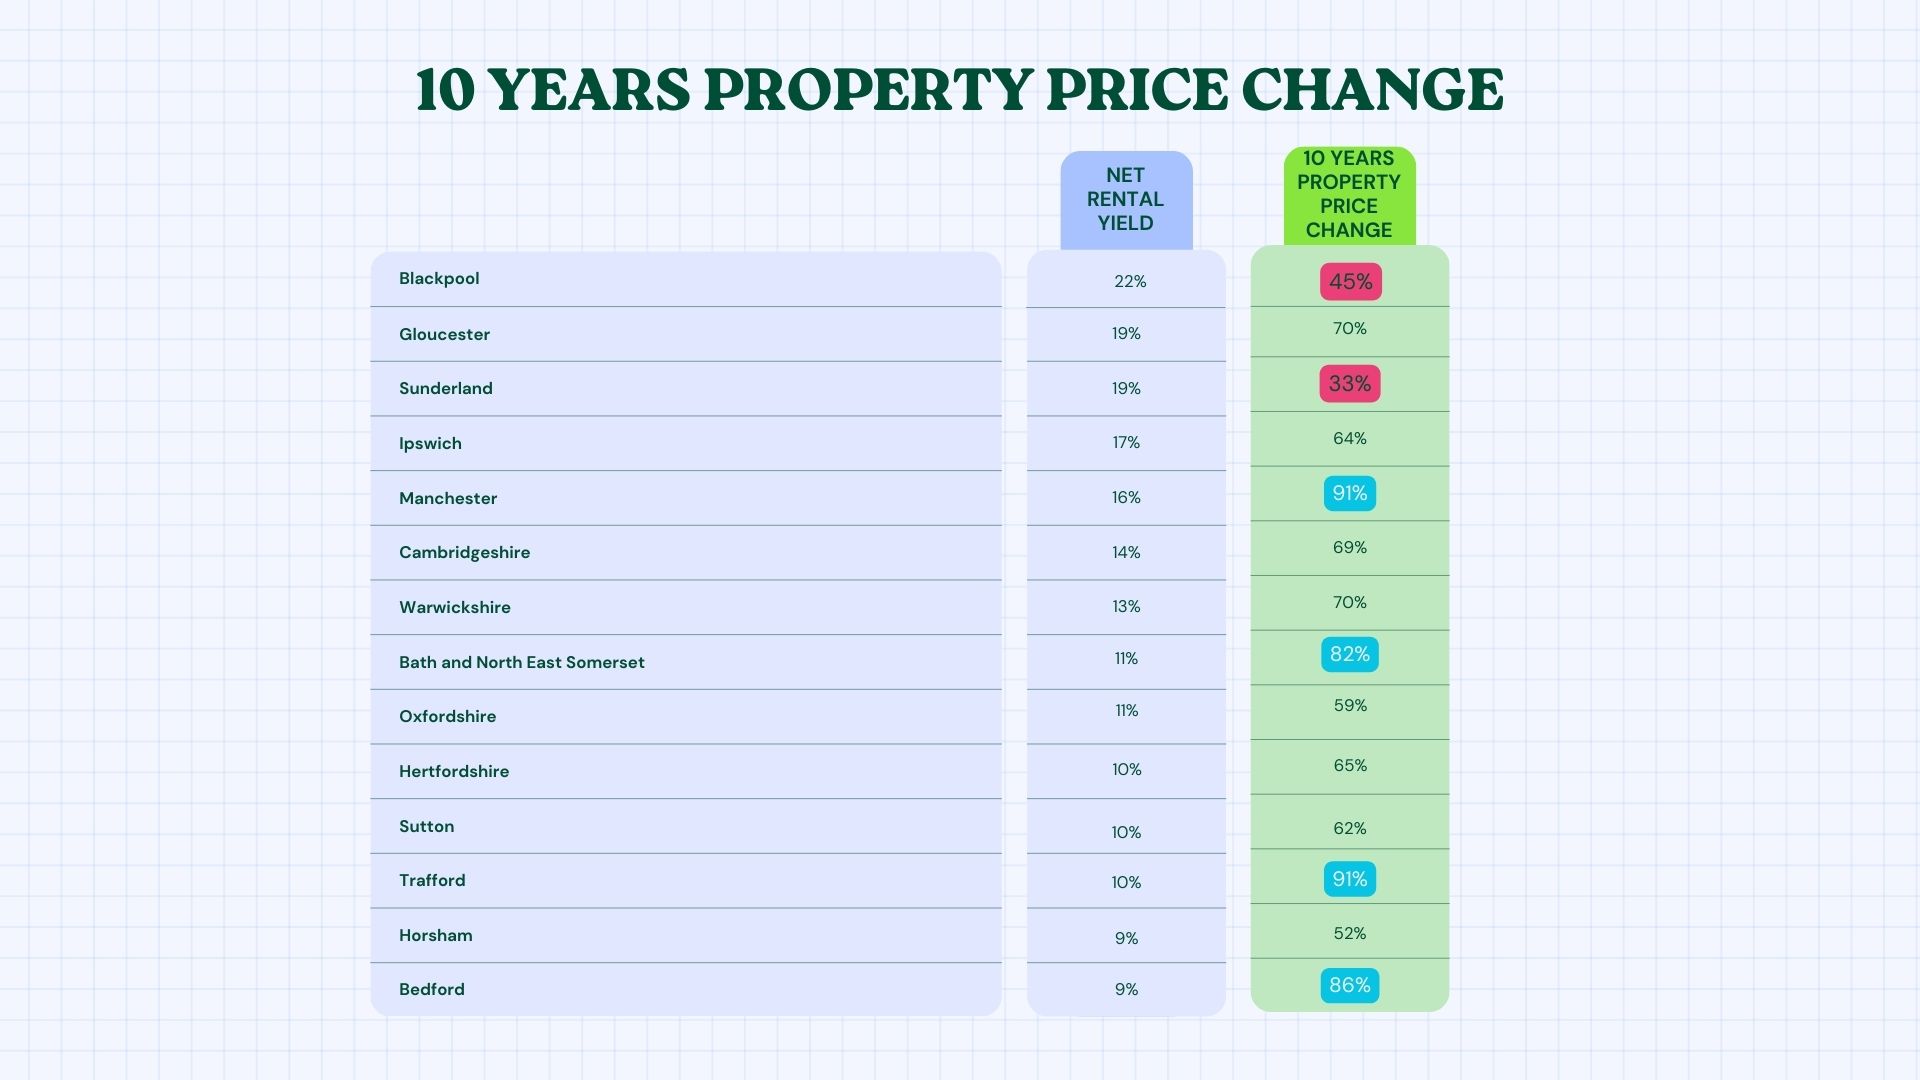
Now, let’s take a look at the ten-year average property price changes in these markets, ranging from a 91% increase to a 33% increase in property prices over the last decade. It’s crucial to note that property price changes and net rental yields are not inversely proportional. This indicates that a market can experience both high net yield and high property appreciation.
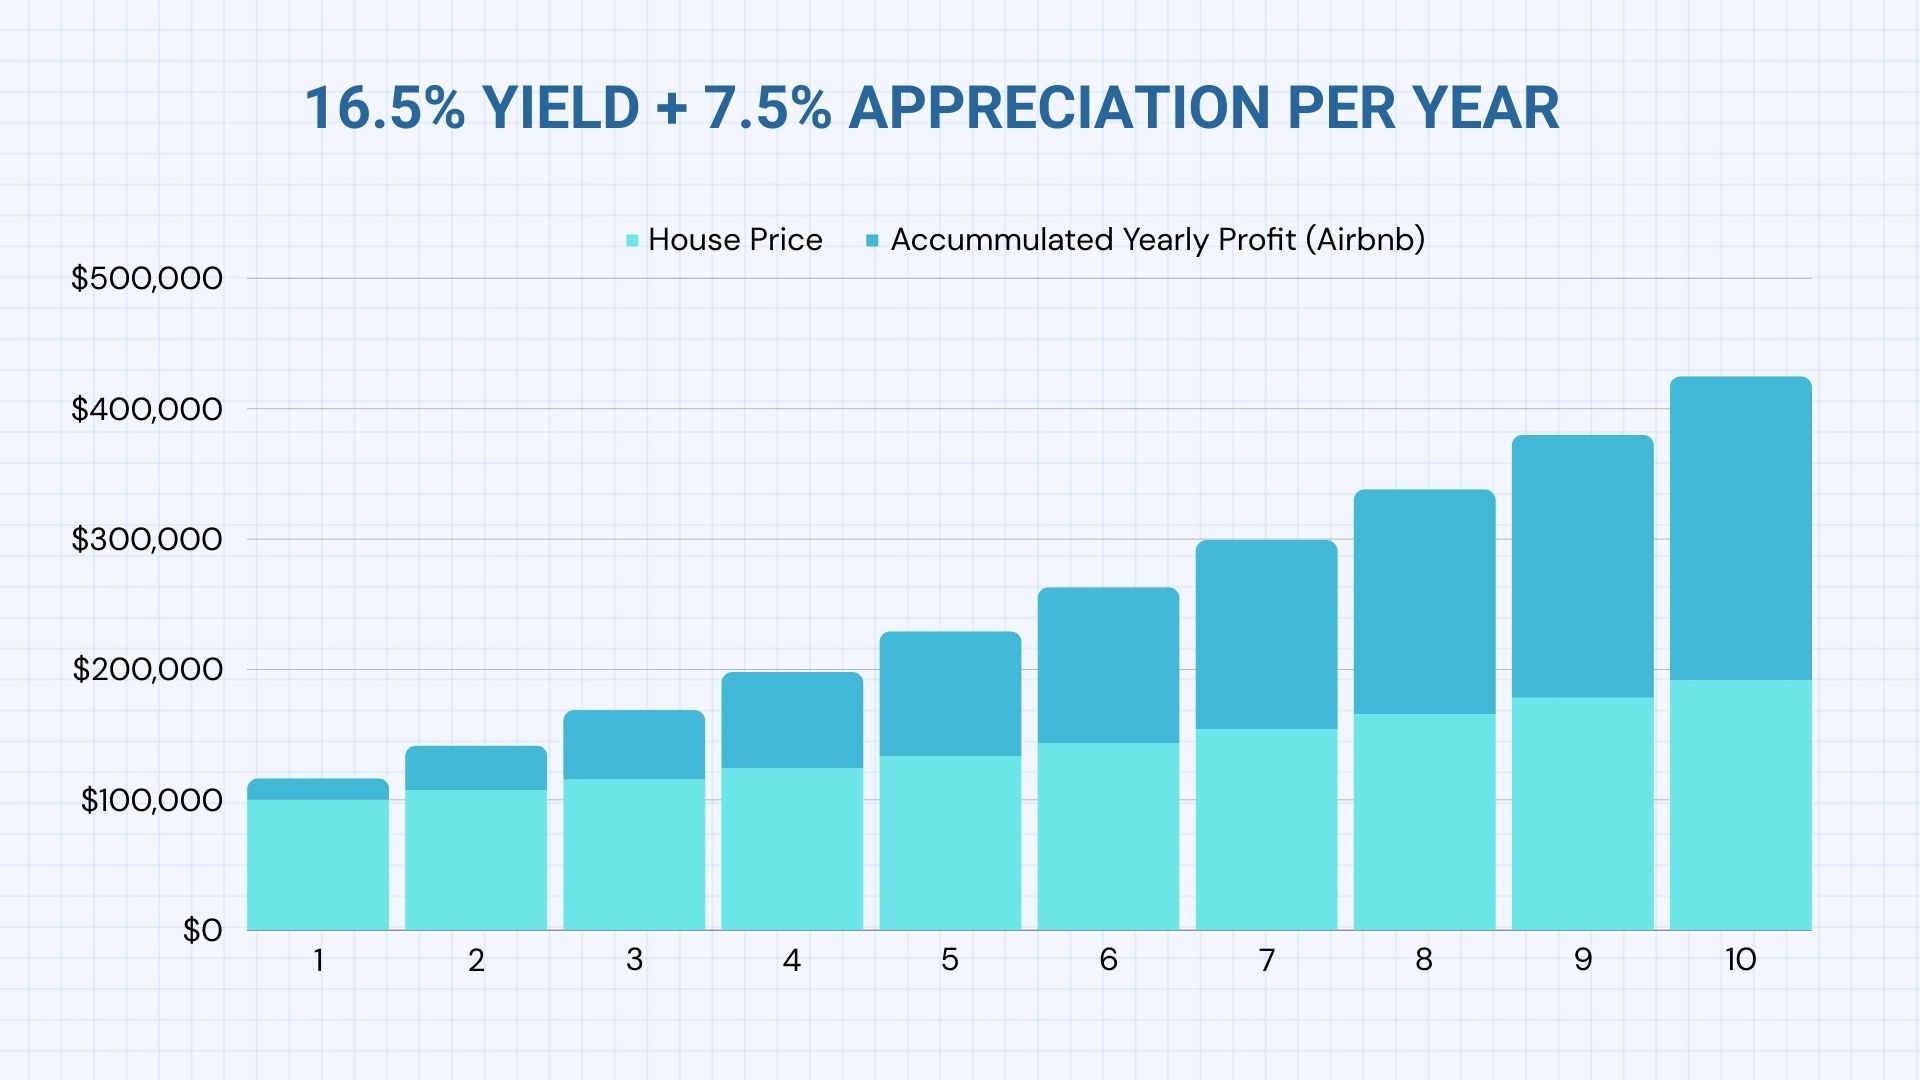
After exploring these 29 markets through 29 simulations, it’s evident that Manchester would have generated the most wealth for you. In Manchester, the average property value increased by 91% in 10 years, translating to a 7.5% annual increase. An average short-term rental host recorded a 16.5% annual net rental yield. Your initial $100,000 investment in a short-term rental would have resulted in a total wealth of $425,000 after 10 years.If you had invested in the S&P 500, which recorded an 11% average annual appreciation, your wealth would have been a mere $235,795.
3 key factors for a profitable short-term rental market
Alright, let’s break it down to the three key factors you should keep an eye on. These are the three.
Population Growth (10 years change)
Income Growth (10 years change)
Short term rental yields (Last 3 years average)
Real estate researchers agree that population and economic growth are the most fundamental property pricing drivers. There is a limited amount of land in every city. If more people want to live there, and if they can afford higher property prices, this will drive the property price.
Now, let’s talk about finding that perfect city to kickstart your Airbnb venture.
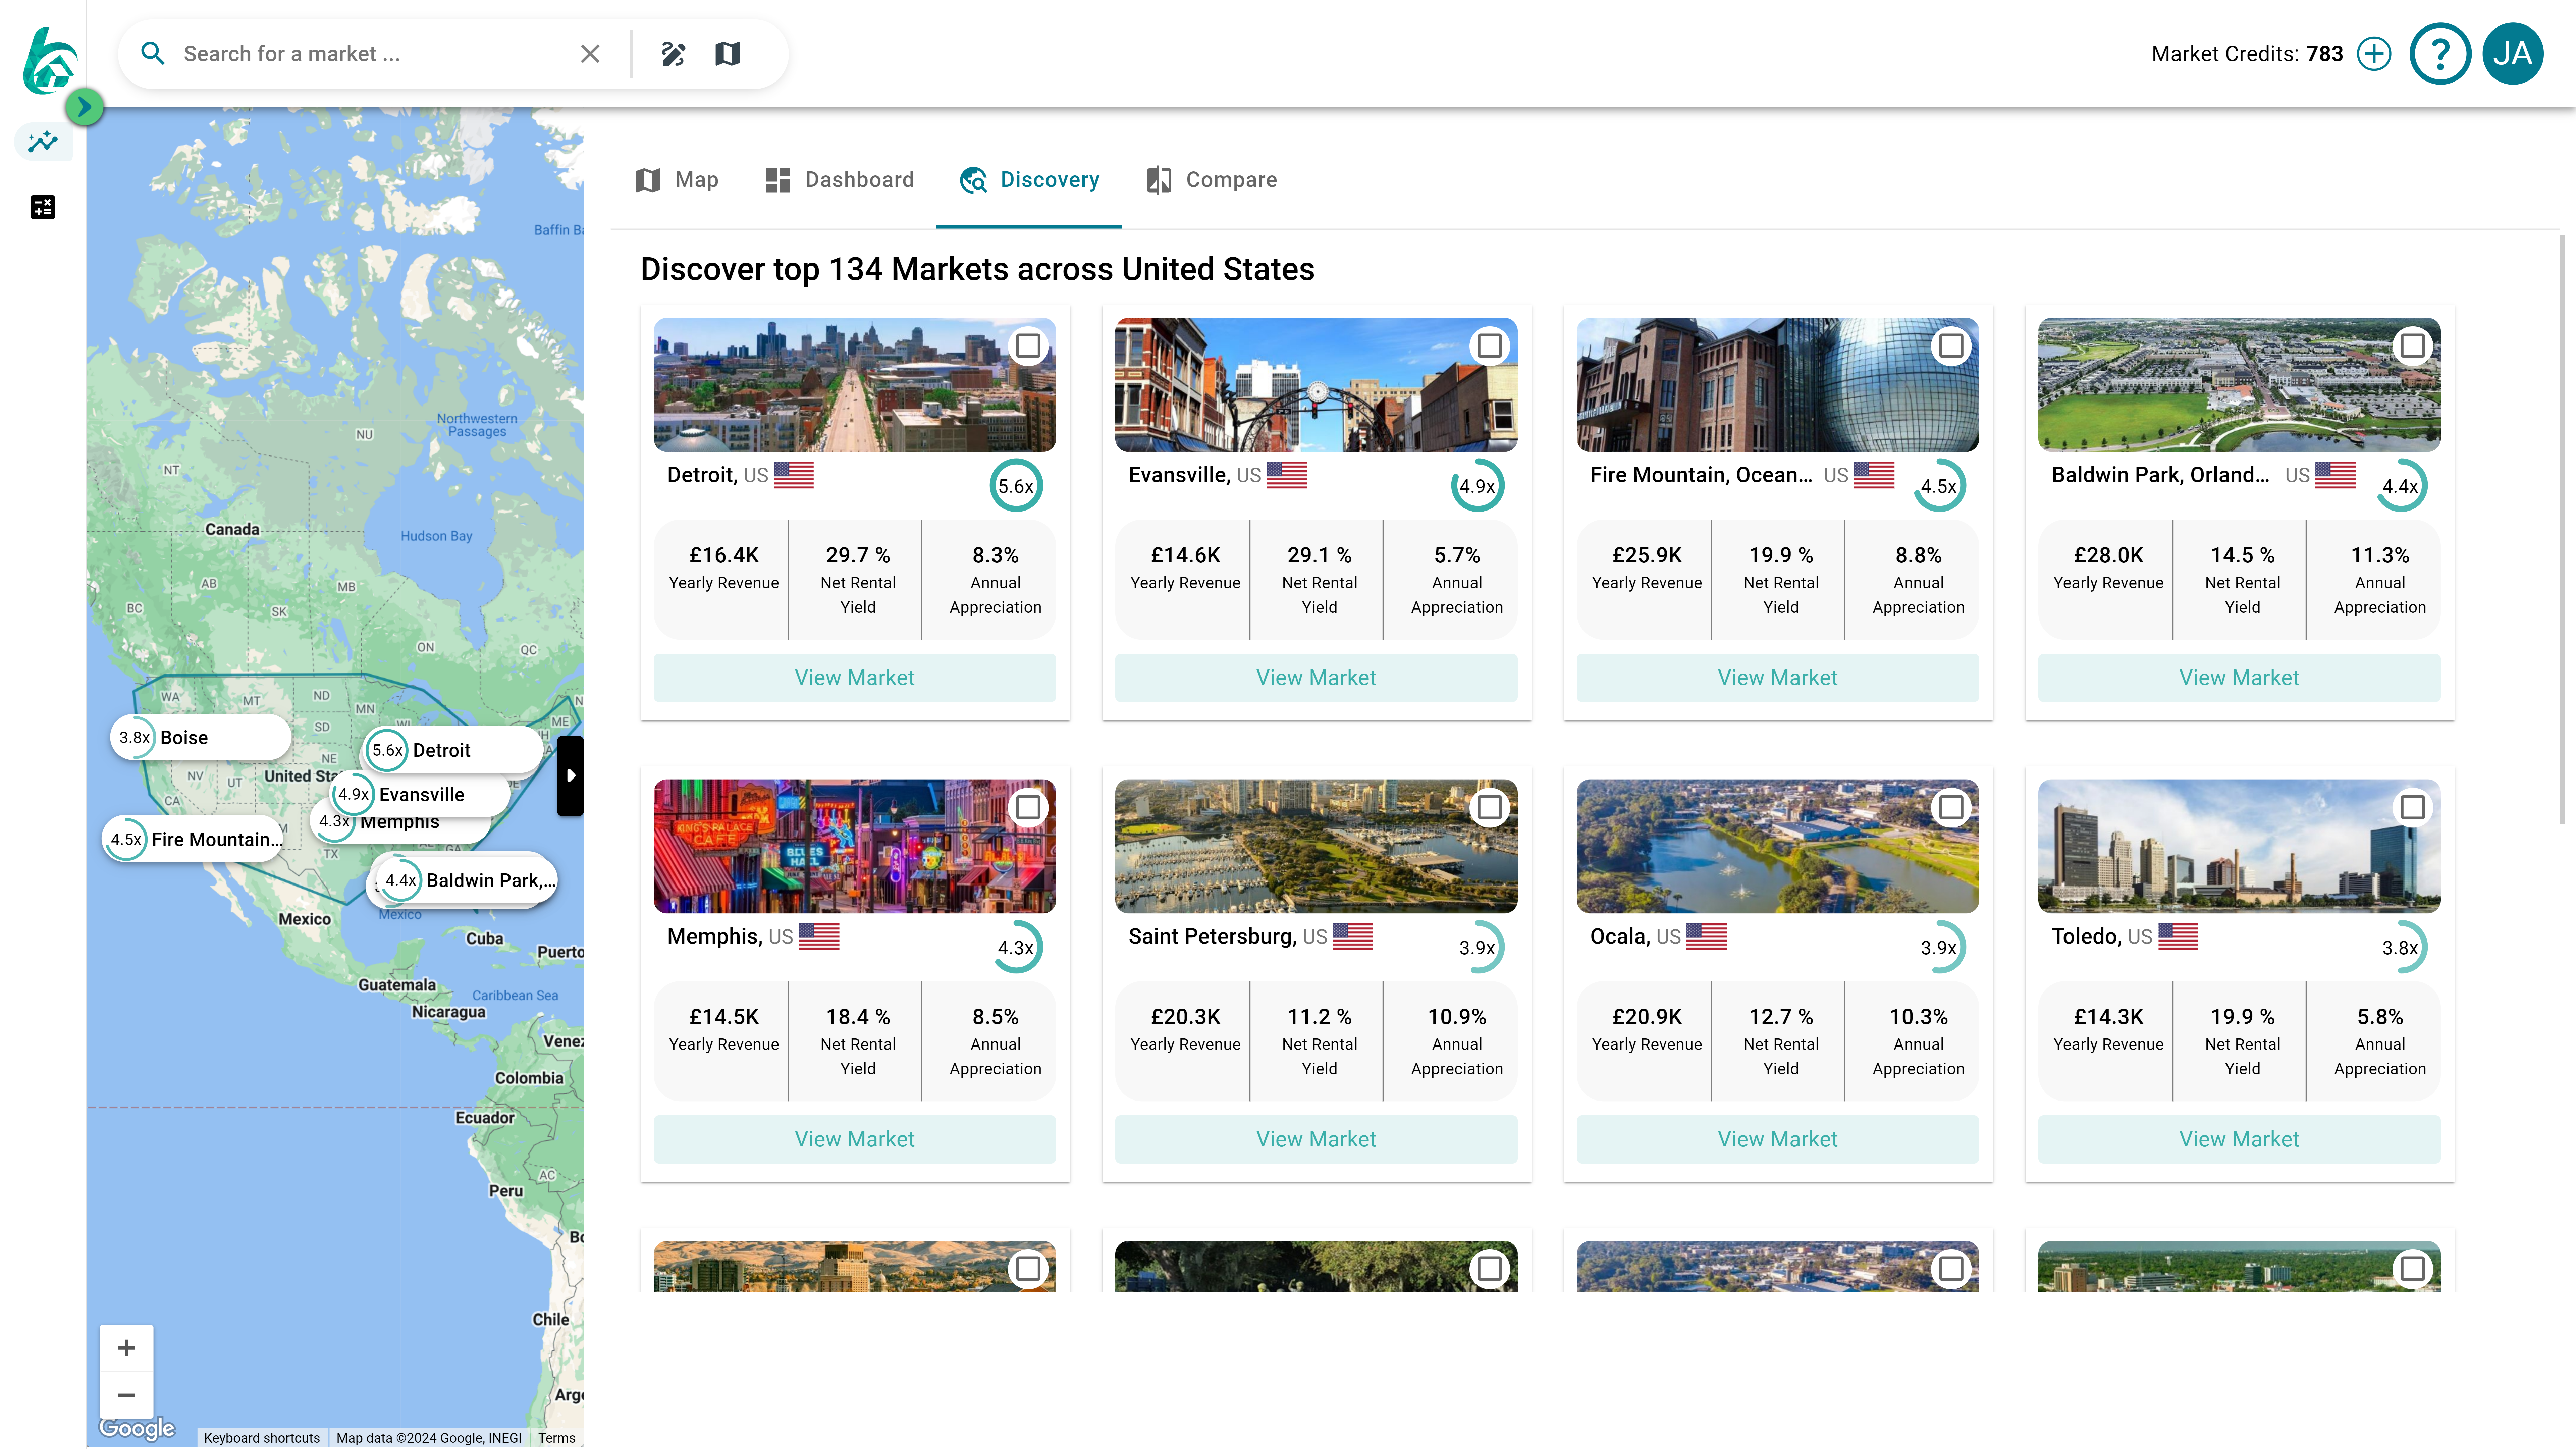
How to use short-term rental analytics tool
Alright, let’s dive into this map. It’s like your secret weapon for finding profitable markets. A high market grade here means the market has a high short-term rental yield, paired with some serious population and income growth in the last 10 years. And the best part? It’s all at your fingertips. Just click around, and boom, you’ve got the market grades of other cities right there.
Now, where do we get our data? We use official government stats for population and income levels. And when it comes to property and short-term rental data, our software is on it. We’re scanning sites like Airbnb and Zillow, monitoring over 10M listings every single week. We’ve been doing this since 2019.
Have you found an interesting market? Good, because once you spot a market that you like, head on over to the comparison tab. Voila! You can compare key market statistics side by side.
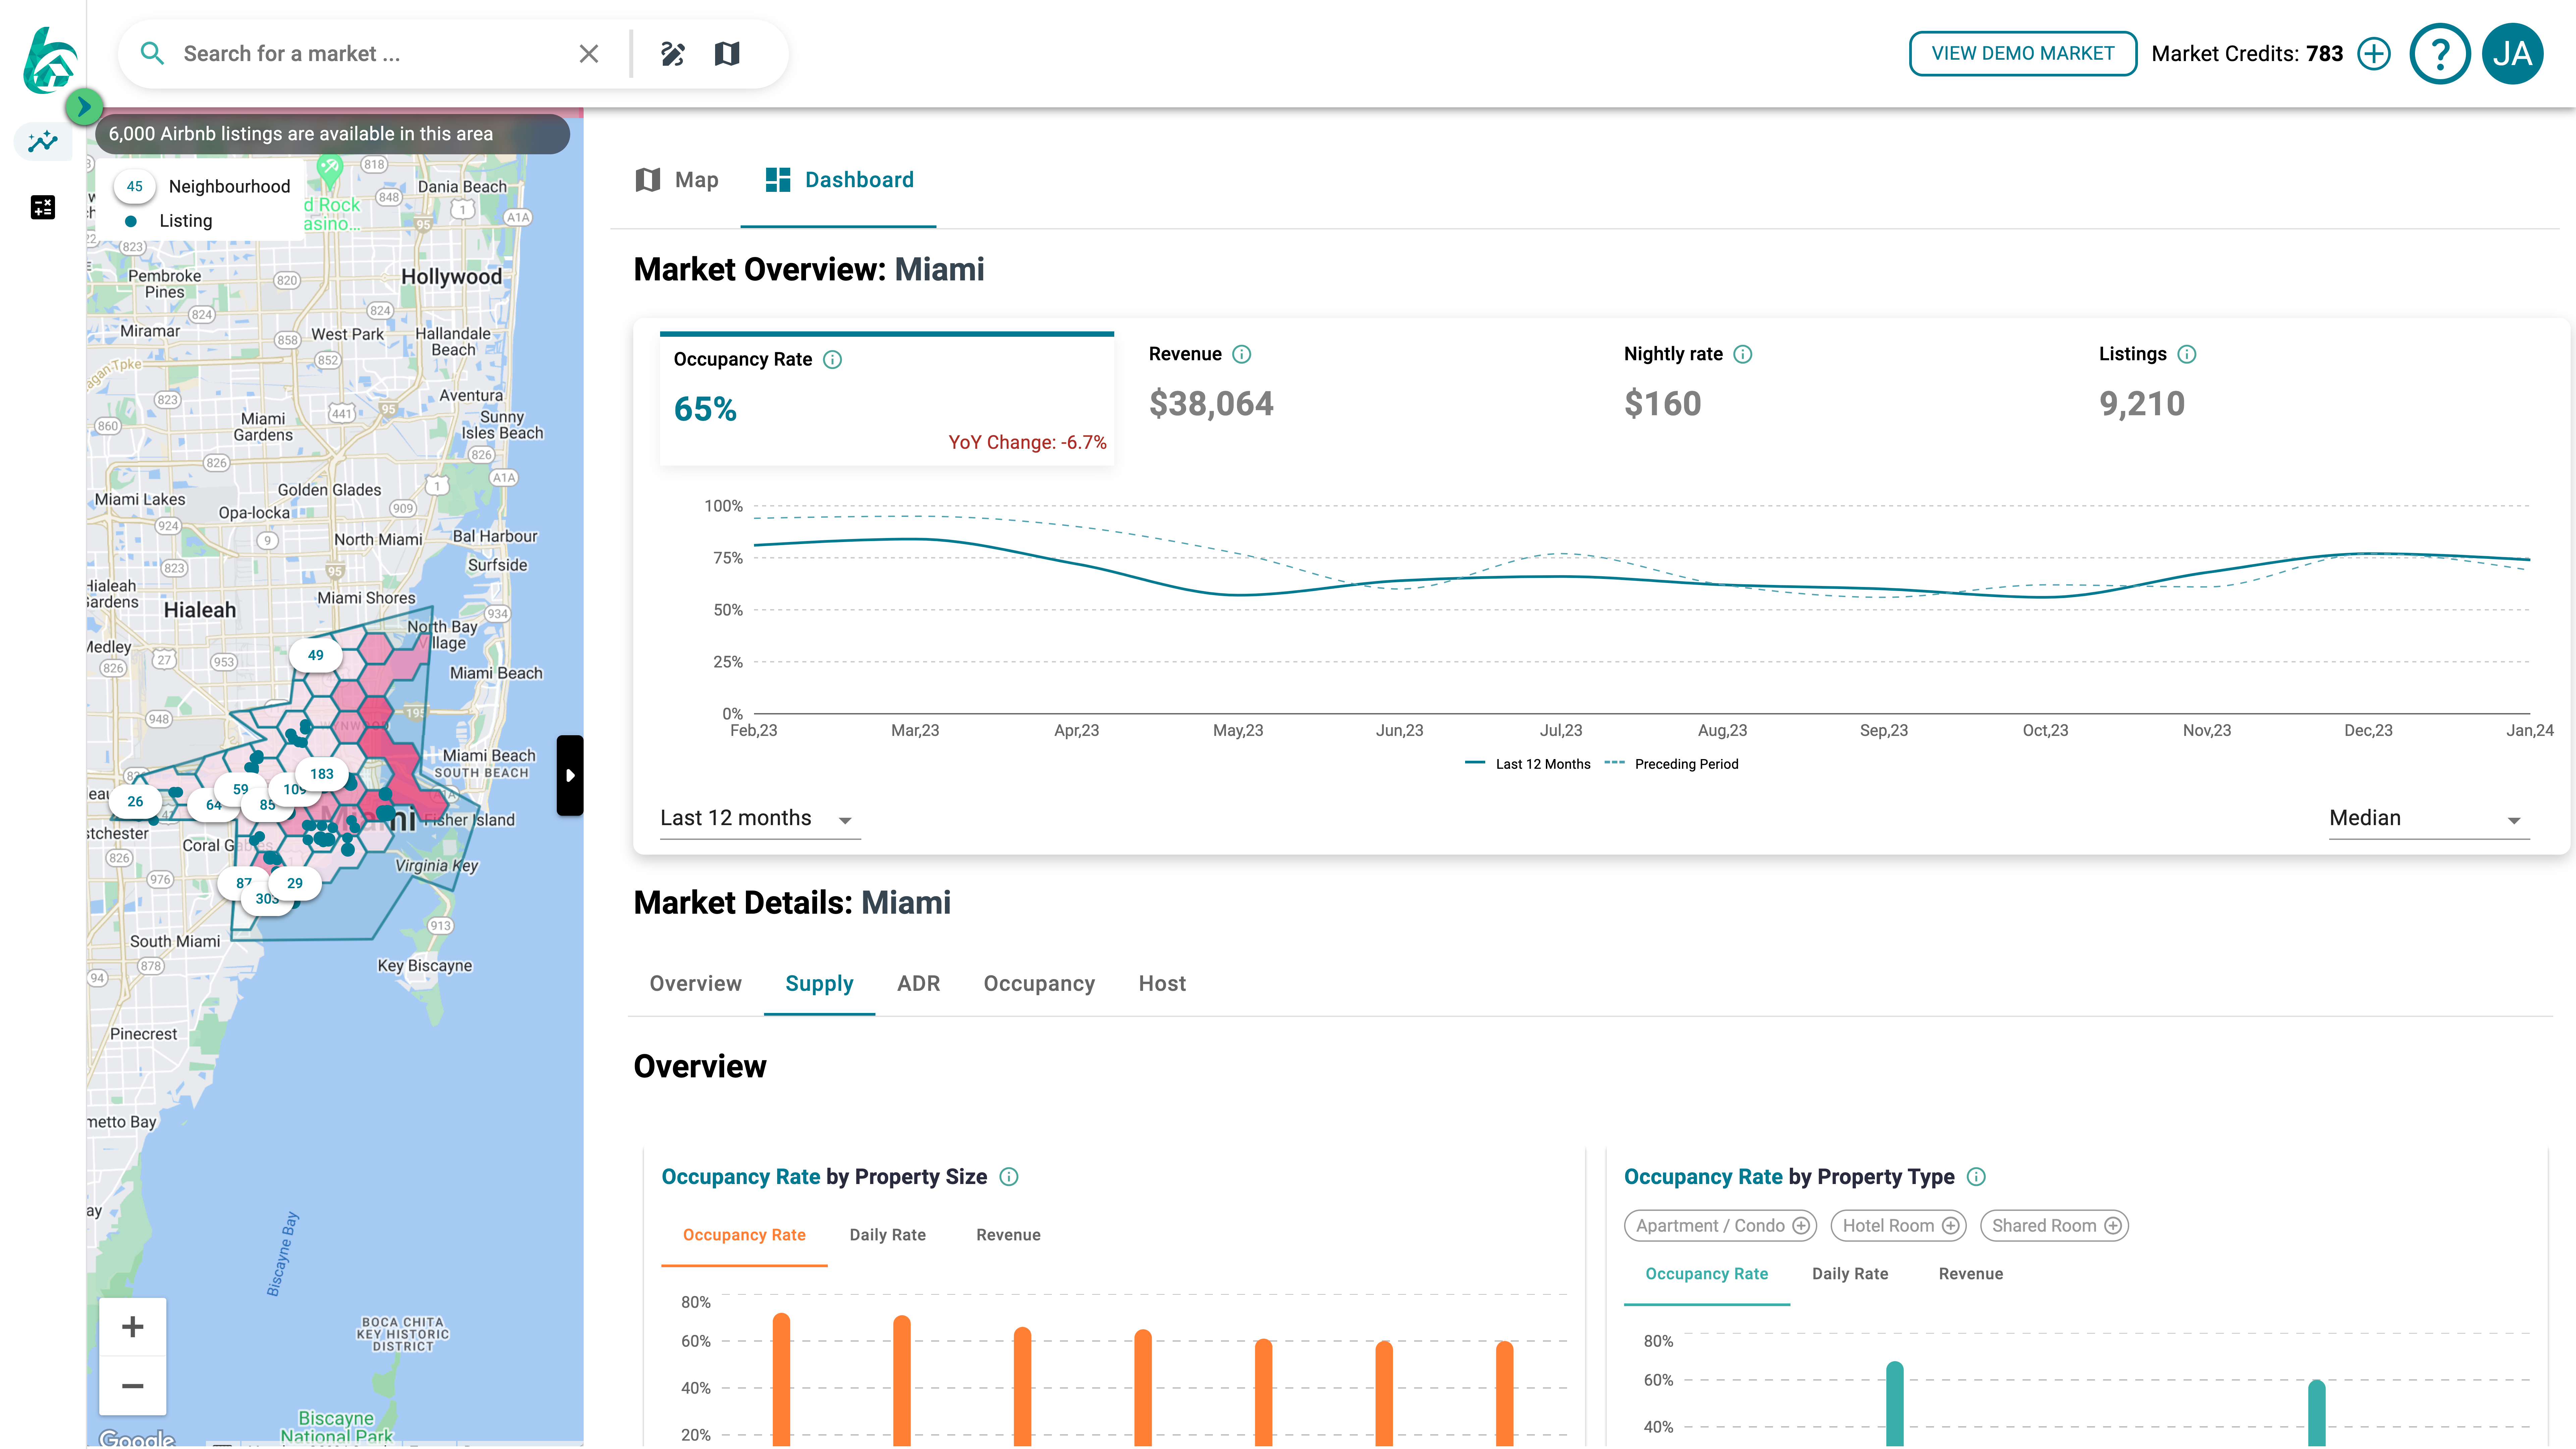
And here’s where it gets interesting – you can deep dive into the nitty-gritty of your chosen market. We’re talking key metrics like average yearly revenue, daily rates, and occupancy rates. Want to get granular? Break it down by property size, type, or even review rating score. And hey, ever wondered where those guests are traveling in from? We’ve got that covered too.
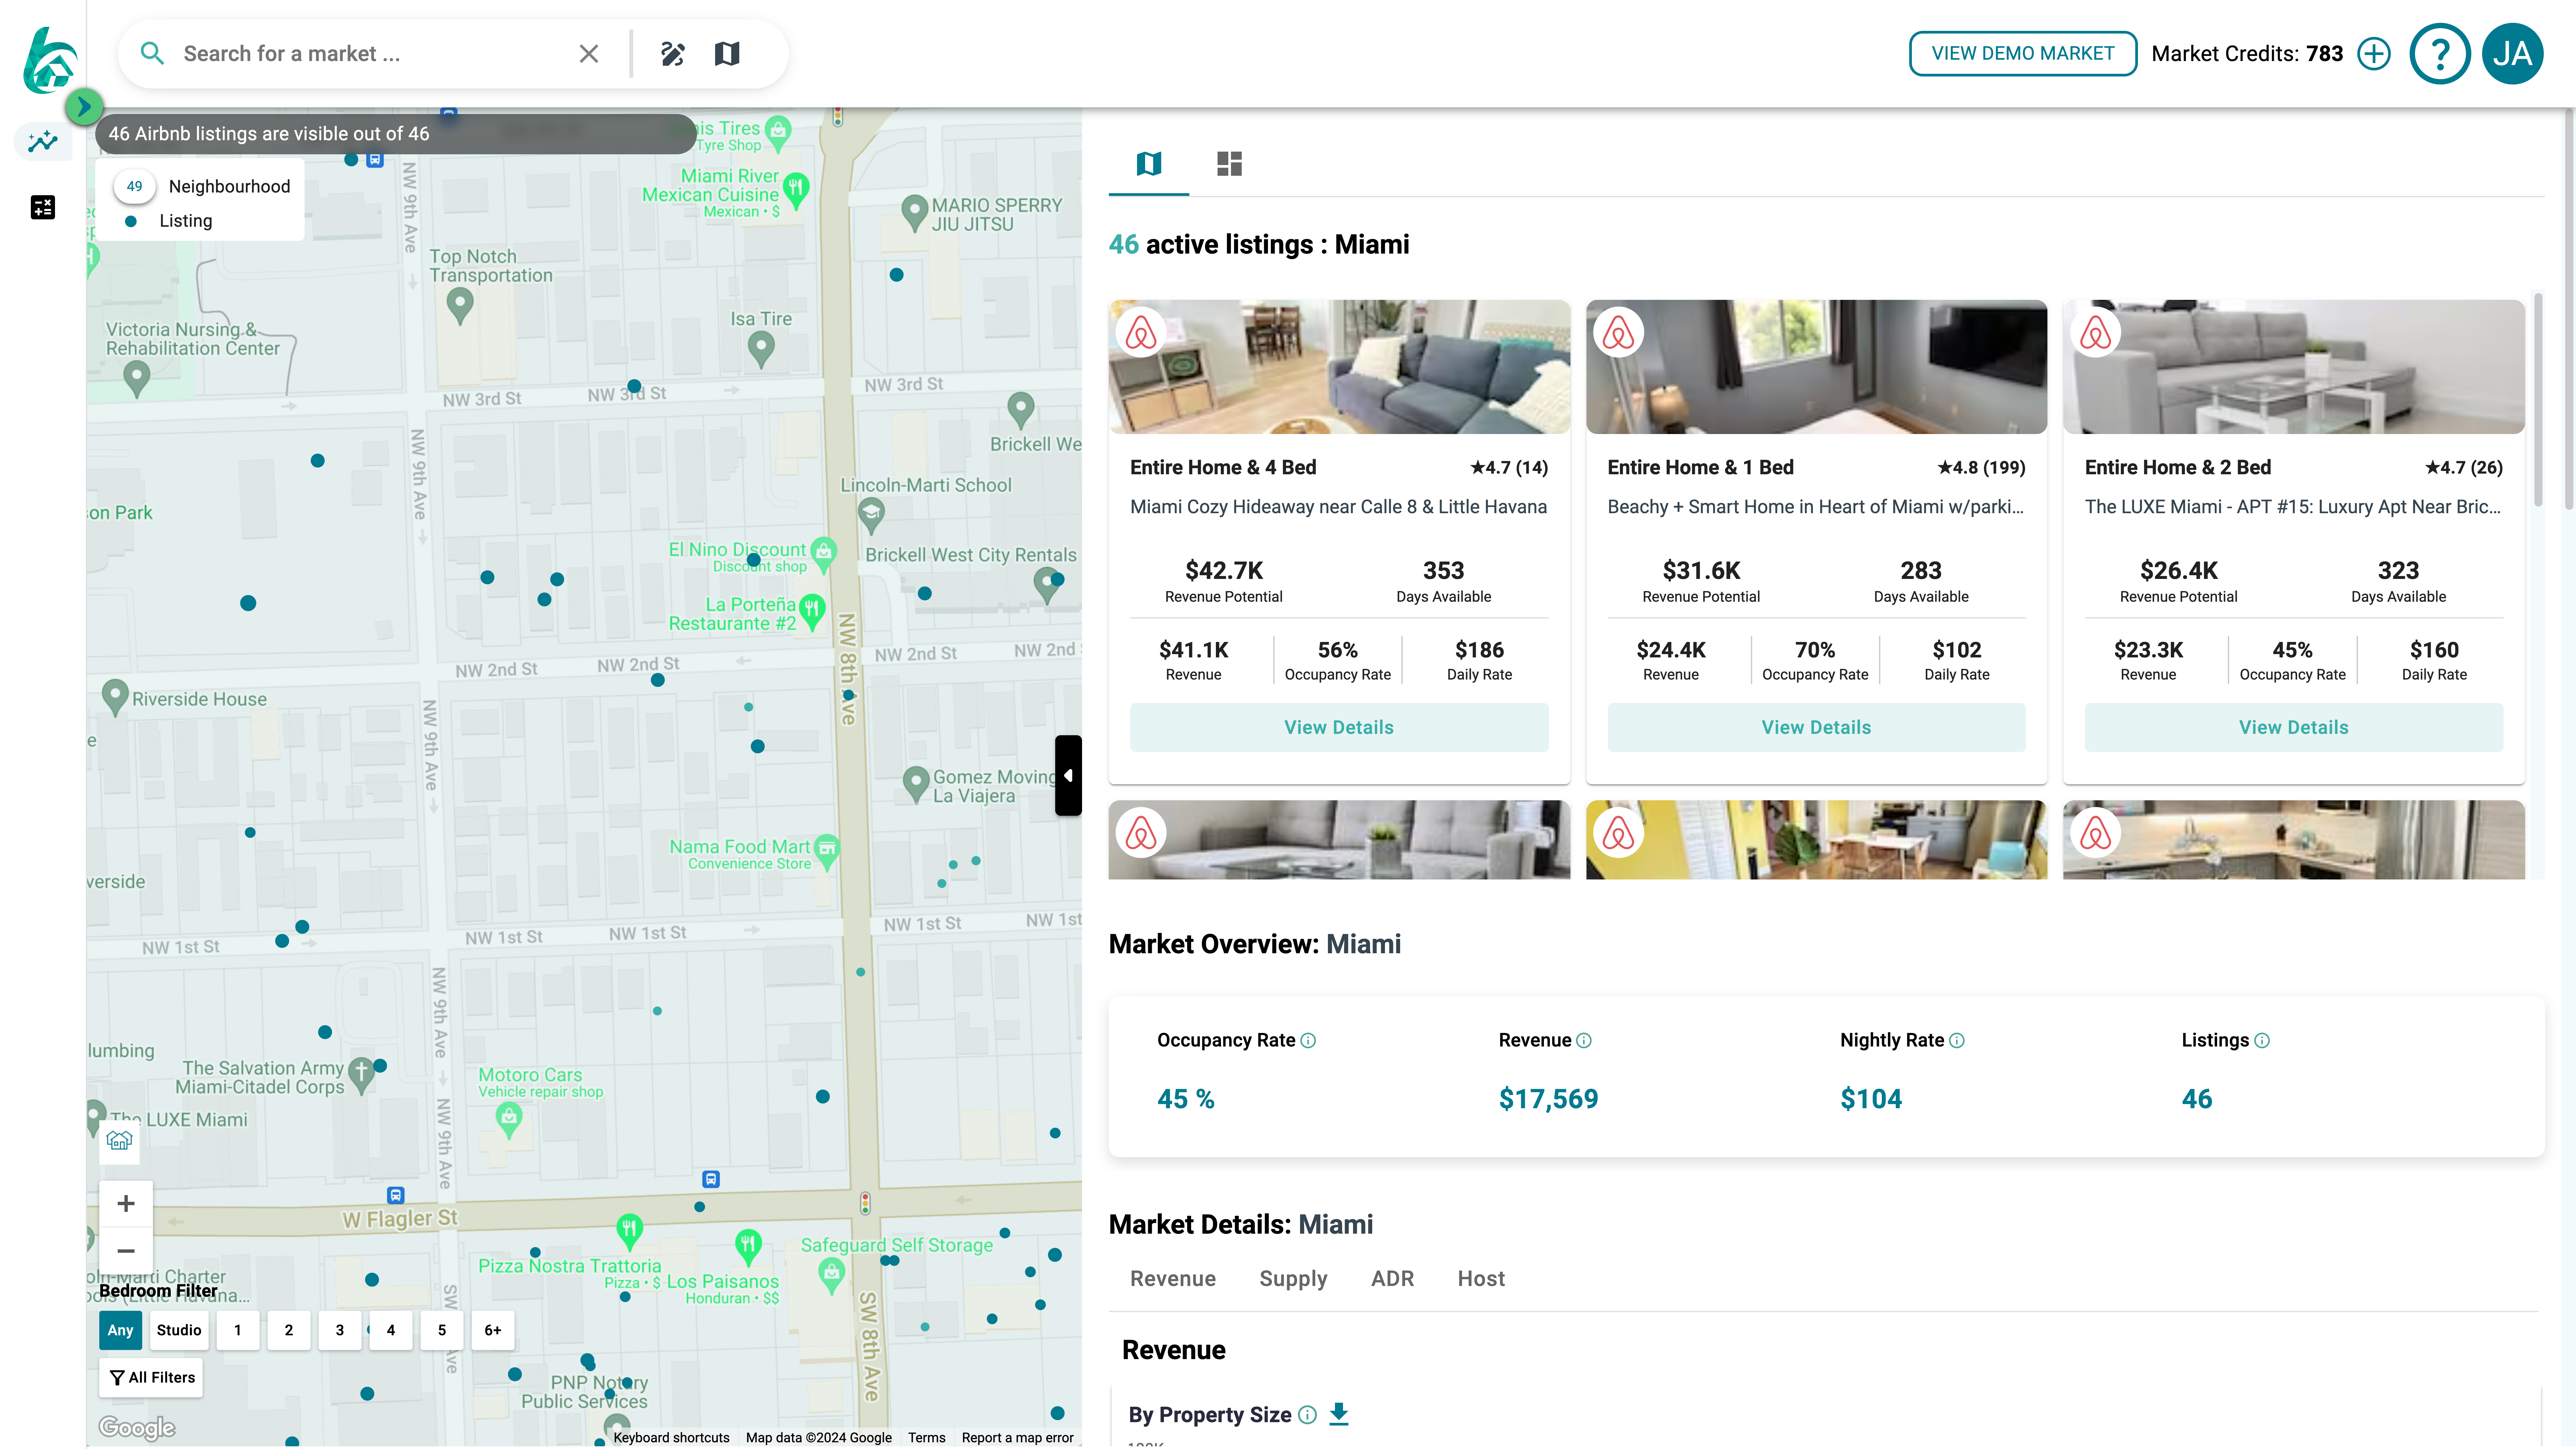
If it all checks out, hit that expand button on the map and witness the magic of the heatmap. Dark red? That’s the sweet spot – guests love that area. On the right, you can see top properties. These are the ones that are most popular among the guests in the specific neighborhoods. Pay attention to what types of properties are performing well. Want to know how much they raked in over the last twelve months? We’ve got the numbers.
Armed with this info, you’re now ready to hit up websites like Zillow or Redfin and start your property hunt. Let the treasure hunt begin!”
 Airbtics | Airbnb Analytics