What Is Occupancy Rate?
It is the percentage of nights booked among the available nights on an Airbnb listing. How can you find the average occupancy rate of your market?
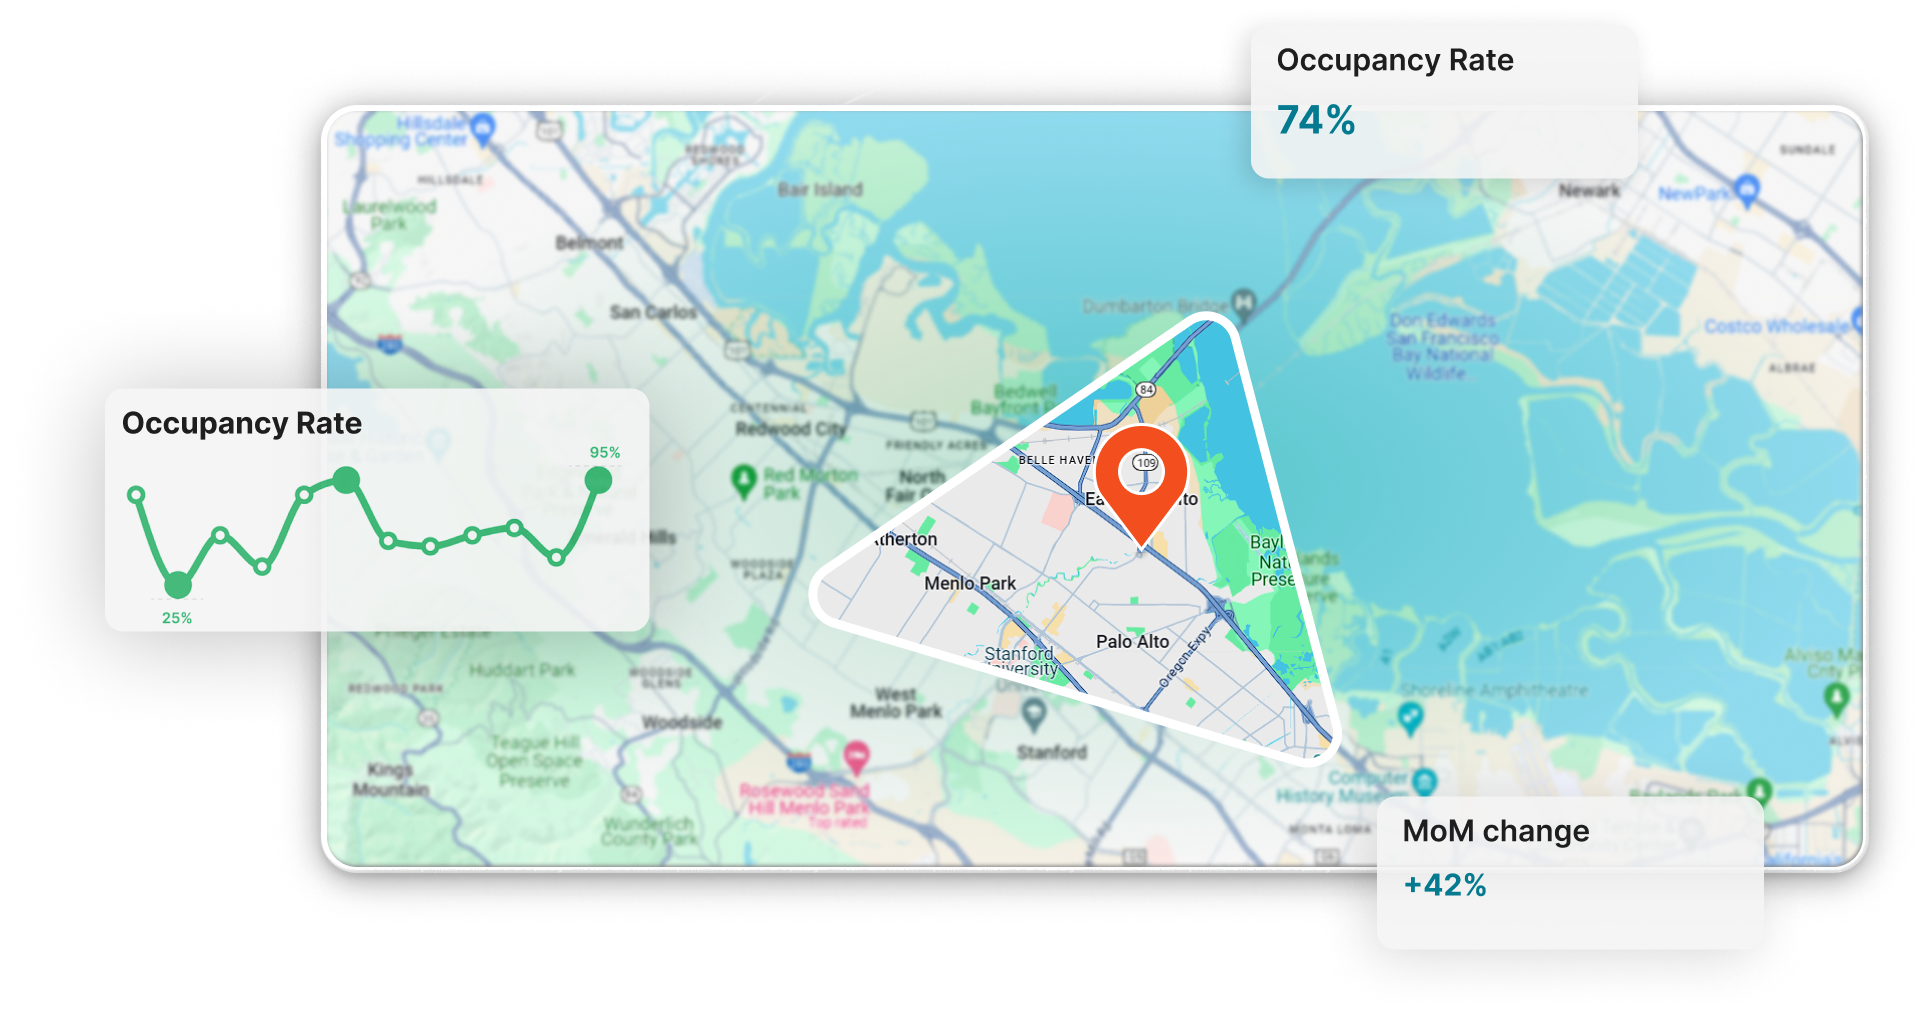
How to find Airbnb Occupancy Rates?
Simply enter an address above, and it'll show you the average occupancy rate of any address in the world for free! The average occupancy rate is calculated by 10–20 similar listings around the input addresses.
How does Airbtics collect this data?
As a short-term rental data company, we've been tracking Airbnb listing occupancy rates and bookings since 2019. This allows us to have comprehensive Airbnb statistics at listing level.
Those statistics includes:
- Average Length of Stay (ALOS)
- Average Daily Rate
- Revenue per bedroom
- Average Daily Rate (ADR)
- Guest Demographics
- Neighbourhood Analysis heatmap
- Average Airbnb Booking Rate
- Airbnb Vacancy Rates
- Airbnb Statistics by city
- Airbnb Occupancy Rate Map
The average occupancy rate by Country highlights profitability of short-term rentals across each country, primarily focus on active short-term rental listed on Airbnb.
We average data from 3 to 8 major cities using active airbnb listings to reflect market conditions.
The data is updated every 3-6 months to track market trends. For detailed occupancy rate by city, select your country of interest.
| Country Name | Occupancy Rate | Grade |
|---|---|---|
| Albania | 62% | Moderate |
| Argentina | 53% | Poor |
| Armenia | 62% | Moderate |
| Aruba | 76% | Excellent |
| Australia | 62% | Moderate |
| Austria | 73% | Good |
| Belgium | 62% | Moderate |
| Belize | 50% | Poor |
| Brazil | 42% | Poor |
| Bulgaria | 57% | Moderate |
| Canada | 60% | Moderate |
| Chile | 46% | Poor |
| Columbia | 38% | Poor |
| Costa rica | 57% | Moderate |
| Croatia | 71% | Good |
| Cuba | 51% | Poor |
| Cyprus | 63% | Moderate |
| Czechia | 74% | Good |
| Denmark | 66% | Good |
| Dominican republic | 50% | Poor |
| Ecuador | 42% | Poor |
| Egypt | 45% | Poor |
| Estonia | 67% | Good |
| Fiji | 62% | Moderate |
| Finland | 63% | Moderate |
| France | 55% | Moderate |
| Georgia | 58% | Moderate |
| Germany | 64% | Moderate |
| Greece | 72% | Good |
| Guatemala | 55% | Moderate |
| Hong kong | 65% | Good |
| Hungary | 76% | Excellent |
| Iceland | 76% | Excellent |
| India | 39% | Poor |
| Indonesia | 46% | Poor |
| Ireland | 76% | Excellent |
| Israel | 50% | Poor |
| Italy | 55% | Moderate |
| Japan | 64% | Moderate |
| Kazakhstan | 50% | Poor |
| Kenya | 47% | Poor |
| Latvia | 66% | Good |
| Luxembourg | 70% | Good |
| Madagascar | 46% | Poor |
| Malaysia | 43% | Poor |
| Malta | 84% | Excellent |
| Mexico | 41% | Poor |
| Mongolia | 49% | Poor |
| Montenegro | 59% | Moderate |
| Morocco | 52% | Poor |
| Namibia | 55% | Moderate |
| Nepal | 34% | Poor |
| Netherlands | 81% | Excellent |
| New zealand | 67% | Good |
| Nigeria | 45% | Poor |
| Norway | 65% | Good |
| Paraguay | 61% | Moderate |
| Peru | 38% | Poor |
| Philippines | 46% | Poor |
| Poland | 62% | Moderate |
| Portugal | 71% | Good |
| Puerto rico | 70% | Good |
| Romania | 56% | Moderate |
| Saint kitts and nevis | 50% | Poor |
| Saudi arabia | 38% | Poor |
| Serbia | 58% | Moderate |
| Singapore | 52% | Poor |
| South africa | 52% | Poor |
| South korea | 50% | Poor |
| Spain | 54% | Poor |
| Sweden | 61% | Moderate |
| Switzerland | 62% | Moderate |
| Taiwan | 45% | Poor |
| Tanzania | 44% | Poor |
| Thailand | 64% | Moderate |
| Trinidad and tobago | 42% | Poor |
| Tunisia | 53% | Poor |
| Turkey | 44% | Poor |
| Ukraine | 51% | Poor |
| United arab emirates | 65% | Good |
| The united kingdom | 61% | Moderate |
| The united states | 59% | Moderate |
| Uruguay | 56% | Moderate |
| Vietnam | 42% | Poor |
How to Calculate the Occupancy Rate of an Airbnb Property?
To determine the occupancy rate of a short-term rental property, you need to apply a simple formula to calculate the percentage.
Airbnb Occupancy Rate Formula
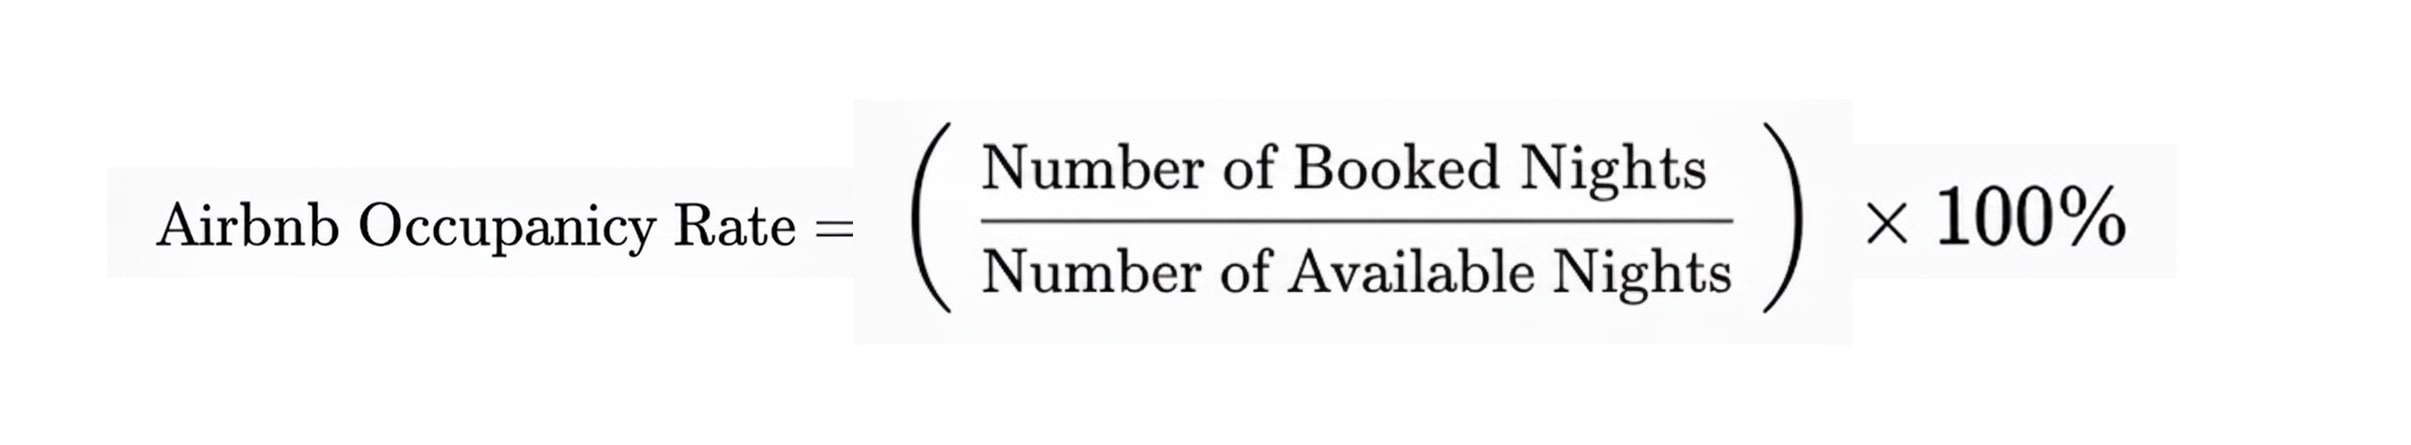
To calculate the Airbnb occupancy rate step by step, you need to:
1: Define the total number of days for which a listing was reserved.
2: Find out the total number of days for which it was available for rent.
3: Divide the number of days booked over the number of days available and multiply by 100 to get a percentage.
Airbnb Occupancy Rate Calculation Example
If a listing was listed for rent for 20 nights in a month and got booked for 15 days, the occupancy rate is:
While determining the occupancy rate of a single Airbnb property is easy as long as you have the necessary information, calculations get complicated if you want to calculate the average occupancy in a market. In this case, you need to resort to reliable tools that use trustworthy data - like the Airbtics Occupancy Rate Calculator - to eliminate manual work and reduce human error.
What Is Vacancy Rate?
The Airbnb vacancy rate is the opposite of the occupancy rate. The vacancy percentage shows the proportion of nights for which a listing is unbooked compared to the total number of nights for which it is made available for reservations.
High vacancy rates translate into lost revenue for hosts. That's why it's important to invest in a market with a low average vacancy rate and actively work on marketing and pricing your property in a way that boosts occupancy and minimizes vacancy.
How to Calculate Vacancy Rate for an Airbnb Rental
To determine the vacancy rate of a vacation rental property, you need to use a basic formula.
Airbnb Vacancy Rate Formula
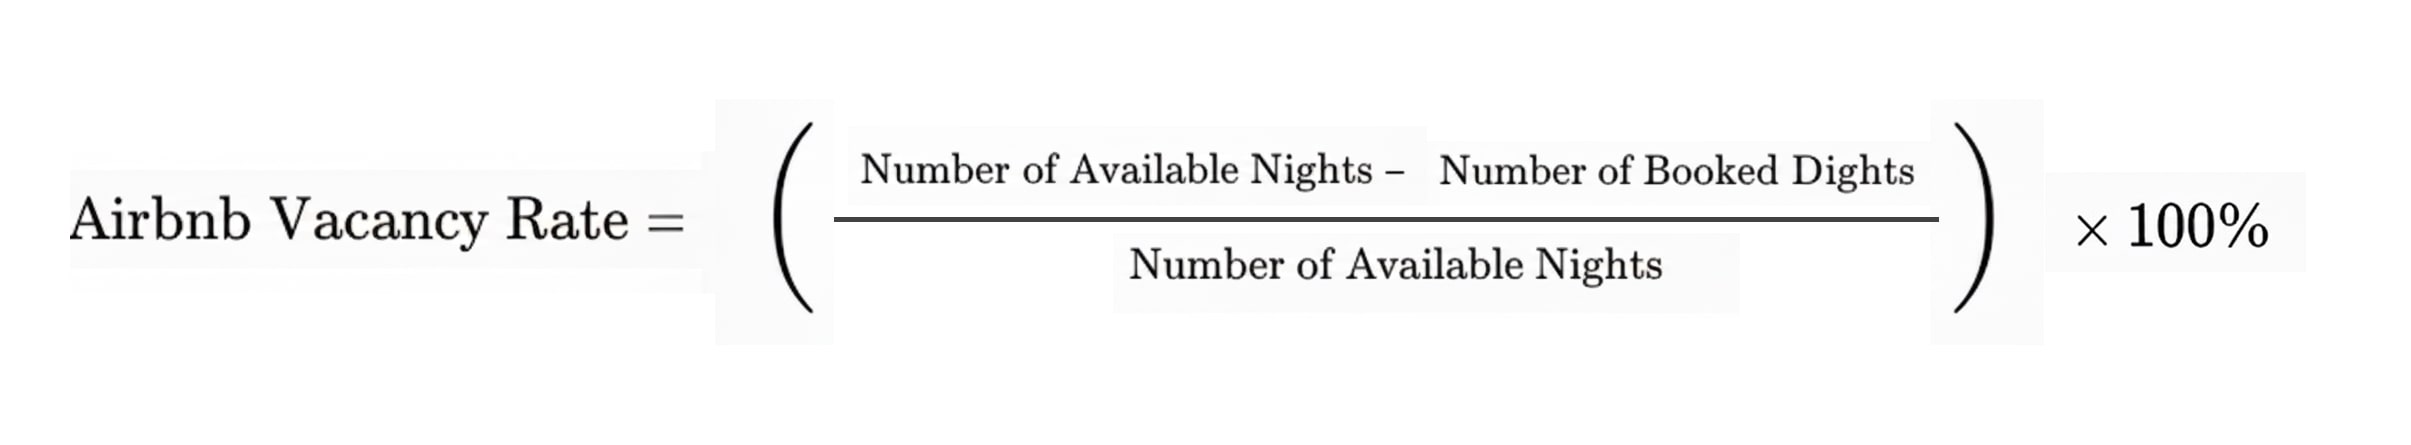
To calculate the vacancy rate step by step, you need to:
1: Determine the number of booked days.
2: Figure out the number of available days.
3: Subtract the number of booked days from the number of available days.
4: Divide the difference by the number of available days and multiply by 100 to get the vacancy percentage.
Airbnb Vacancy Rate Calculation Example
The property that was available for rent for 20 nights in a month and got booked for 15 nights has a vacancy rate of:
How to Find Airbnb Vacancy Rates with Airbtics
You can easily and quickly find the vacancy rate of any global market with the help of Airbtics. Just enter a location in the search bar above and subtract the readily available occupancy rate from 100% to get the vacancy rate percentage.
Note: For countries that don't have cities with more than 3,000 active Airbnb listings, we calculate the average occupancy rate using all available Airbnb listings across the country.