Based on Airbtics data from September 2025 to August 2026, this page ranks the best Airbnb markets in France by Market Grade.
The grade compares short-term rental yield, year-over-year revenue growth, and occupancy (demand), then adjusts for local regulation.
The table also shows listing count, average daily rate, and annual revenue for every market.
Markets on this page are ranked by the Airbtics Market Grade, not by the number of listings.
The grade compares each market with the other markets in this ranking on three measures, then adjusts for local short-term rental regulation.
Yield: Annual short-term rental revenue divided by property price. A higher yield ranks higher.
Growth: Year-over-year change in revenue. Faster revenue growth ranks higher.
Demand: Average occupancy rate over the last 12 months. Higher occupancy ranks higher.
Stricter short-term rental regulation lowers the letter grade. Occupancy, average daily rate, and annual revenue are shown for every market.
Exact yield and revenue growth are published for the three highest-graded markets. For every other market those two figures are in Market Explorer.
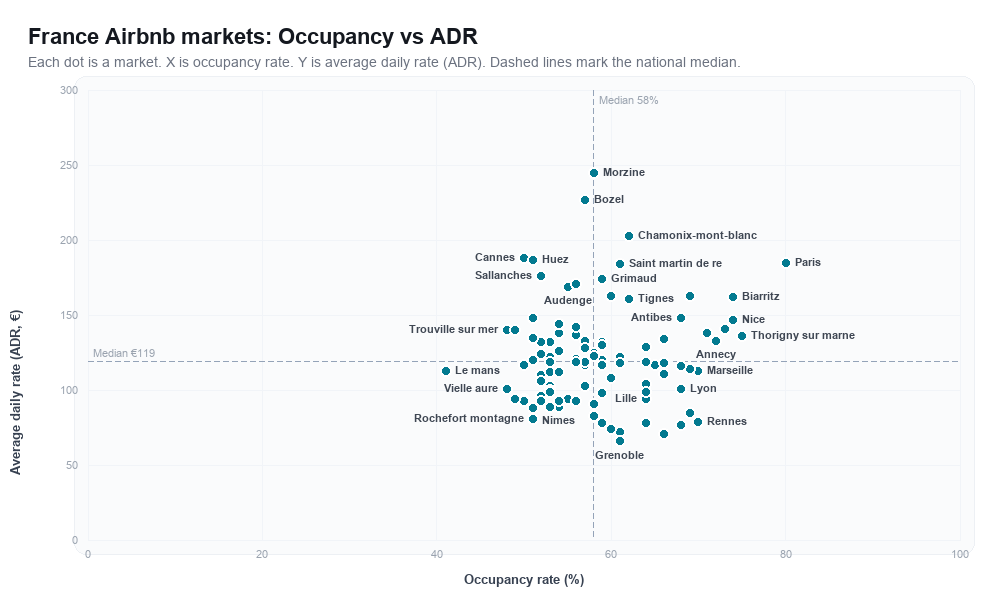
The rankboard plots the same markets by occupancy and average daily rate, and the table under the chart lists those values in text.
Find the Best Airbnb Markets with Our Interactive Tool
Use our interactive Market Explorer to find the best places to start an Airbnb in France. Compare multiple markets side by side, apply filters like regulations, budget (property or rent prices), and market size, and even export the results to Excel.
The highest-graded short-term rental markets in France are Moutiers, Sallanches and Thorigny Sur Marne.
The table ranks every tracked market by Airbtics Market Grade. Occupancy, average daily rate, annual revenue, yield, and revenue growth are the figures behind that grade.
Top 3 Airbnb markets in France by Market Grade
These are the three highest-graded Airbnb markets in France. Market Grade compares yield, revenue growth, and occupancy (demand) with the other markets on this page, then adjusts for short-term rental regulation. The chart repeats those three percentiles in text so the ranking is readable without the graphic.
Moutiers is rank 1 of 100 markets in this France ranking by Airbtics Market Grade A, with 23.5% short-term rental yield, 56.0% occupancy, and +12.1% year-over-year revenue growth.
Compared with the other markets on this page, Moutiers ranks top 1% for yield, top 6% for growth, and lowest 41% for demand. The market shows an average daily rate of €164, annual revenue of €34,242, a rent gap of 4872.8%, 2,272 active listings, lenient short-term rental regulation, and a typical 2-bedroom property price of €160,578.
Market gradeA
Yield23.5%
Revenue growth+12.1%
Occupancy56.0%
Average daily rate€164
Annual revenue€34,242
Rent gap4872.8%
Active listings2,272
2-bedroom price€160,578
RegulationLenient
Percentile versus other France markets on this page. Farther from the center is stronger.
Sallanches is rank 2 of 100 markets in this France ranking by Airbtics Market Grade A, with 13.7% short-term rental yield, 52.0% occupancy, and +10.5% year-over-year revenue growth.
Compared with the other markets on this page, Sallanches ranks top 14% for yield, top 12% for growth, and lowest 18% for demand. The market shows an average daily rate of €169, annual revenue of €33,209, a rent gap of 3334.3%, 2,242 active listings, lenient short-term rental regulation, and a typical 2-bedroom property price of €267,630.
Market gradeA
Yield13.7%
Revenue growth+10.5%
Occupancy52.0%
Average daily rate€169
Annual revenue€33,209
Rent gap3334.3%
Active listings2,242
2-bedroom price€267,630
RegulationLenient
Percentile versus other France markets on this page. Farther from the center is stronger.
Thorigny Sur Marne is rank 3 of 100 markets in this France ranking by Airbtics Market Grade A, with 18.7% short-term rental yield, 75.0% occupancy, and +20.2% year-over-year revenue growth.
Compared with the other markets on this page, Thorigny Sur Marne ranks top 2% for yield, top 1% for growth, and top 2% for demand. The market shows an average daily rate of €131, annual revenue of €37,397, a rent gap of 4268.4%, 1,636 active listings, strict short-term rental regulation, and a typical 2-bedroom property price of €249,788.
Market gradeA
Yield18.7%
Revenue growth+20.2%
Occupancy75.0%
Average daily rate€131
Annual revenue€37,397
Rent gap4268.4%
Active listings1,636
2-bedroom price€249,788
RegulationStrict
Percentile versus other France markets on this page. Farther from the center is stronger.
Yield: top 2%
Growth: top 1%
Demand: top 2%
Market Rankboard: France
Each dot is a vacation rental market in France, plotted by
occupancy rate (x-axis) and average daily rate (ADR) (y-axis).
Dashed lines mark the national median.
Occupancy rate and average daily rate for each France market plotted in the chart above, in Market Grade order.
Market
Occupancy rate
Average daily rate
Moutiers
56.0%
€164
Sallanches
52.0%
€169
Thorigny Sur Marne
75.0%
€131
Saillagouse
51.0%
€115
Paris
80.0%
€177
Marseille
70.0%
€108
Porto-Vecchio
69.0%
€157
Ollioules
58.0%
€118
Annecy
72.0%
€128
Coursan
50.0%
€90
Castelnau De Medoc
53.0%
€127
Calvi
66.0%
€129
Huez
51.0%
€180
Guillestre
53.0%
€114
Baie de Somme
54.0%
€121
Bozel
57.0%
€218
Saint-Denis
66.0%
€107
Strasbourg
69.0%
€109
Aime
56.0%
€132
Rennes
70.0%
€75
Colmar
64.0%
€124
Saulxures Sur Moselotte
51.0%
€130
Extended Grand Paris
73.0%
€135
Lyon
68.0%
€97
Toulouse
68.0%
€74
Bordeaux
69.0%
€109
La Teste-De-Buch
54.0%
€132
Audenge
55.0%
€162
Saint pierre d'oléron
58.0%
€120
La Rochelle
64.0%
€99
Aix-en-Provence
68.0%
€111
Nantes
64.0%
€74
Aigues Mortes
53.0%
€96
Ajaccio
65.0%
€112
Rouen
61.0%
€69
La Baule-Escoublac
53.0%
€117
Saint Gervais Les Bains
56.0%
€116
Collobrieres
57.0%
€115
Morzine
58.0%
€235
Sigean
49.0%
€90
La Ciotat
64.0%
€115
Sarlat La Caneda
56.0%
€114
Tours
60.0%
€71
Lac de Sainte-Croix
64.0%
€95
Antibes
68.0%
€142
Soustons
57.0%
€128
Le Mans
41.0%
€108
Montpellier
69.0%
€82
Trouville Sur Mer
48.0%
€134
Lille
64.0%
€90
Saint Vincent De Tyrosse
59.0%
€126
Arles
57.0%
€112
Reims
58.0%
€80
Saint-Malo
66.0%
€113
Rochefort Montagne
51.0%
€78
Perros Guirec
60.0%
€104
Saint Martin De Re
61.0%
€176
Gerardmer
52.0%
€127
Bourg-Saint-Maurice
60.0%
€157
Cabourg
50.0%
€112
Saint Jean De Maurienne
53.0%
€95
Angers
66.0%
€68
Anglet
71.0%
€132
Biarritz
74.0%
€156
Noirmoutier
56.0%
€136
Creuse
51.0%
€84
Carcassonne
53.0%
€85
Cannes
50.0%
€181
Agde
52.0%
€92
Grimaud
59.0%
€167
Thones
51.0%
€142
Les Sables D’Olonne
52.0%
€106
Parentis En Born
53.0%
€107
Canet En Roussillon
56.0%
€89
Nimes
54.0%
€85
Nice
74.0%
€141
Frejus
59.0%
€115
Chamonix-Mont-Blanc
62.0%
€195
Arcachon
54.0%
€138
Avignon
59.0%
€94
Saint-Raphael
61.0%
€117
Mauguio
55.0%
€90
Hyeres
59.0%
€112
Sete
57.0%
€99
Quiberon
61.0%
€113
Grenoble
61.0%
€64
Dijon
59.0%
€74
Saint Laurent De La Salanque
50.0%
€90
Vielle Aure
48.0%
€97
Montreuil
49.0%
€134
Dinard
57.0%
€123
Capbreton
59.0%
€124
Tignes
62.0%
€155
Talmont Saint Hilaire
52.0%
€102
Narbonne
54.0%
€89
Sarzeau
52.0%
€119
Saint Gilles Croix De Vie
53.0%
€99
Toulon
58.0%
€87
Argeles Sur Mer
52.0%
€89
Mimizan
54.0%
€107
Compare property prices, short-term rental yield, rent gap, annual revenue, and supply growth in the
Airbtics Market Explorer watchlist.
See all Airbnb markets in France
Browse all 100 markets we track in France. Each link opens the market's Airbnb revenue and performance data page.
Airbtics ranks short-term rental markets in France by Market Grade. The grade compares yield (annual revenue divided by property price), year-over-year revenue growth, and occupancy, then adjusts for regulation. The highest-graded market in this dataset is Moutiers. The main table lists markets in that order; use the Market Explorer to filter by budget, regulations, and more.
How many Airbnb markets does Airbtics track in France?
We currently analyze 100 active short-term rental markets in France with listing supply, median occupancy, ADR, and revenue estimates.
What is the average Airbnb occupancy rate in France?
The national average occupancy rate across tracked markets is 58.73% (LTM). Rates differ by city. Use the rankboard on this page, or open a market page for that city's numbers.
How do I compare Airbnb markets in France?
Use the occupancy vs ADR rankboard on this page for a quick view, or open the Market Explorer to compare markets side by side, change chart axes, export to Excel, and save markets to a watchlist.
How can I estimate Airbnb income in France?
Use our Airbnb income calculator to estimate revenue for a specific address, or open any market link below for median revenue and occupancy benchmarks.