Based on Airbtics data from September 2025 to August 2026, this page ranks the best Airbnb markets in Brazil by Market Grade.
The grade compares short-term rental yield, year-over-year revenue growth, and occupancy (demand), then adjusts for local regulation.
The table also shows listing count, average daily rate, and annual revenue for every market.
Markets on this page are ranked by the Airbtics Market Grade, not by the number of listings.
The grade compares each market with the other markets in this ranking on three measures, then adjusts for local short-term rental regulation.
Yield: Annual short-term rental revenue divided by property price. A higher yield ranks higher.
Growth: Year-over-year change in revenue. Faster revenue growth ranks higher.
Demand: Average occupancy rate over the last 12 months. Higher occupancy ranks higher.
Stricter short-term rental regulation lowers the letter grade. Occupancy, average daily rate, and annual revenue are shown for every market.
Exact yield and revenue growth are published for the three highest-graded markets. For every other market those two figures are in Market Explorer.
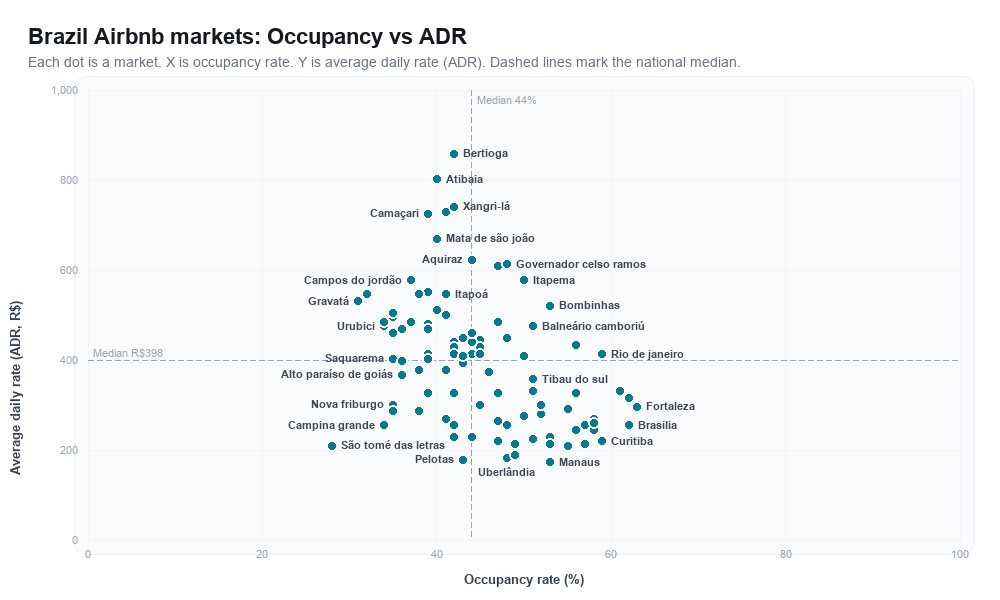
The rankboard plots the same markets by occupancy and average daily rate, and the table under the chart lists those values in text.
Find the Best Airbnb Markets with Our Interactive Tool
Use our interactive Market Explorer to find the best places to start an Airbnb in Brazil. Compare multiple markets side by side, apply filters like regulations, budget (property or rent prices), and market size, and even export the results to Excel.
The highest-graded short-term rental markets in Brazil are Capão Da Canoa, Matinhos and Mata De São João.
The table ranks every tracked market by Airbtics Market Grade. Occupancy, average daily rate, annual revenue, yield, and revenue growth are the figures behind that grade.
Top 3 Airbnb markets in Brazil by Market Grade
These are the three highest-graded Airbnb markets in Brazil. Market Grade compares yield, revenue growth, and occupancy (demand) with the other markets on this page, then adjusts for short-term rental regulation. The chart repeats those three percentiles in text so the ranking is readable without the graphic.
Capão Da Canoa is rank 1 of 100 markets in this Brazil ranking by Airbtics Market Grade A, with 18.8% short-term rental yield, 43.0% occupancy, and +28.4% year-over-year revenue growth.
Compared with the other markets on this page, Capão Da Canoa ranks top 14% for yield, top 16% for growth, and lowest 46% for demand. The market shows an average daily rate of R$443, annual revenue of R$71,064, a rent gap of 3666.2%, 2,653 active listings, lenient short-term rental regulation, and a typical 2-bedroom property price of R$403,200.
Market gradeA
Yield18.8%
Revenue growth+28.4%
Occupancy43.0%
Average daily rateR$443
Annual revenueR$71,064
Rent gap3666.2%
Active listings2,653
2-bedroom priceR$403,200
RegulationLenient
Percentile versus other Brazil markets on this page. Farther from the center is stronger.
Matinhos is rank 2 of 100 markets in this Brazil ranking by Airbtics Market Grade A, with 19.0% short-term rental yield, 41.0% occupancy, and +27.3% year-over-year revenue growth.
Compared with the other markets on this page, Matinhos ranks top 12% for yield, top 22% for growth, and lowest 32% for demand. The market shows an average daily rate of R$493, annual revenue of R$75,630, a rent gap of 3962.0%, 2,067 active listings, lenient short-term rental regulation, and a typical 2-bedroom property price of R$378,000.
Market gradeA
Yield19.0%
Revenue growth+27.3%
Occupancy41.0%
Average daily rateR$493
Annual revenueR$75,630
Rent gap3962.0%
Active listings2,067
2-bedroom priceR$378,000
RegulationLenient
Percentile versus other Brazil markets on this page. Farther from the center is stronger.
Mata De São João is rank 3 of 100 markets in this Brazil ranking by Airbtics Market Grade A, with 22.4% short-term rental yield, 40.0% occupancy, and +28.2% year-over-year revenue growth.
Compared with the other markets on this page, Mata De São João ranks top 4% for yield, top 18% for growth, and lowest 28% for demand. The market shows an average daily rate of R$660, annual revenue of R$98,491, a rent gap of 3880.0%, 1,788 active listings, lenient short-term rental regulation, and a typical 2-bedroom property price of R$403,200.
Market gradeA
Yield22.4%
Revenue growth+28.2%
Occupancy40.0%
Average daily rateR$660
Annual revenueR$98,491
Rent gap3880.0%
Active listings1,788
2-bedroom priceR$403,200
RegulationLenient
Percentile versus other Brazil markets on this page. Farther from the center is stronger.
Yield: top 4%
Growth: top 18%
Demand: lowest 28%
Market Rankboard: Brazil
Each dot is a vacation rental market in Brazil, plotted by
occupancy rate (x-axis) and average daily rate (ADR) (y-axis).
Dashed lines mark the national median.
Occupancy rate and average daily rate for each Brazil market plotted in the chart above, in Market Grade order.
Market
Occupancy rate
Average daily rate
Capão Da Canoa
43.0%
R$443
Matinhos
41.0%
R$493
Mata De São João
40.0%
R$660
Tibau Do Sul
51.0%
R$352
Itapoá
41.0%
R$539
Rio De Janeiro
59.0%
R$408
Bombinhas
53.0%
R$514
Ipojuca
50.0%
R$403
Gramado
48.0%
R$443
Caraguatatuba
39.0%
R$408
Belém
45.0%
R$297
Vila Velha
56.0%
R$322
Natal
57.0%
R$211
Governador Celso Ramos
48.0%
R$604
Torres
45.0%
R$408
Aquiraz
44.0%
R$614
Balneário Piçarras
44.0%
R$453
São José Dos Campos
50.0%
R$272
Socorro
38.0%
R$539
Fortaleza
63.0%
R$292
Maceió
62.0%
R$312
Foz do Iguacu
55.0%
R$287
Imbituba
43.0%
R$388
Palhoça
45.0%
R$423
Camaçari
39.0%
R$715
Itanhaém
35.0%
R$453
Peruíbe
35.0%
R$488
Pontal Do Paraná
39.0%
R$463
Itacaré
52.0%
R$297
Tramandaí
42.0%
R$322
Xangri-Lá
42.0%
R$730
Ubatuba
44.0%
R$408
Guarujá
39.0%
R$473
Salvador de Bahia
52.0%
R$277
João Pessoa
57.0%
R$252
Goiânia
48.0%
R$252
Recife
58.0%
R$241
Recife
58.0%
R$241
Itapema
50.0%
R$569
Ilhabela
42.0%
R$433
Campinas
53.0%
R$211
Olímpia
42.0%
R$423
Alto Paraíso De Goiás
36.0%
R$362
Saquarema
35.0%
R$398
Tamandaré
40.0%
R$504
Urubici
34.0%
R$468
Vitoria
58.0%
R$257
Rio Das Ostras
35.0%
R$282
Londrina
55.0%
R$206
Barreirinhas
42.0%
R$408
Gravatá
31.0%
R$524
Florianpolis
56.0%
R$428
Cabo Frio
43.0%
R$388
São Sebastião
41.0%
R$720
Bertioga
42.0%
R$846
Porto Seguro
45.0%
R$438
Caldas Novas
41.0%
R$267
Guarapari
43.0%
R$403
Santos
47.0%
R$322
Garopaba
47.0%
R$478
Ribeirão Preto
44.0%
R$226
Aracaju
47.0%
R$262
Blumenau
42.0%
R$252
Canela
41.0%
R$372
Barra
61.0%
R$327
São Luís
51.0%
R$221
Salinópolis
34.0%
R$478
Ilhéus
39.0%
R$398
Maraú
39.0%
R$544
Camanducaia
37.0%
R$478
Tiradentes
36.0%
R$393
Atibaia
40.0%
R$791
Sao Paulo
58.0%
R$267
Brasilia
62.0%
R$252
Armação Dos Búzios
47.0%
R$599
Paraty
38.0%
R$372
Pirenópolis
32.0%
R$539
Uberlândia
48.0%
R$181
Cuiabá
49.0%
R$211
CAMPO GRANDE
49.0%
R$186
São Tomé Das Letras
28.0%
R$206
Pelotas
43.0%
R$176
Pocos de Caldas
42.0%
R$226
Praia Grande
39.0%
R$322
Curitiba
59.0%
R$216
Balneário Camboriú
51.0%
R$468
Campos Do Jordão
37.0%
R$569
Belo Horizonte
56.0%
R$241
Porto Alegre
53.0%
R$226
Arraial Do Cabo
46.0%
R$367
Angra Dos Reis
44.0%
R$433
Petrópolis
36.0%
R$463
Nova Friburgo
35.0%
R$297
Manaus
53.0%
R$171
Joinville
47.0%
R$216
Niterói
51.0%
R$327
Ouro Preto
38.0%
R$282
Campina Grande
34.0%
R$252
Domingos Martins
35.0%
R$498
Maragogi
43.0%
R$403
Compare property prices, short-term rental yield, rent gap, annual revenue, and supply growth in the
Airbtics Market Explorer watchlist.
See all Airbnb markets in Brazil
Browse all 100 markets we track in Brazil. Each link opens the market's Airbnb revenue and performance data page.
Airbtics ranks short-term rental markets in Brazil by Market Grade. The grade compares yield (annual revenue divided by property price), year-over-year revenue growth, and occupancy, then adjusts for regulation. The highest-graded market in this dataset is Capão Da Canoa. The main table lists markets in that order; use the Market Explorer to filter by budget, regulations, and more.
How many Airbnb markets does Airbtics track in Brazil?
We currently analyze 100 active short-term rental markets in Brazil with listing supply, median occupancy, ADR, and revenue estimates.
What is the average Airbnb occupancy rate in Brazil?
The national average occupancy rate across tracked markets is 45.22% (LTM). Rates differ by city. Use the rankboard on this page, or open a market page for that city's numbers.
How do I compare Airbnb markets in Brazil?
Use the occupancy vs ADR rankboard on this page for a quick view, or open the Market Explorer to compare markets side by side, change chart axes, export to Excel, and save markets to a watchlist.
How can I estimate Airbnb income in Brazil?
Use our Airbnb income calculator to estimate revenue for a specific address, or open any market link below for median revenue and occupancy benchmarks.