Based on Airbtics data from September 2025 to August 2026, this page ranks the best Airbnb markets in Spain by Market Grade.
The grade compares short-term rental yield, year-over-year revenue growth, and occupancy (demand), then adjusts for local regulation.
The table also shows listing count, average daily rate, and annual revenue for every market.
Markets on this page are ranked by the Airbtics Market Grade, not by the number of listings.
The grade compares each market with the other markets in this ranking on three measures, then adjusts for local short-term rental regulation.
Yield: Annual short-term rental revenue divided by property price. A higher yield ranks higher.
Growth: Year-over-year change in revenue. Faster revenue growth ranks higher.
Demand: Average occupancy rate over the last 12 months. Higher occupancy ranks higher.
Stricter short-term rental regulation lowers the letter grade. Occupancy, average daily rate, and annual revenue are shown for every market.
Exact yield and revenue growth are published for the three highest-graded markets. For every other market those two figures are in Market Explorer.
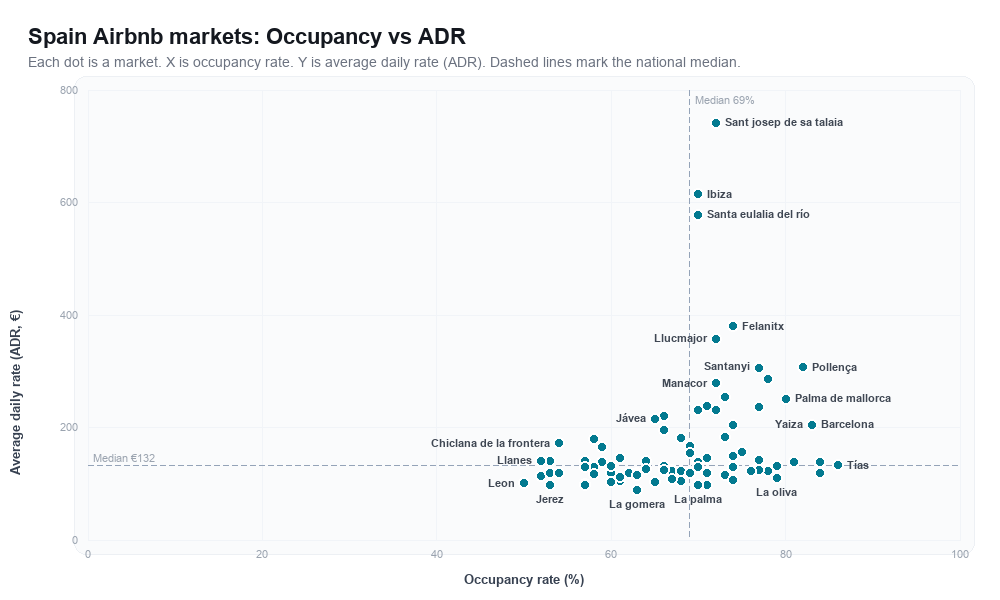
The rankboard plots the same markets by occupancy and average daily rate, and the table under the chart lists those values in text.
Find the Best Airbnb Markets with Our Interactive Tool
Use our interactive Market Explorer to find the best places to start an Airbnb in Spain. Compare multiple markets side by side, apply filters like regulations, budget (property or rent prices), and market size, and even export the results to Excel.
The highest-graded short-term rental markets in Spain are Elche, Zaragoza and Toledo.
The table ranks every tracked market by Airbtics Market Grade. Occupancy, average daily rate, annual revenue, yield, and revenue growth are the figures behind that grade.
Top 3 Airbnb markets in Spain by Market Grade
These are the three highest-graded Airbnb markets in Spain. Market Grade compares yield, revenue growth, and occupancy (demand) with the other markets on this page, then adjusts for short-term rental regulation. The chart repeats those three percentiles in text so the ranking is readable without the graphic.
Elche is rank 1 of 91 markets in this Spain ranking by Airbtics Market Grade A, with 20.9% short-term rental yield, 66.0% occupancy, and +12.4% year-over-year revenue growth.
Compared with the other markets on this page, Elche ranks top 17% for yield, top 16% for growth, and lowest 39% for demand. The market shows an average daily rate of €127, annual revenue of €31,729, a rent gap of 4323.9%, 827 active listings, strict short-term rental regulation, and a typical 2-bedroom property price of €160,578.
Market gradeA
Yield20.9%
Revenue growth+12.4%
Occupancy66.0%
Average daily rate€127
Annual revenue€31,729
Rent gap4323.9%
Active listings827
2-bedroom price€160,578
RegulationStrict
Percentile versus other Spain markets on this page. Farther from the center is stronger.
Zaragoza is rank 2 of 91 markets in this Spain ranking by Airbtics Market Grade A, with 20.6% short-term rental yield, 69.0% occupancy, and +17.9% year-over-year revenue growth.
Compared with the other markets on this page, Zaragoza ranks top 18% for yield, top 3% for growth, and top 50% for demand. The market shows an average daily rate of €114, annual revenue of €29,643, a rent gap of 4844.1%, 743 active listings, strict short-term rental regulation, and a typical 2-bedroom property price of €160,578.
Market gradeA
Yield20.6%
Revenue growth+17.9%
Occupancy69.0%
Average daily rate€114
Annual revenue€29,643
Rent gap4844.1%
Active listings743
2-bedroom price€160,578
RegulationStrict
Percentile versus other Spain markets on this page. Farther from the center is stronger.
Toledo is rank 3 of 91 markets in this Spain ranking by Airbtics Market Grade A, with 22.4% short-term rental yield, 58.0% occupancy, and +19.1% year-over-year revenue growth.
Compared with the other markets on this page, Toledo ranks top 7% for yield, top 2% for growth, and lowest 16% for demand. The market shows an average daily rate of €112, annual revenue of €24,795, a rent gap of 4370.9%, 621 active listings, strict short-term rental regulation, and a typical 2-bedroom property price of €133,815.
Market gradeA
Yield22.4%
Revenue growth+19.1%
Occupancy58.0%
Average daily rate€112
Annual revenue€24,795
Rent gap4370.9%
Active listings621
2-bedroom price€133,815
RegulationStrict
Percentile versus other Spain markets on this page. Farther from the center is stronger.
Yield: top 7%
Growth: top 2%
Demand: lowest 16%
Market Rankboard: Spain
Each dot is a vacation rental market in Spain, plotted by
occupancy rate (x-axis) and average daily rate (ADR) (y-axis).
Dashed lines mark the national median.
Occupancy rate and average daily rate for each Spain market plotted in the chart above, in Market Grade order.
Market
Occupancy rate
Average daily rate
Elche
66.0%
€127
Zaragoza
69.0%
€114
Toledo
58.0%
€112
Málaga
84.0%
€132
Sevilla
77.0%
€129
La Oliva
79.0%
€107
San Bartolomé De Tirajana
74.0%
€124
Orihuela
66.0%
€123
Ibiza
70.0%
€590
La Palma
70.0%
€94
Cartagena
60.0%
€116
Níjar
53.0%
€116
Santa Pola
67.0%
€117
Ciutadella De Menorca
74.0%
€197
Serra Calderona
53.0%
€114
Moraira
70.0%
€222
Sant Josep De Sa Talaia
72.0%
€711
Santa Eulalia Del Río
70.0%
€554
Llucmajor
72.0%
€344
Valencia
79.0%
€125
Alicante
78.0%
€120
Yaiza
83.0%
€197
Tías
86.0%
€128
Teguise
84.0%
€114
Granadilla De Abona
73.0%
€111
Mijas
69.0%
€161
Adeje
77.0%
€136
Las Palmas de Gran Canaria
71.0%
€94
Córdoba
57.0%
€96
Jávea
65.0%
€207
San Sebastian
71.0%
€228
Mogán
70.0%
€124
Gandia
60.0%
€127
Roquetas de Mar
60.0%
€99
La Gomera
63.0%
€85
Leon
50.0%
€97
Manacor
72.0%
€267
Santa Margalida
73.0%
€244
Felanitx
74.0%
€364
Alcossebre
62.0%
€114
A Coruña
66.0%
€120
Madrid
81.0%
€132
Barcelona
83.0%
€197
Granada
68.0%
€100
Torrevieja
65.0%
€99
Arona
78.0%
€117
Torremolinos
77.0%
€119
Benidorm
70.0%
€133
Fuengirola
75.0%
€150
Pollença
82.0%
€295
Chiclana De La Frontera
54.0%
€165
Bilbao
74.0%
€144
Gijón
60.0%
€115
Peñíscola
57.0%
€124
Jerez
53.0%
€94
Oviedo
67.0%
€105
Logroño
54.0%
€114
Manacor
72.0%
€267
Puerto Rico de Gran Canaria
71.0%
€114
Alaior
77.0%
€227
Marbella
66.0%
€212
Costa brava
58.0%
€173
Conil De La Frontera
53.0%
€135
Nerja
71.0%
€140
Salou
64.0%
€134
Oropesa Del Mar
52.0%
€108
Llanes
52.0%
€135
Torre Del Mar
68.0%
€117
Salamanca
57.0%
€93
Tarragona
63.0%
€115
Formentera
72.0%
€222
Santiago de Compostela
63.0%
€110
Baix Llobregat
68.0%
€174
Benalmádena
76.0%
€117
Calpe
69.0%
€148
Estepona
66.0%
€188
Dénia
61.0%
€139
Cádiz
67.0%
€119
Lloret De Mar
59.0%
€158
Castelló D'Empúries
57.0%
€134
Alcúdia
78.0%
€275
Santander
64.0%
€121
Santa Cruz De Tenerife
74.0%
€102
Vigo
61.0%
€100
Santanyi
77.0%
€296
Santanyí
77.0%
€293
Palma de Mallorca
80.0%
€240
Ronda
61.0%
€107
Tarifa
59.0%
€132
Roses
58.0%
€124
Es Mercadal
73.0%
€176
Compare property prices, short-term rental yield, rent gap, annual revenue, and supply growth in the
Airbtics Market Explorer watchlist.
See all Airbnb markets in Spain
Browse all 91 markets we track in Spain. Each link opens the market's Airbnb revenue and performance data page.
Airbtics ranks short-term rental markets in Spain by Market Grade. The grade compares yield (annual revenue divided by property price), year-over-year revenue growth, and occupancy, then adjusts for regulation. The highest-graded market in this dataset is Elche. The main table lists markets in that order; use the Market Explorer to filter by budget, regulations, and more.
How many Airbnb markets does Airbtics track in Spain?
We currently analyze 91 active short-term rental markets in Spain with listing supply, median occupancy, ADR, and revenue estimates.
What is the average Airbnb occupancy rate in Spain?
The national average occupancy rate across tracked markets is 68.01% (LTM). Rates differ by city. Use the rankboard on this page, or open a market page for that city's numbers.
How do I compare Airbnb markets in Spain?
Use the occupancy vs ADR rankboard on this page for a quick view, or open the Market Explorer to compare markets side by side, change chart axes, export to Excel, and save markets to a watchlist.
How can I estimate Airbnb income in Spain?
Use our Airbnb income calculator to estimate revenue for a specific address, or open any market link below for median revenue and occupancy benchmarks.