fbpx
🎉 FREE WEBINAR - July 24th, 11am / 8pm CET - Learn Airbtics in 7 Minutes - Revenue and Market Analysis Tips and Best Practices!
Categories
Guides Most Profitable Airbnb

Best Airbnb Markets Ranked by Data Scientist

top_12_us_airbnb_markets_ranked

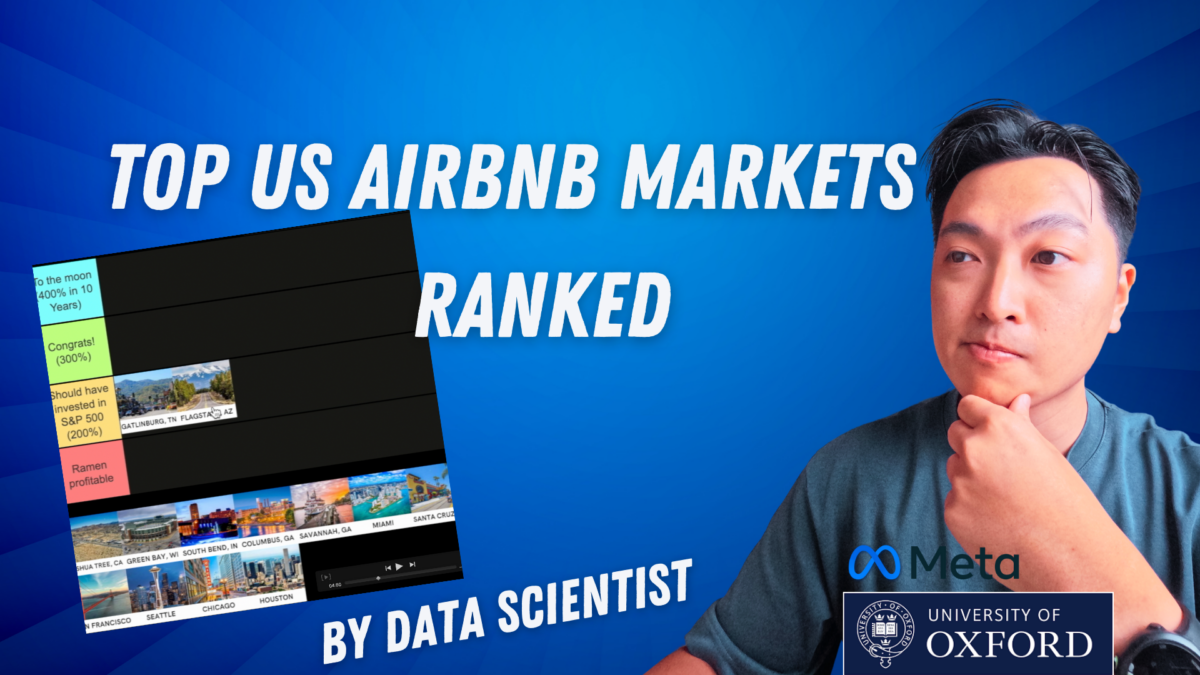
I’ve analyzed the profitability of 12 US Airbnb markets. The primary factor is how much you will make in 10 years from an average short-term rental investment in a market. I discovered markets from 350% return in 10 years to 150% return.
If you have a high paying full time job, short-term rental investment may be the fastest way to achieve financial freedom.

90% of millionaires attribute their wealth in part to real estate holdings. Thanks to Airbnb, you can increase rental income from your investment property.

Real estate is all about location. So, today, I’ve ranked 12 cities into 4 different tiers depending on how much wealth it will bring to you in 10 years. Where did I get this list? I chose the markets that other short-term rental YouTubers and bloggers claim to be the best Airbnb markets.

List of cities we’ll cover

  • Chicago 
  • Columbus, GA 
  • Flagstaff 
  • Gatlinburg 
  • Green Bay
  • Houston 
  • Joshua Tree 
  • Miami 
  • San Francisco
  • Santa Cruz 
  • Savannah 
  • Seattle 
  • South Bend 

Methodology

How much will you make from this investment in 10 years is the primary factor for ranking. I call this 10 years ROI. 10 years ROI comes from home value appreciation and profits from running an Airbnb.

Assumptions 

  • All cash purchase (No mortgage) 
  • 2023 data for home value and short-term rental revenue 
  • 1-bedroom house investment 
  • Closing cost and furnishing cost not included 

Home Price Forecast (2024 – 2033) model used the following 3 factors 

  • 5 years home price change 
  • 5 years average income level change 
  • 5 years population change 

I used a model that predicts the next 10 years’ home value appreciation based on historical property prices, population, and income changes. I won’t go into details about this prediction model, but you can find this in the Airbtics app. Here is one example of how the model works. If the average home price has been increasing rapidly, let’s say 15% a year, but the total population and average income are not growing as fast as the housing price, then, the model will correct the home value appreciation rate to be lower than the past years.

For your information, If you take a mortgage, the ROI will become a lot higher. Also, I did include the tax and initial starting cost. You have to spend money on furnishing, as well as, closing the property. 

Investing in mountain destinations 

Let’s start with 3 mountain destinations. I recommend you to do an Airbnb in a place you’d like to visit once in a while. This can help or even push you to make time to do your hobby. So, if you like snowboarding or hiking, investing in a mountain can be an exciting option. The downside is that it will be hard to find a long-term or mid-term tenant when the short-term rental demand goes down. However, the local governments are short-term rental friendly because tourism is their major industry. There’s very little regulatory risk.

Gatlinburg is a gateway town to the Smoky Mountains. It’s 3-4 hours drive to Nashville and Atlanta. You need to get a short-term rental permit and maintain certain conditions to be an Airbnb host here. This kind of regulation is good for the short-term rental industry in the long run.

Gatlinburg
Rank: 11th – Should have invested in S&P 500
10 years ROI: 197% 
Net Yield: 5% 
Home Price Forecast 2023 – 2032: 8.1% 
Occupancy Rate: 73% 
Average Daily Rate: $153 
Yearly Airbnb Revenue: $40k 
Property Price (2023): $478k 
Home Value Trend: 7.9% per year 
Population Trend: 3.1% per 5 years 
Income Trend: 35.1% per 5 years 

Flagstaff is a gateway town to San Francisco Peaks. Another similar town is Sedona. It’s a 3-4 hour drive to Phoenix. This city doesn’t get as warm as Phoenix due to its high altitude. This place is getting popular rapidly these days.

Flagstaff
Rank: 10th – Should have invested in S&P 500
10 years ROI: 206%
Net Yield: 5%
Home Price Forecast 2023 – 2032: 8.25%
Occupancy Rate: 71%
Average Daily Rate: $110
Yearly Airbnb Revenue: 29K
Property Price (2023): 325K
Home Value Trend: 9.5% per year 
Population Trend:  4.4 per 5 years
Income Trend:  25.7 per 5 years

Joshua Tree might be your place If you are looking for some wilderness near Los Angeles. It’s where two distinct desert ecosystems meet, the Mojave and the Colorado.

Joshua Tree
Rank: 8th – Should have invested in S&P 500
10 years ROI: 244%
Net Yield: 6%
Home Price Forecast 2023 – 2032: 8.75%
Occupancy Rate: 62%
Average Daily Rate: $143
Yearly Airbnb Revenue: 33K
Property Price (2023): 349K
Home Value Trend: 9% per year
Population Trend: 3% per 5 years
Income Trend: 37.0% per 5 years

Investing in Rural and Suburb 

Now, we’ll go through rural & Suburban towns. You can find the cheapest properties in rural and suburban areas. These are the ones without major tourist attractions like ski resorts or Disneyland. There are some rural areas with good short-term rental demands, and it’s for work like traveling nurses or construction workers, or sometimes, college student’s families. I believe rural and suburban areas tend to be the best markets for high return on investment.

Green Bay is a rural town known for the Green Bay Packers. It’s in Wisconsin, a very peaceful state. I included this in the list because I went to high school here for 6 months. People use Airbnb for business trips, to visit their family, and occasionally travelers.

Green Bay
Rank: 4th – Congrats (300%)
10 years ROI: 258%
Net Yield: 11%
Home Price Forecast 2023 – 2032: 7.0%
Occupancy Rate: 42%
Average Daily Rate: $128
Yearly Airbnb Revenue: 20K
Property Price (2023): 109K
Home Value Trend: 6.3% per year 
Population Trend: 3.9% per 5 years 
Income Trend: 30.6% per 5 years

South Bend is a suburban town in Indiana and home to Notre Dame University. Two hours away from Chicago International Airport. The two main industries here are health care and education. So, you can expect to receive traveling nurses and college students’ families as your guest.

South Bend
Rank: 2nd – to the moon (400% in 10 years)
10 years ROI: 363%
Net Yield: 19%
Home Price Forecast 2023 – 2032: 6.6%
Occupancy Rate: 54%
Average Daily Rate: $111
Yearly Airbnb Revenue: 24K
Property Price (2023): 75K
Home Value Trend7.0% per year
Population Trend: 1.2% per 5 years
Income Trend: 28.3% per 5 years

Columbus is a suburban town in Georgia. To do short-term rentals, you need to apply for a vacation rental permit. The city seems to put heavy effort in bringing more tourists. There are some good museums, like the Columbus Synchronous Orchestra and the Columbus Museum.

Columbus
Rank: 1st – to the moon
10 years ROI: 379%
Net Yield: 22%
Home Price Forecast 2023 – 2032: 5.75%
Occupancy Rate: 71%
Average Daily Rate: $78
Yearly Airbnb Revenue: $19K
Property Price (2023): $51K
Home Value Trend: 4.1% per year
Population Trend: 5.2% per 5 years
Income Trend: 26% per 5 years

Investing in coastal towns 

Coastal towns attract year-round visitors, whether it’s for beach or fishing or port. For this reason, housing prices tend to be more expensive near the coast. But, the short-term rental revenue is also high.

Savannah. What’s noticeable here is the high average Airbnb rental revenue, it’s 43k per year. The average daily rate is $163 per night, and among the cities we reviewed so far, this is the highest number. The property price isn’t too expensive either, Just about 200k. This gives 316% 10 years ROI, so it goes to the congrats tier!

Savannah
Rank: 3rd – Congrats! (300%)
10 years ROI: 316%
Net Yield: 13%
Home Price Forecast 2023 – 2032: 7.95%
Occupancy Rate: 69%
Average Daily Rate: $163
Yearly Airbnb Revenue: 43K
Property Price (2023): 200K
Home Value Trend: 7.6% per year
Population Trend: 7.7% per 5 years
Income Trend: 28.5% per 5 years

Miami is one of the most known vacation destinations attracting a huge number of international travelers. More and more businesses are opening branches in Florida, such as Goldman Sachs and Blackstone. It has a good international airport serving flights to cities in Latin America and Europe.

Miami
Rank: 5th – Should have invested in S&P 500
10 years ROI: 250%
Net Yield: 8%
Home Price Forecast 2023 – 2032: 8.45%
Occupancy Rate: 69%
Average Daily Rate: $143
Yearly Airbnb Revenue: 33K
Property Price (2023): 253K
Home Value Trend: 9.3% per year
Population Trend: 1.7% per 5 years
Income Trend: 33.5% per 5 years

Santa Cruz is a nice surfing town for someone based in the Bay Area. When I was working at Meta, I heard someone commuting from Santa Cruz to the Menlo Park Meta office. He bragged that the 17 highway has a nice view.

Santa Cruz
Rank: 12th – Should have invested in S&P 500
10 years ROI: 179%
Net Yield: 5%
Home Price Forecast 2023 – 2032: 7.6%
Occupancy Rate: 68%
Average Daily Rate: $183
Yearly Airbnb Revenue: 44K
Property Price (2023): 563K
Home Value Trend: 7.6% per year
Population Trend-1.7% per 5 years
Income Trend: 41.7% per 5 years

Investing in urban

Urban attracts people. Property appreciation is faster. Things are always happening. Short-term rental yields are low due to high property prices, but it’s quicker to buy and sell a home, and there’s always long-term rental demand. There’s a high regulatory risk, more and more cities are enforcing new short-term rental regulations every month, like New York City and Dallas.

San Francisco is one of the most expensive cities to live in the US. There are numerous amount of high tech companies. Even Airbnb’s headquarters is here. A lot of high-paid jobs. Year round good sunny yet cool weather. I visited here quite a few times while working for Meta. I really loved the city and vibe.

However, just like New York City, they’ve been cracking down on Airbnb hosts. You can only run an Airbnb 90 days a year, and you need to be a resident of San Francisco. Some hosts bypass this law, but their fine is heavy, so I wouldn’t personally risk it.

San Francisco
Rank: 13th – Ramen profitable
10 years ROI: 174%
Net Yield: 3%
Home Price Forecast 2023 – 2032: 8.4%
Occupancy Rate: 76%
Average Daily Rate: $154
Yearly Airbnb Revenue: 42K
Property Price (2023): 812K
Home Value Trend: 8.4% per year
Population Trend: 1.1% per 5 years
Income Trend: 39.5% per 5 years

Seattle allows one secondary home to be let out as a short-term rental. If you are looking to diversify your short-term rental investment portfolio, Seattle can be a great option too.

Seattle
Rank: 6th – Should have invested in S&P 500
10 years ROI: 249%
Net Yield: 4%
Home Price Forecast 2023 – 2032: 10.8%
Occupancy Rate: 77%
Average Daily Rate: $128
Yearly Airbnb Revenue: 35K
Property Price (2023): 570K
Home Value Trend: 11.5% per year
Population Trend: 7.1% per 5 years
Income Trend: 38.7% per 5 years

In Chicago, you need to apply for a short-term rental permit, and the process is quite straightforward. This puts this city in a better position than Seattle and San Francisco. I think Chicago is a great place to live. Good job opportunities. And still cheap property price.

Chicago
Rank: 9th – Should have invested in S&P 500
10 years ROI: 217%
Net Yield: 11%
Home Price Forecast 2023 – 2032: 5.65%
Occupancy Rate: 65%
Average Daily Rate: $121
Yearly Airbnb Revenue: 28K
Property Price (2023): 157K
Home Value Trend: 5.3% per year
Population Trend: 0.2% per 5 years
Income Trend: 29.4% per 5 years

Houston doesn’t have a strict Airbnb regulation. But Recently, Dallas banned short-term rentals in residential areas. So it’s a matter of time for Houston to start STR regulation.

Houston
Rank: 7th – Should have invested in S&P 500
10 years ROI: 231%
Net Yield: 7%
Home Price Forecast 2023 – 2032: 8.15%
Occupancy Rate: 62%
Average Daily Rate: $91
Yearly Airbnb Revenue21K
Property Price (2023): 178K
Home Value Trend: 8.8% per year
Population Trend: 7.6% per 5 years
Income Trend: 24.1% per 5 years

top_12_us_airbnb_markets_ranked2

Unlock Worldwide
Short-Term Rental Data
Find unsaturated neighborhoods with the highest occupancy history.

Categories
Airbnb Investment Most Profitable Airbnb

How to Short Term Rental Analysis to Find Profitable Airbnb Markets with 425%+ 10-Year Returns [For Property Investors]

Residential property investment is one of the lowest-risk investments. But did you know you can achieve a 10% net rental yield by listing your property on Airbnb? By combining property appreciation and high cash flow, you can achieve 3-4 times the return on your investment in 10 years.

How can you make the most money out of your residential investment property? I believe the answer is running an Airbnb.

By combining high monthly cash flow from short-term rentals with annual property appreciation, you can easily achieve 3 times return on your investment in the next 10 years.

But, this is only possible in markets with high short-term rental cash flow. How can you find this?

“ Hi, I’m Jae, the founder and data scientist at Airbtics. We help investors to achieve ten thousand dollars in monthly passive income faster with short-term rental data.”

Why Short-term rental market analysis?

So, I’ve looked into short-term rental yields of more than 100 markets worldwide. As expected, there are many markets where the average expected Airbnb revenue is about the same in two cities, but the property prices are much cheaper in one city.

Here, you can find that the average net short-term rental yield varies between 9% and 22%. What I want to emphasize is that the yield varies significantly depending on the market. Keep in mind, that this is just an average. The net yield in the best market is 2.3 times higher than in the worst market.

Now, let’s take a look at the ten-year average property price changes in these markets, ranging from a 91% increase to a 33% increase in property prices over the last decade. It’s crucial to note that property price changes and net rental yields are not inversely proportional. This indicates that a market can experience both high net yield and high property appreciation.

short-term-rental-market-analysis-of-12-cities

After exploring these 29 markets through 29 simulations, it’s evident that Manchester would have generated the most wealth for you. In Manchester, the average property value increased by 91% in 10 years, translating to a 7.5% annual increase. An average short-term rental host recorded a 16.5% annual net rental yield. Your initial $100,000 investment in a short-term rental would have resulted in a total wealth of $425,000 after 10 years.If you had invested in the S&P 500, which recorded an 11% average annual appreciation, your wealth would have been a mere $235,795.

3 key factors for a profitable short-term rental market 

Alright, let’s break it down to the three key factors you should keep an eye on. These are the three. 

  • Population Growth (10 years change) 
  • Income Growth (10 years change) 
  • Short term rental yields (Last 3 years average) 

Real estate researchers agree that population and economic growth are the most fundamental property pricing drivers. There is a limited amount of land in every city. If more people want to live there, and if they can afford higher property prices, this will drive the property price.

Now, let’s talk about finding that perfect city to kickstart your Airbnb venture.

How to use short-term rental analytics tool

Alright, let’s dive into this map. It’s like your secret weapon for finding profitable markets. A high market grade here means the market has a high short-term rental yield, paired with some serious population and income growth in the last 10 years. And the best part? It’s all at your fingertips. Just click around, and boom, you’ve got the market grades of other cities right there.

Now, where do we get our data? We use official government stats for population and income levels. And when it comes to property and short-term rental data, our software is on it. We’re scanning sites like Airbnb and Zillow, monitoring over 10M listings every single week. We’ve been doing this since 2019.

Have you found an interesting market? Good, because once you spot a market that you like, head on over to the comparison tab. Voila! You can compare key market statistics side by side.

And here’s where it gets interesting – you can deep dive into the nitty-gritty of your chosen market. We’re talking key metrics like average yearly revenue, daily rates, and occupancy rates. Want to get granular? Break it down by property size, type, or even review rating score. And hey, ever wondered where those guests are traveling in from? We’ve got that covered too.

If it all checks out, hit that expand button on the map and witness the magic of the heatmap. Dark red? That’s the sweet spot – guests love that area. On the right, you can see top properties. These are the ones that are most popular among the guests in the specific neighborhoods. Pay attention to what types of properties are performing well. Want to know how much they raked in over the last twelve months? We’ve got the numbers.

Armed with this info, you’re now ready to hit up websites like Zillow or Redfin and start your property hunt. Let the treasure hunt begin!”

Unlock Worldwide
Short-Term Rental Data
Find unsaturated neighborhoods with the highest occupancy history.

Free Webinar

Learn Airbtics in 7 Minutes

Revenue and market analysis Tips and Best Practices!
Airbnb Data
Airbnb Data

ARE YOU IN?

Get Access to our weekly data-driven airbnb report!