Investing in short-term rental is buying the most stable asset (which is housing) with rental profit twice higher than traditional rentals.
 Airbtics | Airbnb Analytics
Investing in short-term rental is buying the most stable asset (which is housing) with rental profit twice higher than traditional rentals.

I’ve analyzed the profitability of 12 US Airbnb markets. The primary factor is how much you will make in 10 years from an average short-term rental investment in a market. I discovered markets from 350% return in 10 years to 150% return.

How to Short Term Rental Analysis to Find Profitable Airbnb Markets with 425%+ 10-Year Returns [For Property Investors] Residential property investment is one of the lowest-risk investments. But did you know you can achieve a 10% net rental yield by listing your property on Airbnb? By combining property appreciation and high cash flow, you can […]
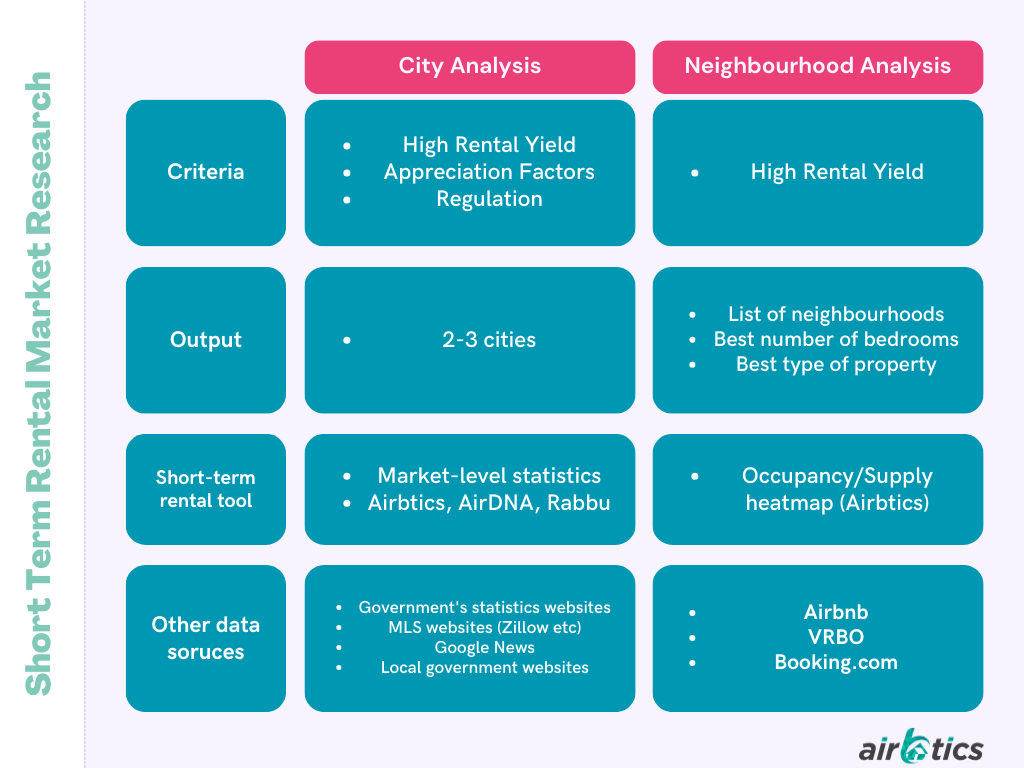
Beginner friendly! This is the complete Airbnb market research guide for property investors. 1. City analysis (high rental yield, appreciation, and regulations) 2. Neighborhood analysis

Instantly See An Average Airbnb Occupancy Rate Discover 30+ Airbnb statistics of any city worldwide! Estimate What Is Occupancy Rate? It is the percentage of nights booked among the available nights on an Airbnb listing. How can you find the average occupancy rate of your market? How to find Airbnb Occupancy Rates? Simply enter an […]

4 steps to have a successful first Airbnb arbitrage property. What is Airbnb arbitrage? You rent a property from a landlord, furnish it, and list it on Airbnb. You earn more than what you pay to the landlord.
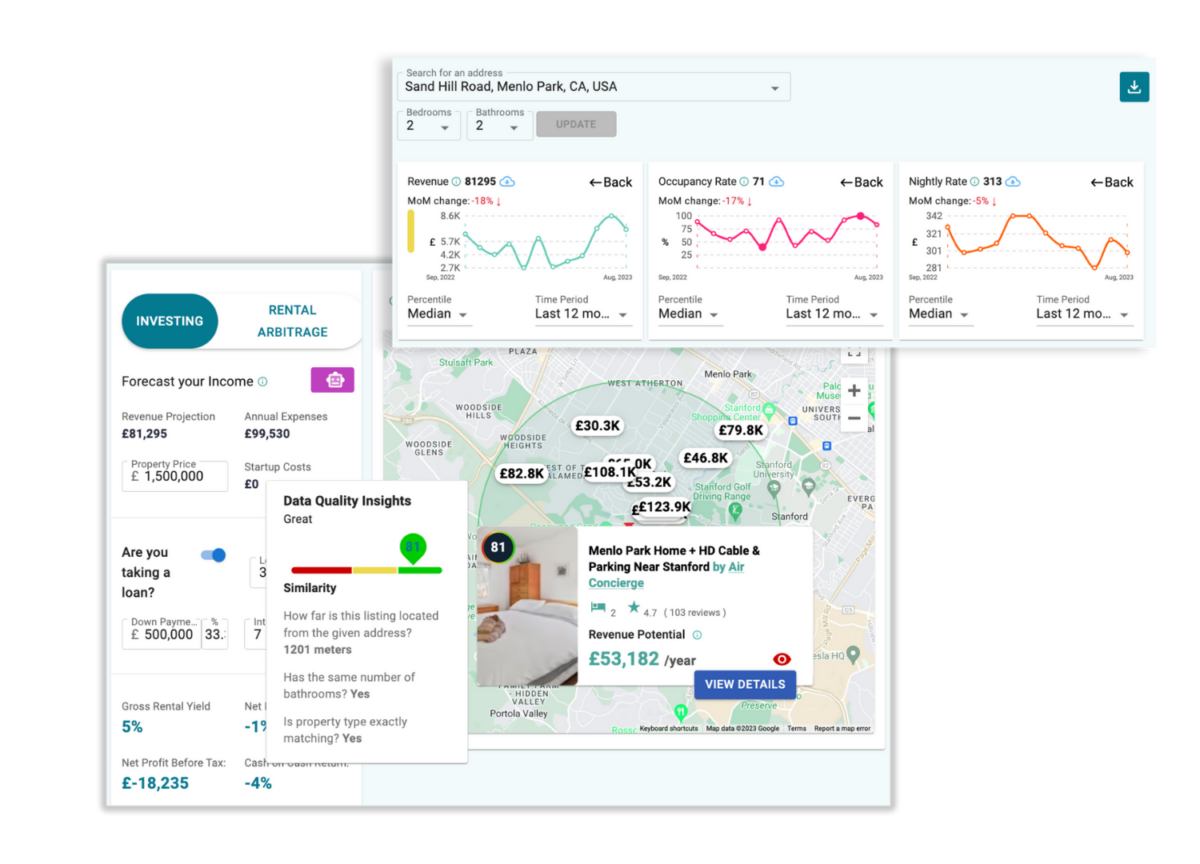
Airbnb Calculator Instantly See Your Airbnb’s Estimated Revenue The leading Airbnb profit calculator in the short-term rental industry. Discover your Airbnb earnings potential. Estimate Bedrooms − 1 + What is your goal? Buy Rent Manage Calculate Trusted by 50,000+ Short-Term Rental Businesses Check out our Free Airbnb Calculator Wondering how to make the most money […]

8 Best AirDNA alternatives for 2023 (Free and Paid): Did you know that there are AirDNA alternatives in the market? Check out the indirect competitors of AirDNA and learn how you can innovate! Home > Resources > Alternatives & Reviews > Alternatives & Reviews Did you know that there are AirDNA alternatives in the market? […]