 Airbtics | Airbnb Analytics
Precise Short-term Rental Analytics
Airbtics | Airbnb AnalyticsAside from knowing your Airbnb property’s potential revenue and profit, it’s also important for property investors to create an analysis of their specific short-term rental market this 2023. Each town and neighborhood may perform differently in a certain period of time, which is why STR analytics tools will be helpful for investors like you!
In this article, we will show you how to create your own custom Airbnb market by discussing the ff:
• Definition of a “market”
• The power of custom markets
• 2 simple ways to search an Airbnb market
• Get full access to the data with Airbtics!
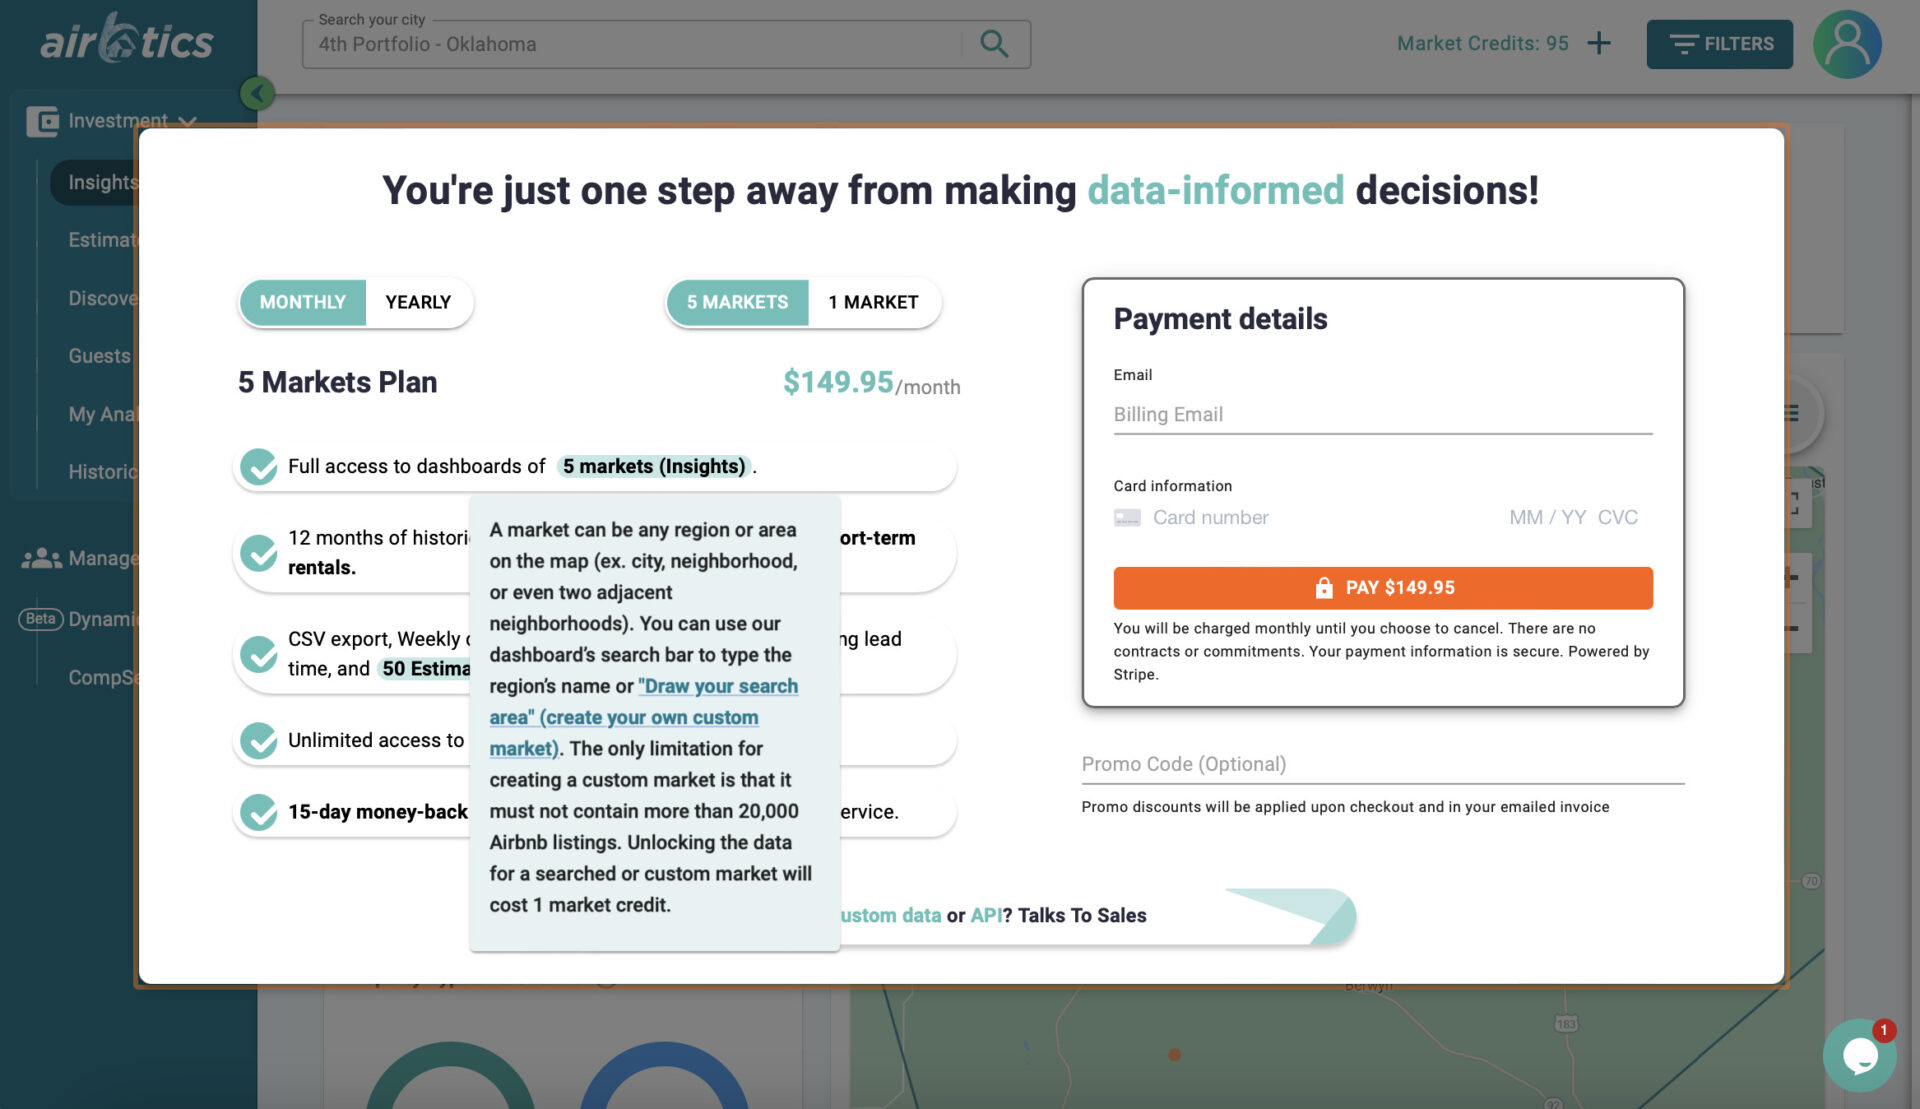
A market can be any region or area on the map (eg. a city, neighborhood, or even two adjacent neighborhoods). On the purchase page, hover the “5 market (insights)” and you would see the whole definition of it.
You can also choose how many markets you want to avail of per month and year. For instance, you have purchased 5 markets per month. This will give you full access to the dashboard of 5 cities every month.
With Airbtics platform, you have the flexibility to create custom markets that extend beyond traditional city or neighborhood boundaries. Rather than being limited by Google Maps’ predefined boundaries, you can draw your own search area to tailor your market.
For example, if you want to include a forested area in your market but it’s not covered by the default map, you can easily incorporate it by drawing your own custom Airbnb market.
The only limitation of creating a custom rental market is that it must not contain more than 20,000 Airbnb listings. Unlocking the data for a searched or custom market will cost 1 market credit.
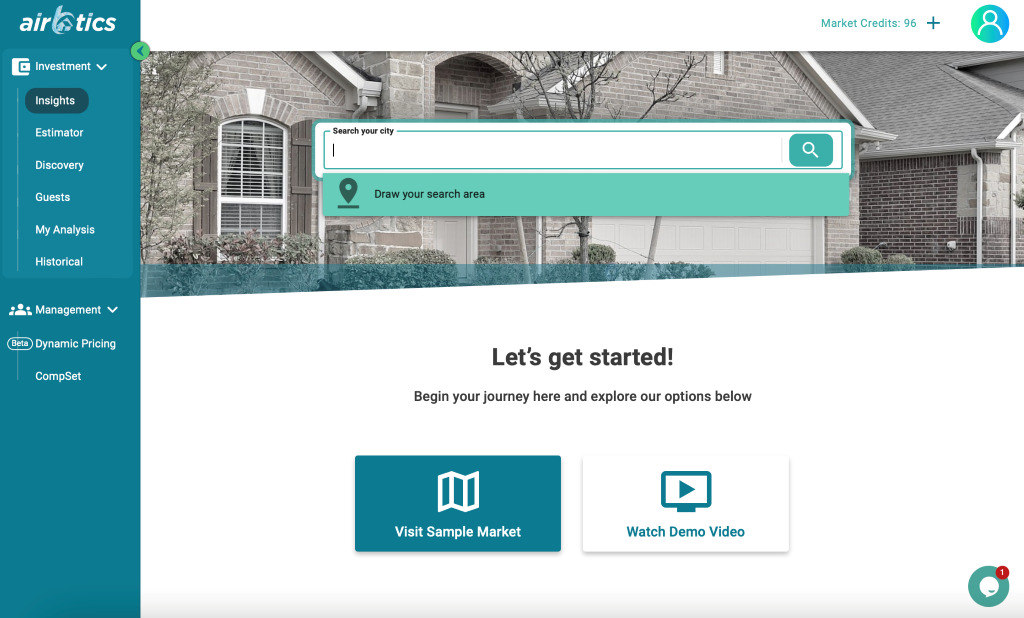
There are two simple ways to search a vacation rental market using the Insights tab in the dashboard: (1) Input your town/neighborhood with a specific name, and (2) draw your search area.
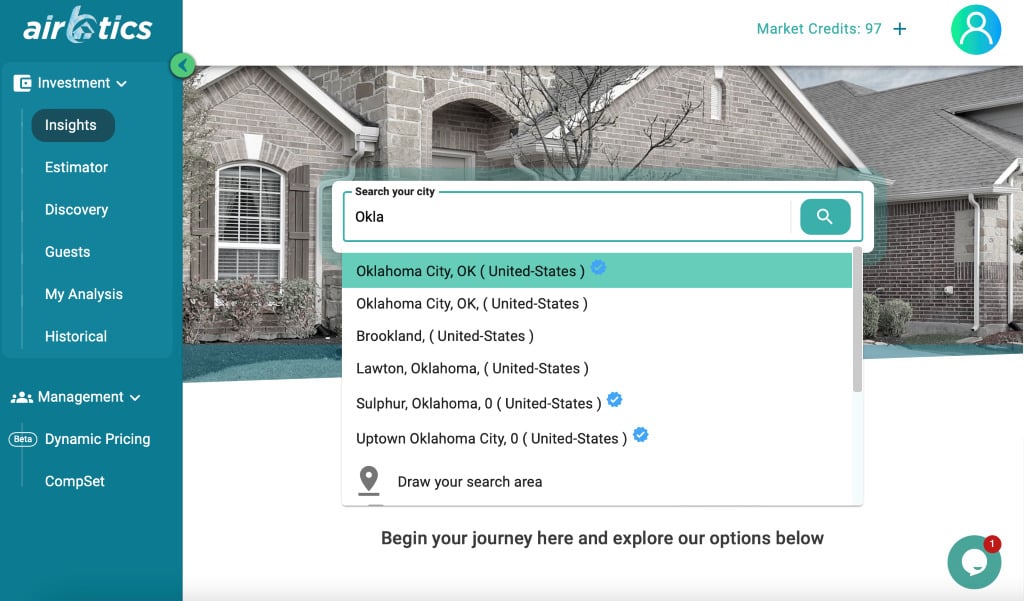
1. Search your city or neighborhood by typing its name. For example, if you want to search for Oklahoma City, just type it in the search box and suggestions will pop up automatically. You can also choose an Airbtics verified market with a check icon.
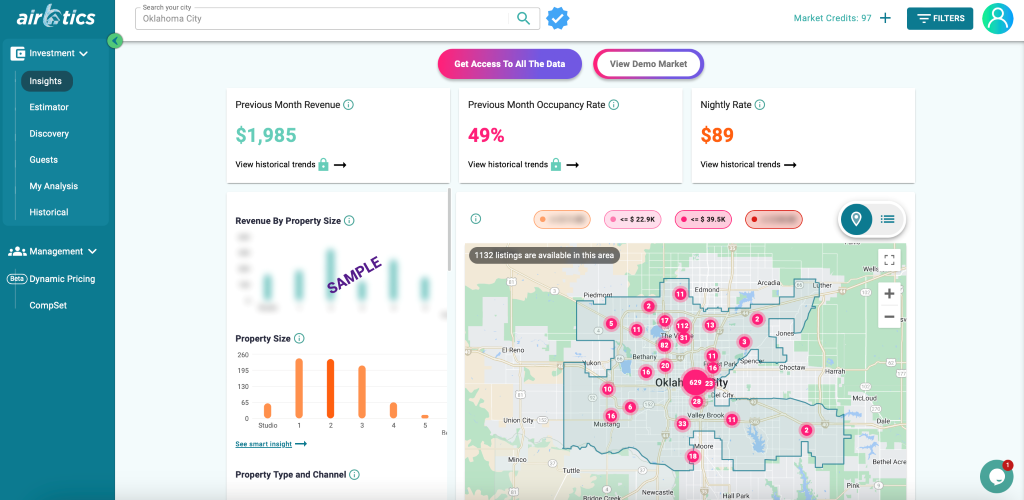
2. You will see an overview of the data plus the pre-made map.
If you’re not happy with the predefined boundaries of the city, where you want to include a nearby area, then feel free to create your own custom market by drawing your search area. (full tutorial below)
In a very rare case, a specific neighborhood won’t show up. If that happens, we suggest you draw your search area.
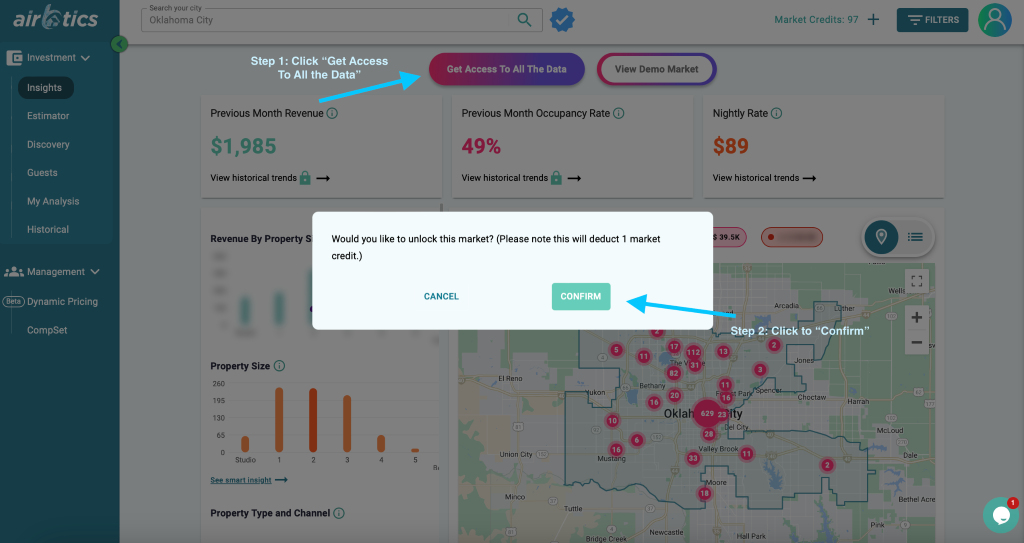
👉 However, if you are contented with the predefined boundaries of the map, get a full view of the data by unlocking the market. It takes 1 market credit to do that.
Unlike other STR tools, Airbtics has the only feature where you can “draw your search” for full customization. Most users use this tool in order for them to get the most out of their market research.
1. Instead of typing a specific name of your neighborhood, click the “draw your search area”.
Move and zoom in on the map to find your target location and then select the polygon button to draw your target area. After that, market data will be generated for you which takes about less than a minute.
Once you have finalized your target area on the map, you can easily see how many listings your selected region has. You can even customize its region name before setting the market and instantly access the data that you need!
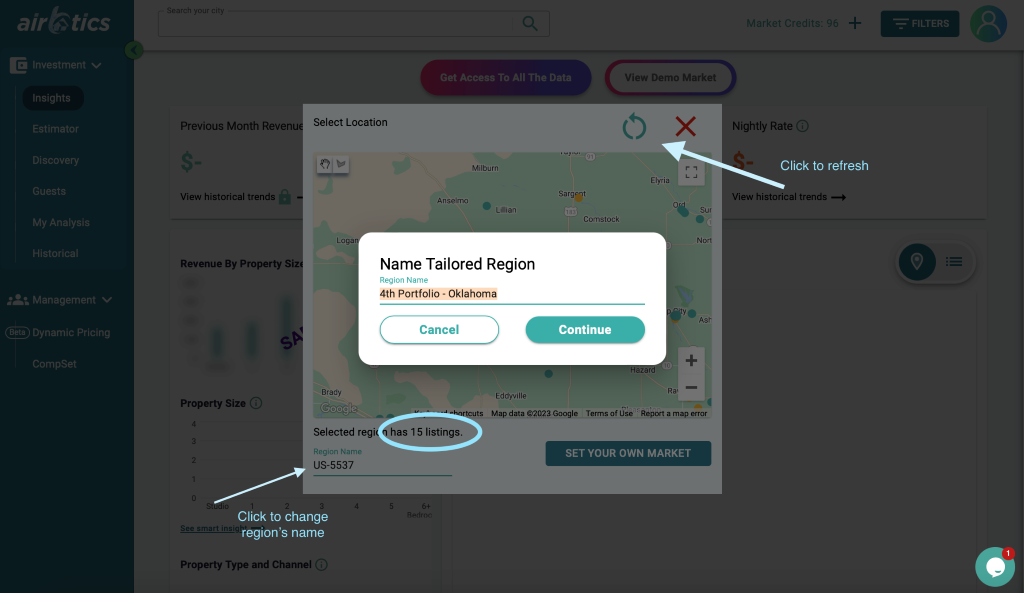
👉 Important Note: The only limitation of the custom market is it must not contain more than 20,000 Airbnb listings. In short, check the listings first before clicking on “Set your own market”. Click refresh icon to restart your draw search.
Congratulations! 🎉 you’ve set up your own market successfully. Using Airbitics’ tool, here are the following data points that you’ll be able to access:
• Occupancy Rate
• Average Daily Rate
• Annual Revenue
• Nightly Rate
• Seasonality
• Average Length of Stay
• Top-performing listings
• Revenue Heatmap
Another jaw-dropping feature of Airbtics is its dynamic data. When you move and zoom in and out of your map, the data will also change accordingly. and in sync with where you are on your map. It means the information is synchronized and new data will become available where you are on your map. This is useful for comparing different neighborhoods.
In the digital era where everything is rapidly changing, relying on inaccurate research and manual calculations is no longer applicable! Watch how our team applied this step-by-step guide in this video tutorial.