fbpx
🎉 FREE WEBINAR - July 24th, 11am / 8pm CET - Learn Airbtics in 7 Minutes - Revenue and Market Analysis Tips and Best Practices!
Categories
All About Airbnb Hosting Tips

Should Airbnb hosts engage in Airbnb Experiences?

While accommodation is one of the first things people look for when planning for their travel, many people travel primarily for local experiences. Airbnb recognizes this and as you might be aware, they introduced ‘Airbnb Experiences’ in 2016 which allows users to host activities, tours and classes, and users can book directly on the platform.

Table of Contents

What are the pros and cons?

Nowadays, people seek for authenticity. Airbnb Experiences started off by reaching out to the locals on things to do in their cities. It adds a personal touch, rather than the usual “top things to do” recommended by tour guides, where many would be deemed as tourist traps. That sets Airbnb Experiences apart from other booking platforms. Furthermore, it is always helpful for travelers to be able to book both their accommodations and activities for their trips through the same platform. As for the hosts, they can be getting paid for doing something that they love, be it introducing their hobby or simply the engagement with people. It may also help to bring more guests to their rental properties listed on Airbnb through those experiences. 

However, the downside of Airbnb Experiences is that they may not be available in all regions. It is dependent on the interest of the locals and in some places, it may be hard to get them to be involved. Having said that, the authenticity and unique experiences of those activities may be what attracts people, so it can be a double-edge sword. Since the experiences offered are based on personal interests and passion of the hosts, it may be hard to keep track of their quality of service in delivering the services. On the other hand, for the local hosts, they may worry about the volume of people visiting their city. If it is not a popular city, there may not be people interested in engaging in the experiences they offer. There could also be language barriers between the hosts and guests.  

How has the response been?

68% of the travelers regard food and drinks as the most important component of travel, as mentioned in an article by Eater. Hence, Airbnb Experiences have included more than 3000 experiences in cooking-related activities. Other popular experiences are horse yoga, mindful movement (meditating and hiking), Nama’ Tastings (wine and yoga), Carb Feast (pizza and pasta), tie dye classes and historical walking tours. Airbnb came up with a list of the trending cities to visit in 2019 and the top 3 cities are Kaikoura in New Zealand, Xiamen in China and Puebla in Mexico

Airbnb Experiences also opened up business opportunities for countries where STRs are not allowed. For example, in Singapore, the government banned short term stays and the minimum period of stay is 6 months. With the launch of Airbnb Experiences, local hosts can make revenue through this channel.

How has COVID-19 affected Airbnb Experiences?

With Covid-19, Airbnb Experiences adapted with the situation. They shifted their target to the domestic market and added more online activities. As of May 2020, there were 300 online experiences on the platform. Some of the popular online experiences include “Sangria and Secrets with Drag Queens” in Lisbon, Portugal with $150k of revenue in their first month and “Tarot Reading with Mak Jagger” in Austin, Texas with $11k of revenue in one month. 

However, there are still hosts who are unable to transition to the channels online. It may be due to many reasons like not having a stable internet connection in their region, the hosts not being tech-savvy or the experience is simply too difficult to be carried out online. Such hosts are solely dependent on the domestic market for as long as the Covid-19 situation persists.


Conclusion

Airbnb Experiences has grown 13 times faster than their rental property business, making a revenue of more than $1 billion in the second quarter of 2019. If you’re looking for a creative way to increase your revenue, it’s worth considering hosting Airbnb Experiences. You may just find something that the market is willing to spend money on, be it online or physically. The first step is always a gamble as to the feasibility of the ideas but with some time, things get easier and better! 

But before you start advertising your Experience package, you might want to consider whether you  have enough visitors visiting your city to engage in the experiences you are offering. Airbtics provides close to real-time data on the number of visitors visiting any specified cities, as well as booking rate, occupancy rate, pricing strategies and other customizable data that may be useful boosting your revenue. With Airbtics data, you can have a better grasp of the market and decide what types of experience you can offer. If you are not able to shift your experiences online, it is even more important to know your market and competitors well, which will help you better plan your next move in boosting your revenue. 


Categories
Case Studies

Choosing a Vacation Rental Data Platform

Table of Contents

Vacation Rental Data Platforms in the Market

How to assess which vacation rental analytics is the right one for you can be a complicated decision. There are a few key players providing short-term rental analytics services, namely AirDNA, See Transparent, Alltherooms Analytics and Airbtics. Having access to the data can be very useful in the decision making process for people in the short-term rental business, but the question that most ask is which platform should they choose? Hence, we did a comparison between those platforms to determine how each of them benefit the property investors and operators in different ways. 

Background Information of those Platforms

Amongst the four companies, Alltherooms Analytics was founded in 2013, followed by AirDNA in 2014, SeeTransparent in 2016 and Airbtics in 2019. In terms of expansion of their company, AirDNA has the greatest team, with 52 employees in two of their offices, Denver and Barcelona. SeeTransparent, AlltheRooms Analytics and Airbtics have a smaller scaled team in Madrid, New York and London respectively. All of these companies have access to worldwide vacation rental data through bookings from Airbnb and VRBO/Homeaway. In addition, SeeTransparent includes booking data from booking.com and Tripadvisor while Airbtics has plans to include data from booking.com starting in March 2021.

Reliability of the Vacation Rental Data

The best way to determine the reliability of vacation rental data is to understand how companies get those data. With up to 10 million property listings published on Airbnb and VRBO, some methods used by the companies include:

  • Web scraping to extract publicly available information such as the daily rates
  • Receiving booking information from PMS software or channel management softwares
  • Directly getting data from Airbnb hosts 
  • Interviewing Airbnb hosts 
  • References from previous clients 

We believe another method that would further prove the reliability of the data is having a consortium or committee where they objectively review the process and quality of collecting the data. This would ensure the accuracy and transparency in the vacation rental data industry.

Purpose of having Vacation Rental Data

Property operators (Host / Managers)

With the growing demand for vacation rentals, competitions across different regions are also increasing. Hence, by having data of the competitors, property operators can compare it against their listings and the market trends to better strategize on ways to increase their revenue. There are some features from the vacation rental data platforms that can be useful for the property operators. Thousands of property managers around the world are already tapping into these resources to help them make better decisions and many of them have seen their revenue increased with the help of those data. 

Airbtics

Airbtics leverages the power of big data to help property operators with dynamic pricing, as well as to increase their booking rate and inventory efficiently. We provide two types of data through application programming interface (API); near real-time booking data from Airbnb and VRBO as well as 30 days of future data on supply, demand and rate. These data are useful for dynamic pricing. Finding property owners who are looking for property managers are usually expensive and time-consuming, so Airbtics generates a list of newly created Airbnb listings per city on a weekly basis. With the rapid growth of the East Asia market, do you know that Chinese tourists are now the biggest outbound travellers? We are able to help property operators understand their platforms like Tujia.com, Yanolja, etc. 

Airbtics has the option of checking the top performing homes and filtering data between super hosts or normal hosts on its dashboard, so property operators can easily identify their strongest competitors. They are also able to detect the pricing strategies used for other listings, which include mid-term rental, max fill-rate and weekend high, so property operators can use that as a reference to set their own pricing strategies. In terms of revenue projection, Airbtics has come up with the short-term rental calculator, which helps to forecast the revenue of a vacation rental property.   

AirDNA

AirDNA offers information on the booking pace of properties in the specified market, ratings on rental demand, rental settings of competitors which includes cancellation policy and minimum stay, as well as Airbnb ratings based on check-in, accuracy, value, location, communication and cleanliness. 

AirDNA also has data that can help property operators set their optimum ADR of their listings. Their dashboard shows real-time availability of competing properties for up to 6 months into the future and the prices they were booked for. Secondly, they have the forward modeling, where they identify upcoming seasonal shifts and compression events that may impact the demand. Thirdly, they developed an Airbnb calculator called AirDNA Rentalizer, which helps to calculate the potential revenue in comparison with the current top ten most comparable listings on Airbnb. 

SeeTransparent

Similar to AirDNA, SeeTransparent offers information on the booking pace of properties in the specified market. Besides, they also show guests reviews of the available properties and offer a ranking system on the listings based on their performances. 

SeeTransparent offers a function, Pickup, which enables property operators to check on current demand and availability of the listings for the next 360 days. Like AirDNA, they identify events in the market that may impact the demand for STRs and have a tool to estimate returns for specific properties.   

Alltherooms Analytics

Alltherooms Analytics rates the property listings with a vacation rental score, which is derived from analyzing the bookings, earnings and reviews of listings in a city. Property operators can add up to five properties to compare on those points. In order to get the score for any property listings, the user has to simply insert their Airbnb listing URL on the dashboard.  

Property operators can also use precision filtering of up to five dimensions to more accurately identify their direct competitors. Their dashboard holds up to two years of historical data which can help the property operators in their decision making process with regards to their amenities and ADRs. 

Property investors

Investing in a vacation rental property is a huge decision and selecting the perfect property may not be the easiest decision. Property investors have to use market research tools to get data like average daily rate and occupancy rate in order to calculate the net rental yield, return on investment (ROI) and cash return. Then, they compare those metrics across the different classifications of properties based on two key factors, geographical locations and number of rooms they have. Those steps will help to determine if a property is ideal as a vacation rental. It is critical to make the right decision on the two key factors as they would not be able to alter it in any way after, unlike purchasing amenities or beds. Those vacation rental data platforms offer some data which may be useful for property investors in making their decision. 

Airbtics

Airbtics provide customized investment and market reports on a yearly basis where property investors can compare the performances of STRs over the years. We released the Tailored Region Explorer feature recently, where users can customize their specific region of interest and get data just on that region. This will give property investors an opportunity to zoom into smaller and perhaps the underrated markets and gain a competitive advantage over other investors. 

Airbtics also provides ADRs, occupancy rates, and revenue data, but what stands out is that it gives property investors actionable insights. As a property investor, you would be interested to know the answer for questions like “should I buy a 2 bedroom house or a 3 bedroom house?”

*The feature below is only available on the enterprise plan currently but will become available to everyone in 2021 January.* 

Graph, Number of rooms, Occupancy rates

Besides the STR calculator where both property operators and investors can use to predict their revenue, Airbtics also provides historical data from year 2018 which can help property investors forecast the future market trends and potential properties to invest in. 

AirDNA

AirDNA provides performance data where they identify the most lucrative locations to invest in. The Airbnb calculator rentalizor tool and ratings on rental demand mentioned above for property operators are also useful for property investors in figuring out the potential revenue they can get from the properties they have shortlisted. 

AirDNA also offers market data, which includes top properties, detailed and summarised listing historical data, trend report, weekly pacing report and downloadable custom data which can be delivered on a daily, weekly, monthly or quarterly basis.    

SeeTransparent

SeeTransparent allows users to create custom groups based on filters such as more precise location, best reviewed listings, bathroom counts, amenities or luxury listings. These custom groups are useful to property investors in finding the best type of properties to invest in. They can also use the tool mentioned above for property operators to estimate returns on specific properties which they have shortlisted.

By tracking the market supply and performances of individual listings in specific regions on their dashboards, property investors can decide if there is still a demand for short-term rental in those regions.     

Alltherooms Analytics

Alltherooms Analytics provides market data such as ADRs, occupancy rates and revenue on different property types and locations. These data are essential for property investors to find out the demand of STRs in various locations. Alltherooms Analytics also came up with a calculator to determine the profitability of a short-term rental property, with easy-to-fill parameters such as street address, number of guests who can stay, number of bedrooms and number of bathrooms. 

Beside the real-time data, the company provides up to four years of historical data and where property investors can do their forecast based on those data. 

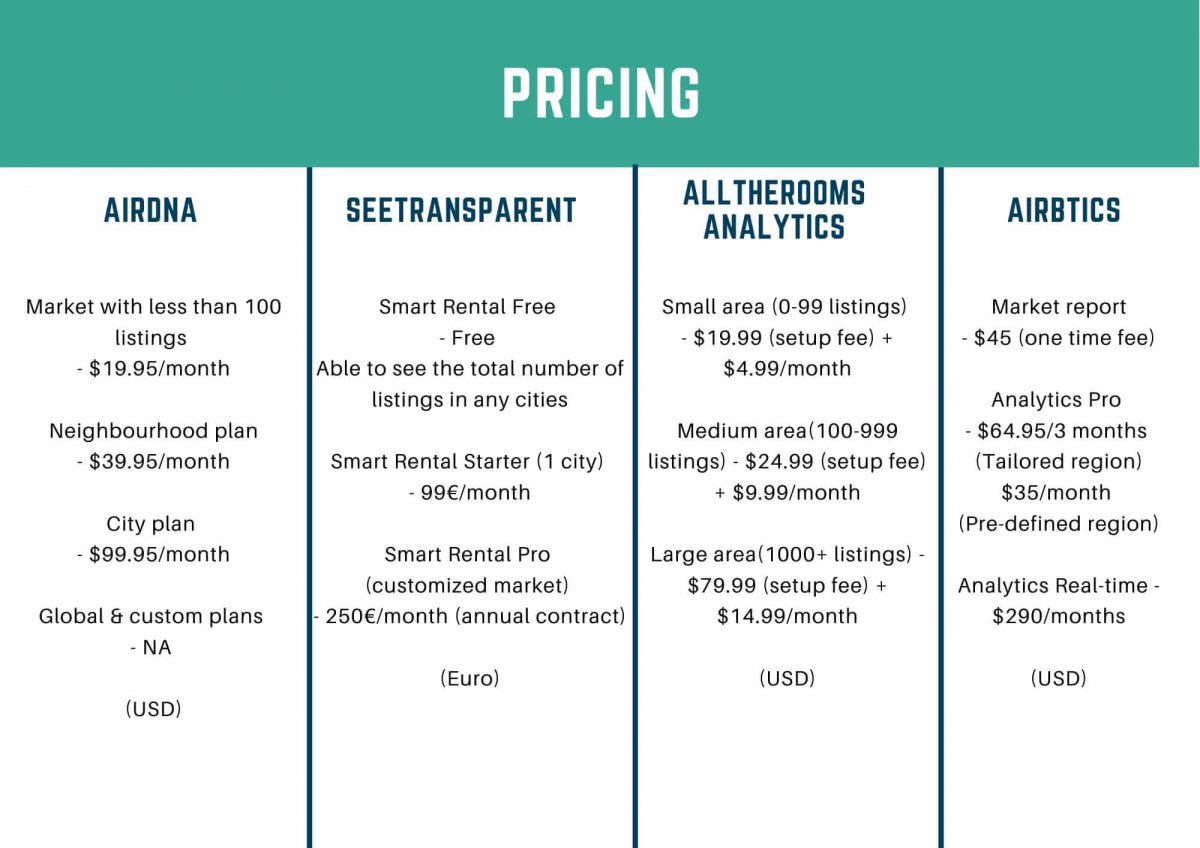
Pricing

AirDNA, SeeTransparent and Alltherooms Analytics offer solutions for enterprises and the prices depend on the types of customized data the clients are looking for, thus, not mentioned below.

User Experience

It is important to have a platform that is easy to navigate, where users can find the data that they need with ease. 

Airbtics

  • Dashboard is well-labelled and organized
  • FAQ button available at the top of the page in case the users have some general queries about the platform
  • Able to switch between 3 different currencies (USD, Euro, Pound)
  • Free trial version available for users to use

AirDNA

  • Automated chatbots on their website can be useful when users are unable to find what they are looking for
  • Dashboard is well-labelled and organized
  • Able to switch between 2 different currencies (USD and Pound)
  • Free trial version available for users to use

SeeTransparent

  • Automated chatbots on their website can be useful when users are unable to find what they are looking for
  • Dashboard is well-labelled and organized
  • Information on dashboard available in 3 different languages (English, Spanish, French)
  • Useful to have the breakdown of number of listings from different booking channels on the main page of dashboard 
  • Free trial version available for users to use

Alltherooms Analytics

  • Dashboard is well-labelled and organized
  • Some data on dashboard does not load well
  • Able to switch between 9 different currencies (Canadian dollar, Indian rupee, Euro, Mexican peso, Brazilian real, USD, Pound, Australian dollar, South African rand)
  • Free trial version available for users to use
Categories
Case Studies

The rise of Domestic Tourism in 2020 and How to leverage data to increase tourism in your city

Table of Contents

How has Covid-19 affected international tourism?

There is an estimated decline of 58% to 78% on international tourist arrival this year due to the Covid-19 pandemic, as stated by UNWTO. With planes forced to stop flying and borders closed between countries, people have no choice but to stay put. Looking at the current situation, international travel does not seem to be going back to normal any time soon and people have gradually turned to domestic travel. There are several cities that managed to recover economically from the pandemic through domestic tourism.

Increase in domestic tourism

Although international tourism may be essential for a greater growth in future, domestic travel will help to achieve more sustainable tourism revenue all year round, especially when faced with potential seasonal and regional restrictions.

Domestic vs. International Tourists in Ireland

Based on our data from Airbtics, Ireland, for example, has been facing a constant drop on the number of international tourists from September 2019 onwards. On the other hand, the graph shows an upward trend on the number of domestic tourists, and it surpasses the number of international tourists in April 2020. Tourism Northern Ireland highlighted the importance of their marketing efforts targeting the domestic market as domestic tourism has contributed to 31% of the country’s tourism revenue in 2018 and there is a further increase in domestic travel by 7% from 2018 to 2019, based on the Northern Ireland Statistics and Research Agency (NISRA).

In Australia, our research data have shown that Covid-19 did have a massive impact on the ratio of domestic and international tourists, beginning from April 2020. However, it also shows the percentage of domestic travel in the country has constantly been higher, even before the pandemic. Hence, by designing good marketing campaigns to tap on the domestic trend may help to boost the tourism revenue.

Surge in staycations

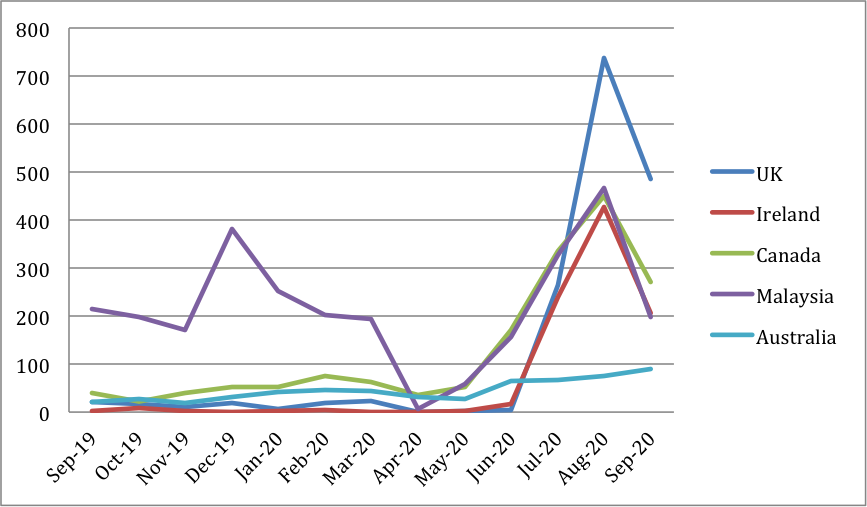
There has been a growing interest in staycation, where locals choose to stay in other accommodations in their country. This is apparent from June 2020, after the lockdown period in most countries. According to our data on Airbnb bookings, the countries that show the greatest surges in staycation are the United Kingdom, Ireland, Canada, Malaysia and Australia.


Number of people on staycation

The above graph shows the number of times the word ‘staycation’ was mentioned, pulled from every 1,000,000 Airbnb guest reviews in the UK, Ireland, Canada, Malaysia and Australia. From the risen trend of mentions from June across all five countries, it is likely that many of these Airbnb guests have turned to domestic travel for their summer vacations. 

Gain Exclusive Insight

Take a look at how DMOs and Travel Boards are utilising data to adapt to the change and increasing visitors to their destinations

How do some DMOs adapt to the change?

We have seen many DMOs that initiated marketing campaigns by introducing their digitalized platforms to stay connected with their fellow consumers. An example of this is the Singapore Tourism Board (STB), who aims to promote domestic tourism by introducing digitalized experiences and partnering with various organizations that share similar target audiences. One of the partners includes Airbnb Experience, where they worked together to introduce virtual tourism experiences on the attractions in Singapore. STB also has a seven months long collaboration with Klook this September, where they encourage locals to take on adventures and explore a different side of Singapore


A similar campaign was also carried out in the United Kingdom. Visit England partnered up with DMOs across the country, where they started the “Escape the everyday” campaign in September. On their platforms, they share different types of things to do across regions, with the hope to boost domestic travel through this autumn and winter. Moreover, social media influencers are engaged in their promotions, which may appeal to the younger crowd and motivate them to join in the domestic tourism trend.


It is important for DMOs to be aware of the changes before they can adapt to them. So first, identify the trends and target markets frequently. From there, anticipate their needs and wants, which would then help in curating effective marketing strategies. Airbtics possesses a huge amount of data related to short-term rentals around the world. We provide our clients with up-to-date information based on their needs, such as the most popular regions amongst visitors, top few origins of visitors that are visiting the city, the amount they spend on accommodations, their travel expectations and much more. 

What should DMOs do to boost tourism?

DMOs act as a platform between suppliers and consumers on what their city has to offer. In brief, there are five key points for DMOs to effectively increase the number of visitors.

  1. Identify the majority profiles of people visiting at different time points

This is the most basic yet crucial step. Knowing your market, it is like fishing where the fish are. Our team has spoken with multiple DMOs over the past few months who shared insights on the difficulties in getting specific data such as the top three guests’ origins who are visiting their cities. Hence, many resorted to getting the rough gauge of their visitors’ profiles by means of guessing. Airbtics uses Artificial Intelligence (AI) technology in getting data of visitors through Airbnb reviews. We are able to get the data for any regions specified by our clients for as low as $65 per month. Feel free to have a read on our free case study to help you get a better understanding on how we can help tourism boards attract visitors through a cost-effective and smart way.     

  1. Understand and anticipate the needs and wants of your target market

By keeping your organisation updated with the latest travel and market trends, you can better understand what people are looking for and how you can market your products as best befits the needs of your consumers. Numbers speak louder than words, with access to real time data from Airbtics such as the increase in usage of “staycation” amongst guests helps in the realisation of trends. Domestic tourism has great potential and is proven to be a viable market, hence DMOs should consider looking at it as more than a short-term plan.

  1. Ensure your website is up to date with credible and relevant information

In this digital age where people look for most information online, it is essential to have a one-stop website with an abundance of credible and relevant content as well as direct links to local businesses that is neatly categorised, easy to navigate and highly accessible via online search engines.

  1. Take advantage of the social media tools

With the growing number of people on social networking these days, being active and responsive on social media platforms help to drive traffic and build rapport with consumers, thereby, gaining their trust. The great thing is the possibility to reach out to the market and gain awareness through organic marketing strategies. That is the beauty of technology!

  1. Collaborate with other organisations to reach out to bigger audiences

Through partnerships with other organisations, it would benefit both parties that are working towards a common goal in bringing out more innovative ideas, reaching out to more people and gaining access to larger amounts of databases, which would be helpful for future marketing.

Gain Insider Access

Take a look at how DMOs and Travel Boards are utilising data to adapt to the change and increasing visitors to their destinations

Free Webinar

Learn Airbtics in 7 Minutes

Revenue and market analysis Tips and Best Practices!
Airbnb Data
Airbnb Data

ARE YOU IN?

Get Access to our weekly data-driven airbnb report!