





South Korea 최고의 에어비앤비 시장 (2026년)

September 2025 to August 2026 기간의 Airbtics 데이터를 바탕으로 제작된 이 페이지는 South Korea의 에어비앤비 투자 최적지를 보여줍니다. 단기 임대 규제, 숙소 수, 예약률, 평균 일일 요금(ADR) 및 연간 수익과 같은 핵심 통계와 인사이트를 확인하세요. 이를 통해 South Korea에서 에어비앤비 숙소를 투자, 매수 및 운영하기에 가장 수익성이 높은 도시를 찾을 수 있습니다.

이 페이지의 시장은 숙소 수가 아니라 Airbtics 시장 등급으로 정렬됩니다. 등급은 이 순위의 다른 시장과 수익률, 수익 성장, 예약률(수요)을 비교한 뒤 단기 임대 규제에 따라 조정됩니다.

  1. 수익률: 연간 단기 임대 수익을 부동산 가격으로 나눈 값입니다. 수익률이 높을수록 순위가 높습니다.
  2. 성장: 수익의 전년 대비 변화입니다. 수익 성장이 빠를수록 순위가 높습니다.
  3. 수요: 최근 12개월 평균 예약률입니다. 예약률이 높을수록 순위가 높습니다.
데이터 수집 및 정확성에 대해 자세히 알아보기

최종 업데이트: 16th October, 2026

South Korea 단기 임대 시장 개요 (2025년 전체 분석)

South Korea 전체 시장의 국가 평균값
평균 예약률 i
48.58%
평균 연간 수익 i
₩18,645,737
평균 일일 요금 (ADR) i
₩101,679
공급 성장률 (YoY) i
43.21%
수익 변화율 (YoY) i
-1.24%

2026년 에어비앤비를 위한 South Korea 내 Top 12개 도시

추적 순위 시장 등급 시장 이름 규제 숙소 수 평균 예약률 평균 일일 요금 수익 임대 수익률 수익 성장률
1BJeju Island
Strict
11,73859%₩112,609₩24,906,61611.9%+8.1%
2BGyeongju
Strict
2,04745%₩139,106₩23,543,37618.7%-1.2%
3BJeonju
Strict
1,48937%₩83,463₩11,586,87512.7%-8.7%
4BDaejeon
Lenient
81059%₩76,839₩17,027,911Unlock in Market ExplorerUnlock in Market Explorer
5B+Busan
Strict
6,32667% 🚀₩108,635₩27,222,401Unlock in Market ExplorerUnlock in Market Explorer
6CSeoul
Lenient
17,74983% 🚀₩112,609₩34,727,506Unlock in Market ExplorerUnlock in Market Explorer
7CGangneung
Strict
2,05843%₩124,533₩20,180,983Unlock in Market ExplorerUnlock in Market Explorer
8CYeosu
Strict
1,61631%₩91,412₩10,678,049Unlock in Market ExplorerUnlock in Market Explorer
9C+Daegu
Strict
1,13650%₩74,189₩14,064,289Unlock in Market ExplorerUnlock in Market Explorer
10DSokcho
Lenient
1,02937%₩88,762₩12,400,315Unlock in Market ExplorerUnlock in Market Explorer
11D+Incheon
Strict
2,21441%₩79,489₩12,432,110Unlock in Market ExplorerUnlock in Market Explorer
12D+Geoje
Lenient
77331%₩128,507₩14,978,414Unlock in Market ExplorerUnlock in Market Explorer

Data Seen By

인터랙티브 도구로 최고의 에어비앤비 시장 찾기

Airbtics의 인터랙티브 시장 탐색기를 사용하여 South Korea에서 에어비앤비를 시작하기 가장 좋은 장소를 찾아보세요. 여러 시장을 나란히 비교하고 규제, 예산(부동산 가격 또는 월세), 시장 규모별로 필터를 적용하고 결과를 엑셀로 내보낼 수도 있습니다.

인터랙티브 도구 탐색하기

2026년, 왜 South Korea 에어비앤비에 투자해야 할까요?

최근 몇 년 동안 South Korea은 유명 관광지, 활발한 비즈니스 활동, 증가하는 디지털 노마드, 그리고 Jeju Island, Gyeongju and Jeonju와 같은 활기찬 도시들 덕분에 단기 임대 투자의 핵심 지역으로 급부상했습니다. 매년 수백만 명의 해외 방문객이 유입되면서 휴가용 숙소에 대한 수요가 급증하고 있으며, 이는 South Korea 에어비앤비를 국내외 투자자 모두에게 매력적인 수익 창출 기회로 만들고 있습니다.

강력한 여행 수요 덕분에 South Korea의 주요 에어비앤비 시장은 경쟁력 있는 평균 일일 요금(ADR), 안정적인 예약률, 매력적인 수익 잠재력을 제공합니다. 소자본으로 첫 에어비앤비 사업을 시작하든, 포트폴리오에 고급 숙소를 추가하든, South Korea은 투자자의 예산과 목표에 맞는 다양한 수익 기회를 갖추고 있습니다.

Top 3 Airbnb markets in South Korea by Market Grade

These are the three highest-graded Airbnb markets in South Korea. Market Grade compares yield, revenue growth, and occupancy (demand) with the other markets on this page, then adjusts for short-term rental regulation. The chart repeats those three percentiles in text so the ranking is readable without the graphic.

Rank 1 — Jeju Island (Grade B)

Jeju Island is rank 1 of 12 markets in this South Korea ranking by Airbtics Market Grade B, with 11.9% short-term rental yield, 59.0% occupancy, and +8.1% year-over-year revenue growth.

Compared with the other markets on this page, Jeju Island ranks top 29% for yield, top 29% for growth, and top 25% for demand. The market shows an average daily rate of ₩112,609, annual revenue of ₩24,906,616, a rent gap of 3391.4%, 11,738 active listings, strict short-term rental regulation, and a typical 2-bedroom property price of ₩331,205,000.

  • Market gradeB
  • Yield11.9%
  • Revenue growth+8.1%
  • Occupancy59.0%
  • Average daily rate₩112,609
  • Annual revenue₩24,906,616
  • Rent gap3391.4%
  • Active listings11,738
  • 2-bedroom price₩331,205,000
  • RegulationStrict
top 29%Yieldtop 29%Growthtop 25%Demand

Percentile versus other South Korea markets on this page. Farther from the center is stronger.

  • Yield: top 29%
  • Growth: top 29%
  • Demand: top 25%

Rank 2 — Gyeongju (Grade B)

Gyeongju is rank 2 of 12 markets in this South Korea ranking by Airbtics Market Grade B, with 18.7% short-term rental yield, 45.0% occupancy, and -1.2% year-over-year revenue growth.

Compared with the other markets on this page, Gyeongju ranks top 4% for yield, top 46% for growth, and top 46% for demand. The market shows an average daily rate of ₩139,106, annual revenue of ₩23,543,376, a rent gap of 5522.6%, 2,047 active listings, strict short-term rental regulation, and a typical 2-bedroom property price of ₩198,723,000.

  • Market gradeB
  • Yield18.7%
  • Revenue growth-1.2%
  • Occupancy45.0%
  • Average daily rate₩139,106
  • Annual revenue₩23,543,376
  • Rent gap5522.6%
  • Active listings2,047
  • 2-bedroom price₩198,723,000
  • RegulationStrict
top 4%Yieldtop 46%Growthtop 46%Demand

Percentile versus other South Korea markets on this page. Farther from the center is stronger.

  • Yield: top 4%
  • Growth: top 46%
  • Demand: top 46%

Rank 3 — Jeonju (Grade B)

Jeonju is rank 3 of 12 markets in this South Korea ranking by Airbtics Market Grade B, with 12.7% short-term rental yield, 37.0% occupancy, and -8.7% year-over-year revenue growth.

Compared with the other markets on this page, Jeonju ranks top 12% for yield, lowest 38% for growth, and lowest 25% for demand. The market shows an average daily rate of ₩83,463, annual revenue of ₩11,586,875, a rent gap of 3714.0%, 1,489 active listings, strict short-term rental regulation, and a typical 2-bedroom property price of ₩198,723,000.

  • Market gradeB
  • Yield12.7%
  • Revenue growth-8.7%
  • Occupancy37.0%
  • Average daily rate₩83,463
  • Annual revenue₩11,586,875
  • Rent gap3714.0%
  • Active listings1,489
  • 2-bedroom price₩198,723,000
  • RegulationStrict
top 12%Yieldlowest 38%Growthlowest 25%Demand

Percentile versus other South Korea markets on this page. Farther from the center is stronger.

  • Yield: top 12%
  • Growth: lowest 38%
  • Demand: lowest 25%

시장 포화도 분석: South Korea

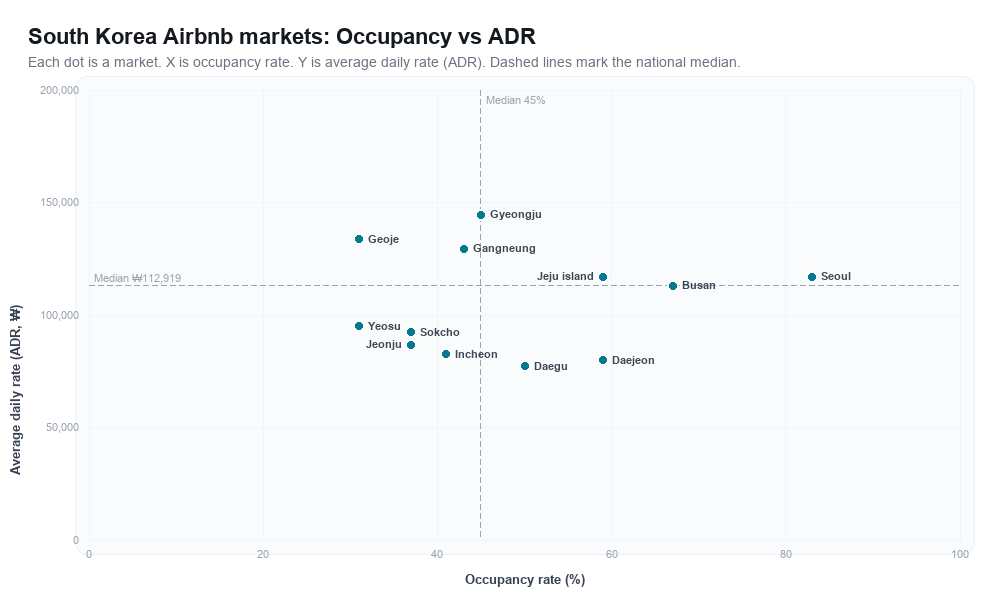
Each dot is a vacation rental market in South Korea, plotted by occupancy rate (x-axis) and average daily rate (ADR) (y-axis). Dashed lines mark the national median.

South Korea Airbnb markets rankboard scatter chart showing occupancy rate versus average daily rate (ADR)
Occupancy rate and average daily rate for each South Korea market plotted in the chart above, in Market Grade order.
MarketOccupancy rateAverage daily rate
Jeju Island59.0%₩112,609
Gyeongju45.0%₩139,106
Jeonju37.0%₩83,463
Daejeon59.0%₩76,839
Busan67.0%₩108,635
Seoul83.0%₩112,609
Gangneung43.0%₩124,533
Yeosu31.0%₩91,412
Daegu50.0%₩74,189
Sokcho37.0%₩88,762
Incheon41.0%₩79,489
Geoje31.0%₩128,507

Compare property prices, short-term rental yield, rent gap, annual revenue, and supply growth in the Airbtics Market Explorer watchlist.


South Korea 에어비앤비 예상 수익 확인하기


South Korea에서 가장 수익성 높은 단기 임대 투자 기회를 찾을 준비가 되셨나요?

Airbtics 에어비앤비 수익 계산기를 사용하여 모든 도시와 동네의 수익 잠재력과 투자 수익률을 쉽고 정확하게 추정해 보세요.

에어비앤비 수익 계산기 사용하기

시장 트렌드, 공급, 전년 대비 변화가 궁금하다면 South Korea 2025년 단기 임대 시장 보고서를 읽어 보세요.