 Airbtics | Airbnb Analytics
Precise Short-term Rental Analytics
Airbtics | Airbnb Analytics
Uncover hidden gems, boost revenue, and optimize your strategy today by doing an Airbnb submarket analysis!
[elementor-template id=”61228″]
You and your friend have both acquired Airbnb properties in the same city. But you’re wondering why the hell they earn far better than you?
A lot of factors can play a role in this scenario. Did the two of you buy your investment properties in the same neighborhood? Do they have the same number of bedrooms? Did both of you buy apartments instead of houses? Answering these questions gives you insights into the real estate submarket! And who knows? Maybe they have done a submarket analysis!
An Airbnb submarket operates quietly beneath the surface, often hidden from the average investor’s view. Just like the real estate submarket in general, the short-term rental submarket opens up a whole new world of opportunity for investors.
So if you’re looking to sharpen your investment strategy and unlock untapped potential, don’t make the same mistake twice! It’s time to delve into the submarket in real estate.
An Airbnb submarket is a smaller segment of the bigger Airbnb market. It can be a neighborhood, property size, and property type.
Airbnb submarket analysis breaks comprehensive data into smaller and more manageable components. They are no different from a submarket in real estate. They also give investors a more focused analysis of various factors within the larger market.
This real estate submarket is composed of a more specific set of players. In other words, these players are your direct competitors! They not only provide the same offerings as you. They may also boast properties situated within the same neighborhood as yours.
In this part, you’ll learn how to do an Airbnb submarket analysis on the following levels:
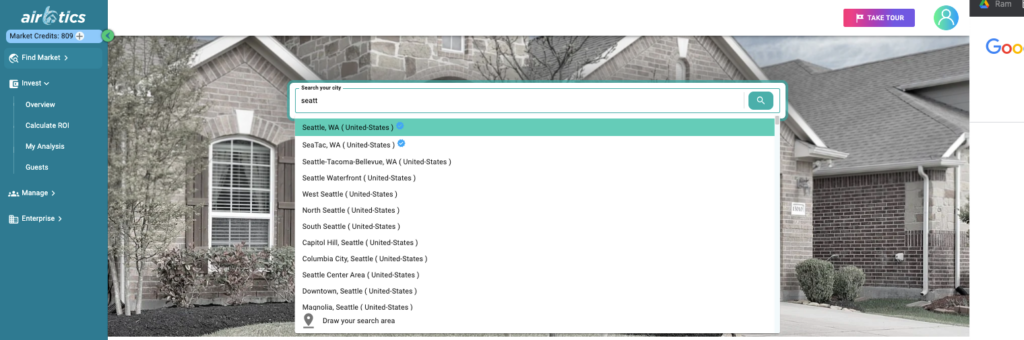
But let’s start with your preferred Airbnb market first. Remember that cities are the Airbnb markets. So, type in the city name on the Airbtics’ Insights Tab.
To show how this works, let’s use the Seattle Airbnb market as an example.
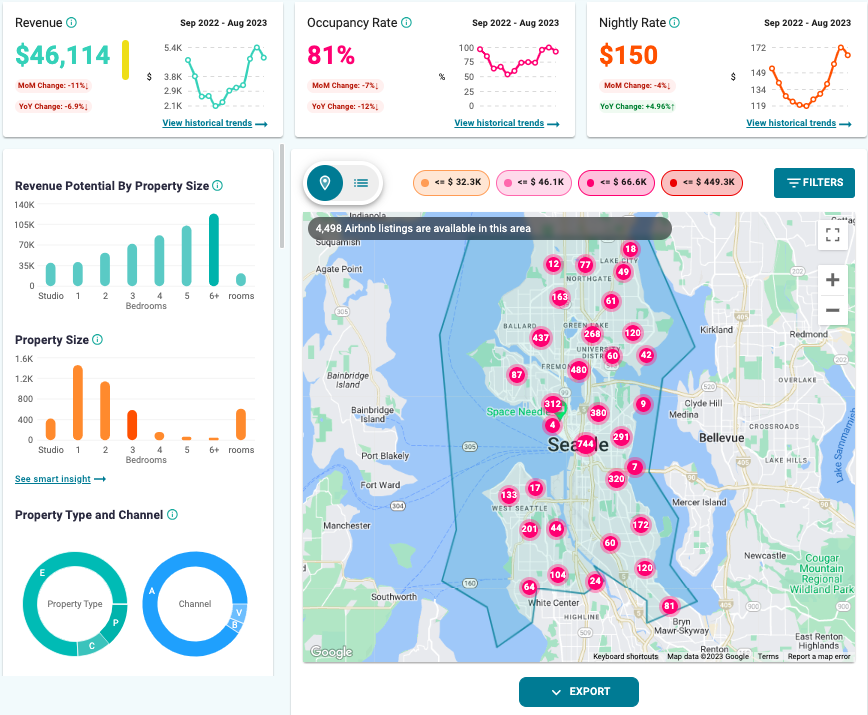
With a staggering 4,498 active listings, Seattle undeniably boasts a thriving Airbnb market. Using the Insights Tool, you can also see the following key metrics:
However, if you currently own or are contemplating a short-term rental in the city, navigating through 4,498 listings may seem like sifting through noise.
We will break this down via an Airbnb submarket analysis!
On the Airbtics Dashboard, you can do a submarket analysis by zooming in and exploring an Airbnb market. And get data updates in real-time. This feature empowers you to meticulously analyze different neighborhoods or geographical real estate submarkets.
We assure you that you cannot find this feature elsewhere!
Pro tip: Areas with the reddest points signal listings with the highest revenue, so zoom into those!
As you have seen from our example, the Seattle Airbnb market has an average annual revenue of $46,114.
But swiftly zooming into the Queen Anne Airbnb submarket, the annual revenue is $58,328. An Airbnb submarket analysis has given us a whopping $12,214 or 26.49% difference!
You can effortlessly sketch out your own Airbnb submarket, whether or not it aligns with official geographical boundaries. You can do this via the Custom Market feature. Your own submarket will be “bookmarked” and saved in your account for you to closely monitor data trends!
While neighborhoods are a common way to define submarkets, property types represent another layer of this segmentation. Airbnb property types refer to the various categories of accommodation – ranging from entire houses and apartments/condos to private and shared rooms.
You may remember that Seattle Airbnb Market has 4,498 active listings. But using the Advanced Filters, you can do an Airbnb submarket analysis according to property type. For this example, let’s see the entire homes and apartments/condos:
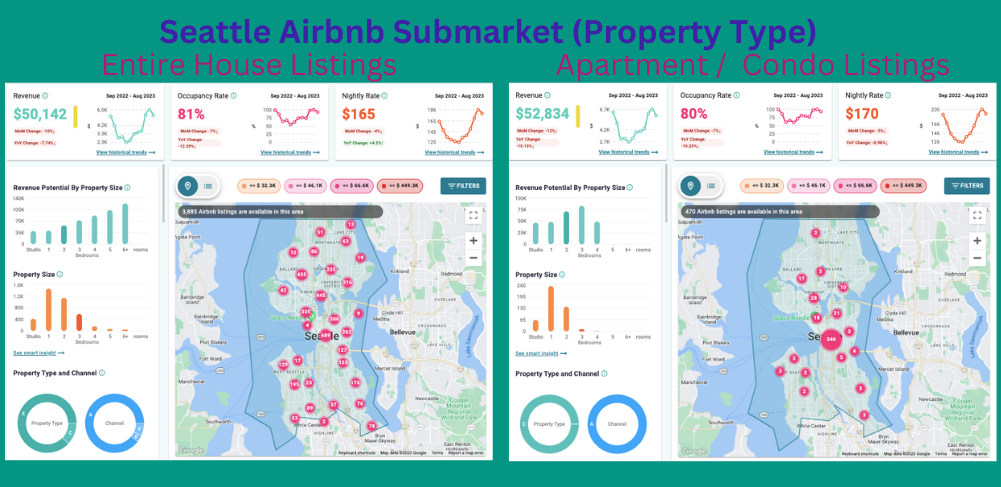
The Seattle entire house submarket has 3,885 listings. They have an average annual revenue of $50,142 and an 81% occupancy rate. On the other hand, there are 470 Airbnb apartments/condos in Seattle.
While these are a lot fewer, apartments/condos have a higher average annual revenue of $52,834. Their average occupancy rate may be lower, but only by 1%. They also charge $5 more with an average nightly rate of $170.
Seattle Entire House
Seattle Apartment/Condo
The number of bedrooms also plays a key role in any real estate submarket. Investors and hosts use this number as a primary category tool to tailor their listings to specific market preferences.
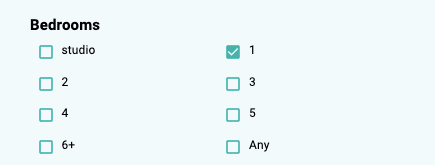
It’s just the same drill on the Airbtics Dashboard. You may use the Advanced filters to sort the data according to number of bedrooms. The Airbnb submarket analysis provided us the following insights:
In other words, you might charge more per night, but you might have fewer bookings over time. Finding the right balance between the number of bedrooms, nightly rate, and occupancy is key to optimizing your Airbnb rental strategy.
To know more about the complexities of this numbers game, read “What is the Best Number of Airbnb Bedrooms?” where you’ll learn the optimal property size in your market.
After figuring out how submarket analysis works, you’re ready to take your real estate game to the next level! You will not commit the same mistake twice. You can now find the best of the best properties using Airbnb submarket analysis!
With Airbtics‘ powerful Insights Tool, you can dive deep into your chosen Airbnb market, exploring real-time data updates and discovering hidden gems within neighborhoods. The ability to zoom in and analyze Airbnb submarkets is a game-changer. This allows you to make more informed investment decisions with granularity.
What’s more? Airbtics app covers 54,000 global markets, so you can analyze any of your properties anywhere. Sign up and get free access to the following data:
[elementor-template id=”61999″]
[elementor-template id=”61999″]
[elementor-template id=”74925″]
[elementor-template id=”62160″]
[elementor-template id=”62200″]