 Airbtics | Airbnb Analytics
Precise Short-term Rental Analytics
Airbtics | Airbnb Analytics
Follow or leverage Airbnb demand in any area with these easy-to-use tips to up your short-term rental game!
[elementor-template id=”61228″]
Whether you’re a curious host or an investor expanding your horizon, you’ll ask yourself, “Is there Airbnb demand in my area?” In an age where accommodation preferences change rapidly, harnessing the power of insights is of utmost importance. Understanding Airbnb demand in your area allows you to position yourself for short-term rental success.
With the help of easy-to-use rental data, you can learn to transform insights into actionable steps that set you up for success. This article will cover the following:
Airbnb demand refers to the level of interest measured by booking activity for Airbnb accommodations in a specific area. It represents the number of guests seeking short-term rentals and their willingness to book accommodations through the Airbnb platform.
As an investor or host, you want to keep this demand up. But how can you do it? In the next section, we’ll show you where you are in terms of demand. And later, we’ll teach you how to leverage this to your advantage.
You can use the average occupancy rate of the market to gauge the Airbnb demand in your area. The easiest way to do this is by using rental analytics. Airbtics Insight’s Tool allows you to access valuable data points of any Airbnb market. These include the average occupancy rate, revenue potential, and nightly rate of all short-term rental listings in your area. Simply input your city, and you can instantly see the figures that will inform your Airbnb business plan.
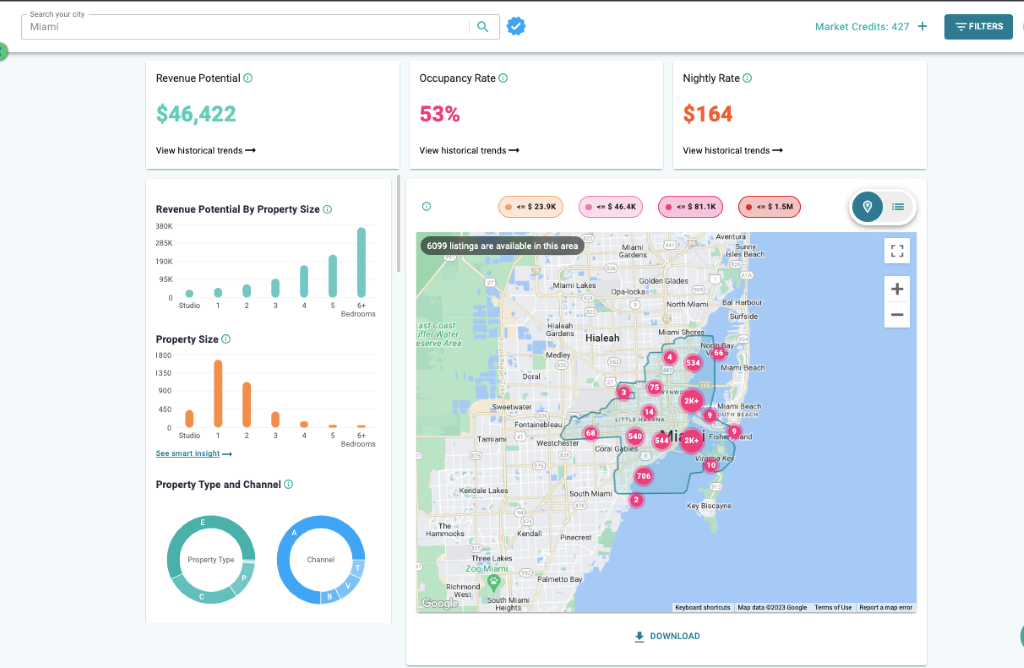
With 6,099 active listings, Miami is indeed a vast Airbnb market. And if you have or plan to have a short-term rental in the city, you might consider most of these listings as noise.
Once you have typed in your city, you can zoom into the map on the Insights Tool. As you drag and move the map, the data will update according to all listings visible in the area. The Dynamic Data feature will allow you to compare Airbnb demand in smaller areas like neighborhoods. This is an active approach for Airbnb investors to look for the smaller areas with the highest occupancy rates in their target city.
If you’re a host or even an investor who wants to ”bookmark” your neighborhood, you can do that with the Custom Market feature of the Insights Tool. Just draw the map of your smaller Airbnb market, and it will be saved in your account. This will allow you to monitor your neighborhood and understand its trends with ease.
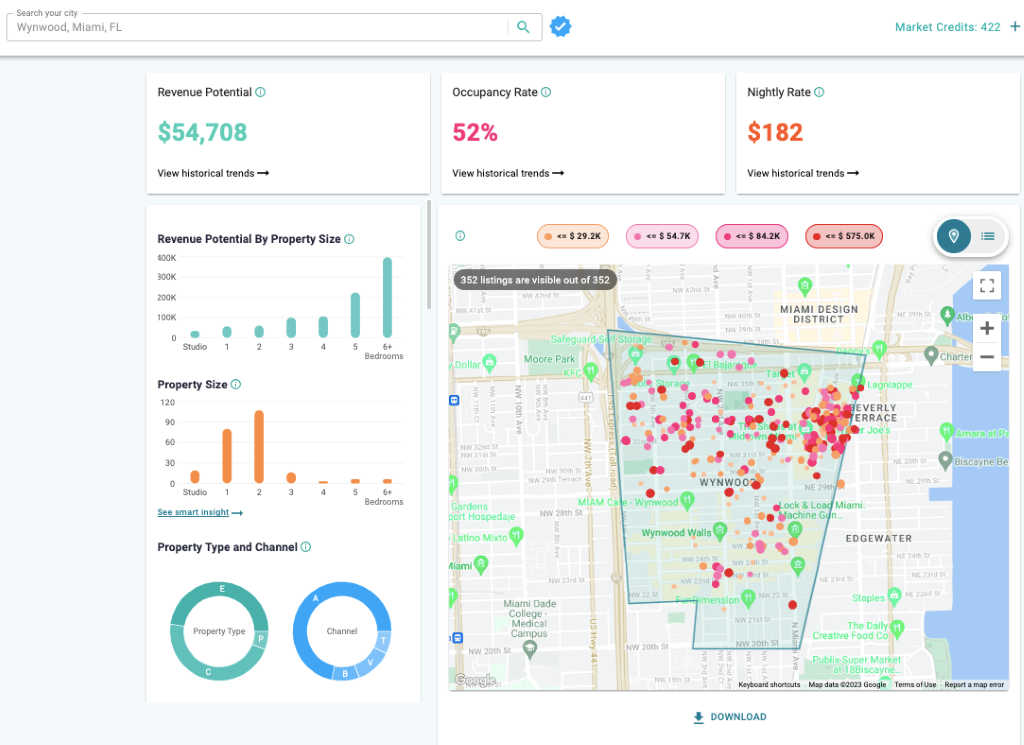
The powerful Insights Tool allows you to combine these two features. You can make a Custom Market and use the Dynamic Data feature at the same time. It’s just the same drill: Draw a map of your own market and drag it around for more location-specific Airbnb data!
This duo will help you compare your Airbnb metrics against your closest competitors. And this will allow you to know how the other side of your neighborhood is doing. Plus, you will even see the Airbnb data of your block if you zoom in enough!
The local Airbnb demand in your area is determined by various factors. These shape the travelers’ decisions when choosing an accommodation. So, it’s wise to understand the following factors. They will help choose an Airbnb area or optimize your existing Airbnb listing.
1. Location – As in all forms of real estate, the proximity to business centers and tourist attractions can affect Airbnb demands. It can attract more guests as proximity offers convenience.
2. Seasonality – This just means the fluctuations of booking patterns throughout the year. Especially in vacation markets, understanding seasonal trends can help you manage your expectations. This may include the changing seasons. Summer is the peak season, while winter is the downtime. Local events such as festivals and international conferences can also affect seasonality, especially when they are held annually.
3. High economic activities – The economic condition of your area can also drive Airbnb demand. Previously we talked about vacation markets, now we are mainly referring to urban markets. Urban markets attract business travelers who come all year round to leading financial districts.
4. Local Regulations – The Airbnb rules and regulations in your area can impact demand. Short-term rental-friendly cities can induce demand for Airbnb. On the other hand, those with stricter laws can shift travelers from Airbnb to hotel accommodations.
Leverage this crucial information and make it work to your advantage. Here are a few ways:
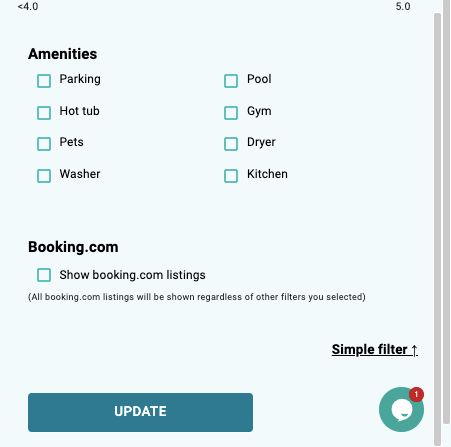
There are markets that have higher occupancy rates because of the amenities of their listings. Whether simply installing a hot tub or digging up a hole in your yard for a swimming pool, any of these can definitely make a dent in your occupancy rate.
To know which Airbnb feature increases the occupancy rate in your market, the Advanced Filter of the Insights Tool. As you tick the amenity, you will find out which of these has the best impact!
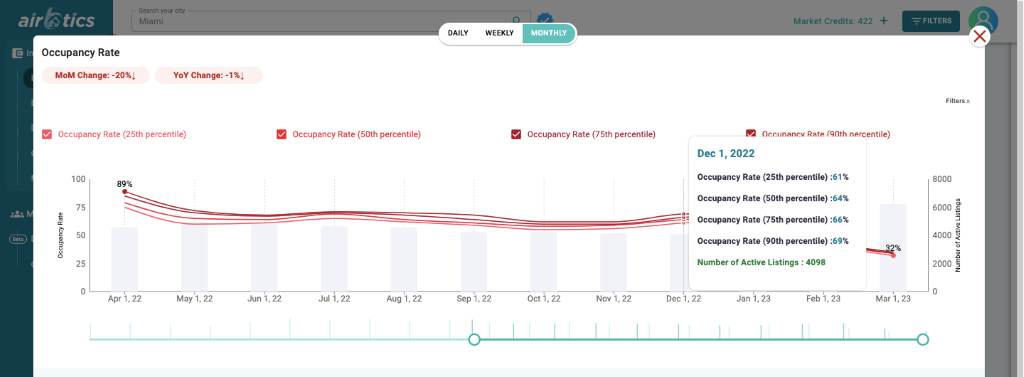
The good thing about Insight’s Tool is its historical data feature. Therefore, you can see the months when Airbnb demand in your area is high. As an example, let’s take a look at Miami’s Airbnb data.
As you can see, the local demand in Miami was high in December and dropped to its lowest in March.
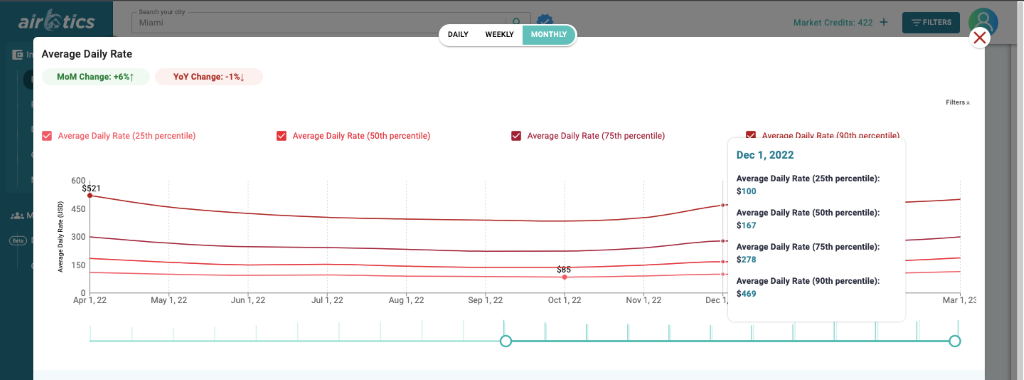
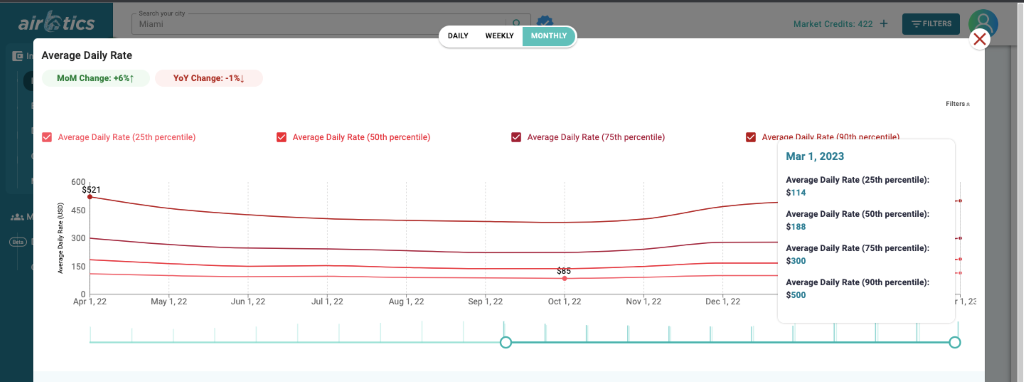
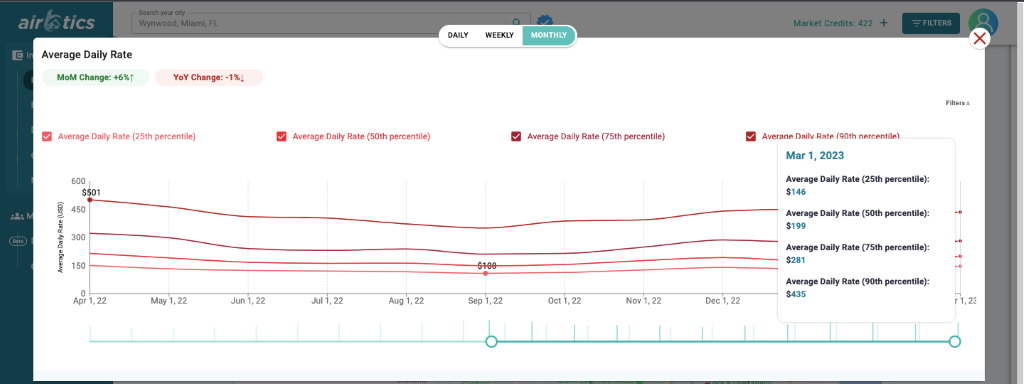
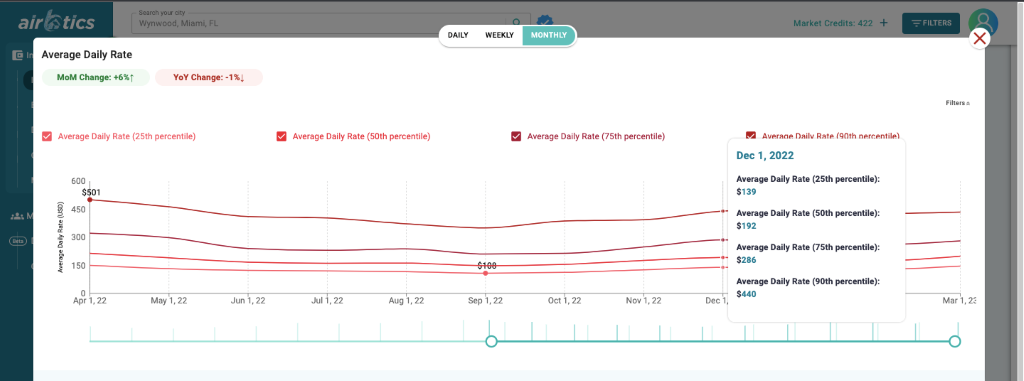
After finding out about this trend, you can gain insights from the historical data of the Average Daily Rate in Miami. We can clearly see 50th percentile of ADR in March ($188) is $21 more compared to December ($167). So while March had the lowest occupancy rate, Airbnb hosts were still able to cash in more compared to their high-demand season.
You can also access the historical data feature in your custom market. And same is the case in our sample market, Wynwood, Miami. December had a 63% occupancy rate, compared to 32% in March (both 50th percentile).
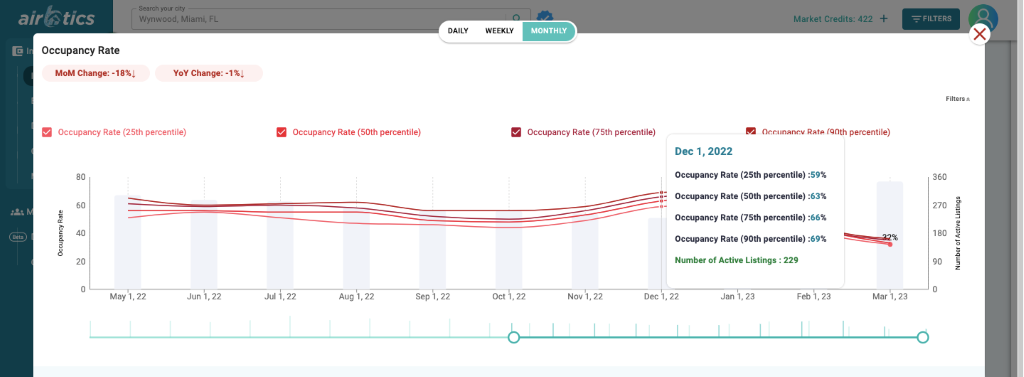
And Wynwood hosts were still able to price more – although not considerably compared to the Miami market.
LOOKING FOR THE BEST CITIES TO INVEST IN AIRBNB OUTSIDE THE US?
Discover other top grossing Airbnb locations outside the US!
Knowing the Airbnb demand in your area is a crucial factor for both hosts and investors wanting success in the short-term rental market. This article has just shown how to leverage Airbnb demand and how it interplays with other factors such as location, seasonality, and local activities.
The Airbtics’ Insights Tool not only empowers you to discern trends at a citywide level. It also zooms in on neighborhoods, providing granular insights that enable you to make informed decisions even at a micro-level.
Furthermore, the integration of Airbtics’ Historical Data feature equips you with a forward-looking perspective. This empowers you to strategically price your Airbnb listings, avoiding the common pitfall of underpricing during periods of lower demand.
The case study of Miami’s market fluctuations exemplifies how hosts were able to maintain competitive pricing even during the off-peak season, resulting in maximized revenue.
In a landscape as dynamic as the short-term rental market, staying ahead requires a multifaceted approach. The fusion of data-driven insights, market understanding, and strategic decision-making holds the key to positioning yourself for success.
By consistently evaluating and responding to Airbnb demand in your area, you can confidently navigate the evolving hospitality landscape and seize opportunities that align with your aspirations. It’s all within reach, whether achieving high occupancy rates, increasing revenue, or enhancing guest experiences. The journey towards short-term rental success begins with understanding and leveraging Airbnb demand to your advantage.
Got a short-term rental, and don’t know its maximum potential? Then check its profitability with the most advanced Airbnb Calculator!

[elementor-template id=”61999″]
[elementor-template id=”61999″]
[elementor-template id=”61124″]
[elementor-template id=”62160″]
[elementor-template id=”62200″]