










Mejores mercados de Airbnb en Mexico (2026)

Basado en los datos de Airbtics del periodo September 2025 to August 2026, esta página muestra las mejores ubicaciones de Airbnb para invertir en Mexico con estadísticas e información clave, como normativas de alquiler a corto plazo, número de anuncios, tasa de ocupación, tarifa diaria promedio e ingresos anuales. Esto le permite descubrir las ciudades más rentables para invertir, comprar y poseer propiedades de alquiler vacacional en Mexico.

Los mercados de esta página se ordenan por la calificación de Airbtics, no por el número de anuncios. La calificación compara rendimiento, crecimiento de ingresos y ocupación (demanda) con los demás mercados de esta lista, y luego ajusta por la regulación del alquiler de corta duración.

  1. Rendimiento: Ingresos anuales del alquiler de corta duración divididos por el precio de la propiedad. Un rendimiento más alto sube en el ranking.
  2. Crecimiento: Cambio de los ingresos respecto al año anterior. Un crecimiento más rápido sube en el ranking.
  3. Demanda: Tasa de ocupación media de los últimos 12 meses. Una ocupación más alta sube en el ranking.
Más información sobre cómo recopilamos los datos y su precisión

Última actualización: 16th October, 2026

Resumen del mercado de alquiler a corto plazo en Mexico (Análisis completo 2025)

Promedios nacionales en todos los mercados de Mexico
Tasa de ocupación promedio i
43.80%
Ingresos anuales promedio i
MXN284,119
Tarifa diaria promedio (ADR) i
MXN1,759
Crecimiento de la oferta YoY i
42.04%
Cambio en ingresos YoY i
8.06%

Top 60 ciudades en Mexico para Airbnb en 2026

Seguir Posición Grado del mercado Nombre del mercado Regulación Nº de anuncios Tasa de ocupación promedio Tarifa diaria promedio Ingresos Rendimiento del alquiler Crecimiento de ingresos
1AMexico City
Lenient
22,36865% 🚀MXN1,531MXN372,81514.6%+25.8%
2AMonterrey
Lenient
3,95948%MXN1,307MXN236,54413.5%+15.9%
3AMiguel Hidalgo
Lenient
3,26266% 🚀MXN2,017MXN497,09314.6%+27.6%
4ABenito Juarez
Lenient
2,03261%MXN1,195MXN273,811Unlock in Market ExplorerUnlock in Market Explorer
5ACoyoacán
Lenient
1,34160%MXN1,176MXN263,780Unlock in Market ExplorerUnlock in Market Explorer
6BGuadalajara
Lenient
6,11550%MXN1,158MXN218,032Unlock in Market ExplorerUnlock in Market Explorer
7BMérida
Lenient
5,41353%MXN1,139MXN227,148Unlock in Market ExplorerUnlock in Market Explorer
8BOaxaca de Juárez
Lenient
4,11144%MXN1,232MXN202,715Unlock in Market ExplorerUnlock in Market Explorer
9BZapopan
Lenient
2,42047%MXN1,363MXN240,598Unlock in Market ExplorerUnlock in Market Explorer
10BLa Paz
Lenient
1,95655%MXN1,494MXN309,863Unlock in Market ExplorerUnlock in Market Explorer
11BSanta Maria Colotepec
Lenient
1,83353%MXN1,587MXN314,253Unlock in Market ExplorerUnlock in Market Explorer
12BPlayas De Rosarito
Lenient
1,66533%MXN3,138MXN392,018Unlock in Market ExplorerUnlock in Market Explorer
13BGuaymas
Lenient
1,32637%MXN3,623MXN503,201Unlock in Market ExplorerUnlock in Market Explorer
14BRosarito
Lenient
97834%MXN3,082MXN397,435Unlock in Market ExplorerUnlock in Market Explorer
15B+Puerto Penasco
Lenient
3,12739%MXN4,240MXN627,423Unlock in Market ExplorerUnlock in Market Explorer
16B+Puebla
Lenient
2,36244%MXN859MXN142,771Unlock in Market ExplorerUnlock in Market Explorer
17B+Santa María Huatulco
Lenient
1,42145%MXN2,054MXN343,562Unlock in Market ExplorerUnlock in Market Explorer
18CBahia De Banderas
Lenient
7,13248%MXN2,876MXN512,747Unlock in Market ExplorerUnlock in Market Explorer
19CCoahuila De Zaragoza
Lenient
3,31034%MXN1,288MXN165,336Unlock in Market ExplorerUnlock in Market Explorer
20CCuernavaca
Lenient
3,07234%MXN2,316MXN295,853Unlock in Market ExplorerUnlock in Market Explorer
21CHeróica Puebla de Zaragoza
Lenient
2,37844%MXN859MXN142,771Unlock in Market ExplorerUnlock in Market Explorer
22CSantiago de Querétaro
Lenient
2,33149%MXN803MXN149,552Unlock in Market ExplorerUnlock in Market Explorer
23CLeón
Lenient
2,07637%MXN971MXN135,560Unlock in Market ExplorerUnlock in Market Explorer
24CMorelia
Lenient
1,81337%MXN934MXN130,909Unlock in Market ExplorerUnlock in Market Explorer
25CSayulita
Lenient
1,52252%MXN2,652MXN512,878Unlock in Market ExplorerUnlock in Market Explorer
26CEnsenada Mx
Lenient
1,32039%MXN1,830MXN269,459Unlock in Market ExplorerUnlock in Market Explorer
27CSan Luis Potosi
Lenient
1,25745%MXN896MXN152,316Unlock in Market ExplorerUnlock in Market Explorer
28CSan Miguel De Cozumel
Lenient
1,17950%MXN1,643MXN306,277Unlock in Market ExplorerUnlock in Market Explorer
29CChihuahua
Lenient
1,17344%MXN1,008MXN168,045Unlock in Market ExplorerUnlock in Market Explorer
30CIsla Mujeres
Lenient
94655%MXN2,278MXN468,625Unlock in Market ExplorerUnlock in Market Explorer
31CBacalar
Lenient
89744%MXN1,625MXN270,411Unlock in Market ExplorerUnlock in Market Explorer
32CBoca Del Rio
Lenient
78939%MXN1,475MXN216,800Unlock in Market ExplorerUnlock in Market Explorer
33CValladolid
Lenient
74337%MXN952MXN133,823Unlock in Market ExplorerUnlock in Market Explorer
34C+Guanajuato City
Lenient
9,87649%MXN1,176MXN217,155Unlock in Market ExplorerUnlock in Market Explorer
35C+Acapulco
Lenient
5,40936%MXN2,372MXN319,297Unlock in Market ExplorerUnlock in Market Explorer
36C+Mazatlan
Lenient
5,13537%MXN1,849MXN255,505Unlock in Market ExplorerUnlock in Market Explorer
37C+Zihuatanejo
Lenient
2,14938%MXN2,484MXN349,521Unlock in Market ExplorerUnlock in Market Explorer
38C+Tijuana
Lenient
2,02346%MXN1,419MXN247,435Unlock in Market ExplorerUnlock in Market Explorer
39C+Hermosillo
Lenient
1,74940%MXN1,046MXN158,443Unlock in Market ExplorerUnlock in Market Explorer
40C+Aguascalientes
Lenient
1,68140%MXN1,046MXN157,098Unlock in Market ExplorerUnlock in Market Explorer
41C+Manzanillo
Lenient
1,19037%MXN2,129MXN294,322Unlock in Market ExplorerUnlock in Market Explorer
42C+Tepoztlán
Lenient
1,17231%MXN1,699MXN200,978Unlock in Market ExplorerUnlock in Market Explorer
43C+Mexicali
Lenient
1,11236%MXN1,699MXN231,762Unlock in Market ExplorerUnlock in Market Explorer
44C+San Cristobal De Las Casas
Lenient
1,10540%MXN859MXN129,639Unlock in Market ExplorerUnlock in Market Explorer
45C+Boca del Rio Veracruz
Lenient
1,00039%MXN1,494MXN219,788Unlock in Market ExplorerUnlock in Market Explorer
46DLos Cabos
Lenient
5,26552%MXN3,567MXN696,801Unlock in Market ExplorerUnlock in Market Explorer
47DSan Miguel de Allende
Lenient
2,42240%MXN2,241MXN335,679Unlock in Market ExplorerUnlock in Market Explorer
48DSan Miguel de Allende
Lenient
2,09741%MXN2,166MXN332,672Unlock in Market ExplorerUnlock in Market Explorer
49DCabo San Lucas
Lenient
99749%MXN1,793MXN331,196Unlock in Market ExplorerUnlock in Market Explorer
50D+Playa del Carmen
Lenient
8,91753%MXN1,513MXN300,094Unlock in Market ExplorerUnlock in Market Explorer
51D+Puerto Vallarta
Lenient
7,15053%MXN2,372MXN466,775Unlock in Market ExplorerUnlock in Market Explorer
52D+Cancun
Lenient
5,77854%MXN1,457MXN296,395Unlock in Market ExplorerUnlock in Market Explorer
53D+Leon
Lenient
1,87237%MXN971MXN135,560Unlock in Market ExplorerUnlock in Market Explorer
54D+León De Los Aldama
Lenient
1,75337%MXN952MXN132,553Unlock in Market ExplorerUnlock in Market Explorer
55D+Mazamitla
Lenient
1,61627%MXN2,577MXN261,109Unlock in Market ExplorerUnlock in Market Explorer
56D+Valle De Bravo
Lenient
1,50229%MXN3,194MXN347,634Unlock in Market ExplorerUnlock in Market Explorer
57D+Veracruz
Lenient
1,05838%MXN1,046MXN150,803Unlock in Market ExplorerUnlock in Market Explorer
58D+Cozumel
Lenient
1,05448%MXN1,475MXN264,826Unlock in Market ExplorerUnlock in Market Explorer
59E+Tulum
Lenient
6,54343%MXN1,550MXN251,003Unlock in Market ExplorerUnlock in Market Explorer
60E+Ixtapa Zihuatanejo
Lenient
1,10436%MXN2,764MXN368,649Unlock in Market ExplorerUnlock in Market Explorer

Data Seen By

Encuentra los mejores mercados de Airbnb con nuestra herramienta interactiva

Usa nuestro Explorador de Mercados interactivo para encontrar los mejores lugares para comenzar un Airbnb en Mexico. Compara múltiples mercados lado a lado, aplica filtros como regulaciones, presupuesto (precios de propiedad o alquiler) y tamaño del mercado, e incluso exporta los resultados a Excel.

Explorar Herramienta Interactiva

¿Por qué invertir en Airbnb en Mexico en 2026?

En los últimos años, Mexico ha surgido como uno de los mejores lugares para invertir en alquileres a corto plazo gracias a sus populares atracciones turísticas, prósperas actividades comerciales, creciente presencia de nómadas digitales y ciudades vibrantes como Mexico City, Monterrey and Miguel Hidalgo. Con millones de visitantes internacionales que llegan cada año, la demanda de alojamientos de alquiler vacacional está creciendo, lo que convierte a Airbnb en Mexico en una opción lucrativa tanto para inversores locales como extranjeros.

Debido a la fuerte demanda de los viajeros, Mexico ofrece tarifas diarias promedio (ADR) competitivas, tasas de ocupación saludables y un potencial de ingresos atractivo en los mejores mercados de Airbnb. Ya sea que estés buscando comenzar tu primer negocio de Airbnb con un presupuesto modesto o añadir una propiedad de alquiler a corto plazo de lujo a tu cartera, Mexico tiene una ubicación rentable para satisfacer tu presupuesto y aspiraciones como inversor.

Top 3 Airbnb markets in Mexico by Market Grade

These are the three highest-graded Airbnb markets in Mexico. Market Grade compares yield, revenue growth, and occupancy (demand) with the other markets on this page, then adjusts for short-term rental regulation. The chart repeats those three percentiles in text so the ranking is readable without the graphic.

Rank 1 — Mexico City (Grade A)

Mexico City is rank 1 of 60 markets in this Mexico ranking by Airbtics Market Grade A, with 14.6% short-term rental yield, 65.0% occupancy, and +25.8% year-over-year revenue growth.

Compared with the other markets on this page, Mexico City ranks top 8% for yield, top 4% for growth, and top 2% for demand. The market shows an average daily rate of MXN1,531, annual revenue of MXN372,815, a rent gap of 3144.0%, 22,368 active listings, lenient short-term rental regulation, and a typical 2-bedroom property price of MXN3,736,000.

  • Market gradeA
  • Yield14.6%
  • Revenue growth+25.8%
  • Occupancy65.0%
  • Average daily rateMXN1,531
  • Annual revenueMXN372,815
  • Rent gap3144.0%
  • Active listings22,368
  • 2-bedroom priceMXN3,736,000
  • RegulationLenient
top 8%Yieldtop 4%Growthtop 2%Demand

Percentile versus other Mexico markets on this page. Farther from the center is stronger.

  • Yield: top 8%
  • Growth: top 4%
  • Demand: top 2%

Rank 2 — Monterrey (Grade A)

Monterrey is rank 2 of 60 markets in this Mexico ranking by Airbtics Market Grade A, with 13.5% short-term rental yield, 48.0% occupancy, and +15.9% year-over-year revenue growth.

Compared with the other markets on this page, Monterrey ranks top 12% for yield, top 12% for growth, and top 32% for demand. The market shows an average daily rate of MXN1,307, annual revenue of MXN236,544, a rent gap of 2601.3%, 3,959 active listings, lenient short-term rental regulation, and a typical 2-bedroom property price of MXN2,802,000.

  • Market gradeA
  • Yield13.5%
  • Revenue growth+15.9%
  • Occupancy48.0%
  • Average daily rateMXN1,307
  • Annual revenueMXN236,544
  • Rent gap2601.3%
  • Active listings3,959
  • 2-bedroom priceMXN2,802,000
  • RegulationLenient
top 12%Yieldtop 12%Growthtop 32%Demand

Percentile versus other Mexico markets on this page. Farther from the center is stronger.

  • Yield: top 12%
  • Growth: top 12%
  • Demand: top 32%

Rank 3 — Miguel Hidalgo (Grade A)

Miguel Hidalgo is rank 3 of 60 markets in this Mexico ranking by Airbtics Market Grade A, with 14.6% short-term rental yield, 66.0% occupancy, and +27.6% year-over-year revenue growth.

Compared with the other markets on this page, Miguel Hidalgo ranks top 9% for yield, top 2% for growth, and top 1% for demand. The market shows an average daily rate of MXN2,017, annual revenue of MXN497,093, a rent gap of 2930.2%, 3,262 active listings, lenient short-term rental regulation, and a typical 2-bedroom property price of MXN4,670,000.

  • Market gradeA
  • Yield14.6%
  • Revenue growth+27.6%
  • Occupancy66.0%
  • Average daily rateMXN2,017
  • Annual revenueMXN497,093
  • Rent gap2930.2%
  • Active listings3,262
  • 2-bedroom priceMXN4,670,000
  • RegulationLenient
top 9%Yieldtop 2%Growthtop 1%Demand

Percentile versus other Mexico markets on this page. Farther from the center is stronger.

  • Yield: top 9%
  • Growth: top 2%
  • Demand: top 1%

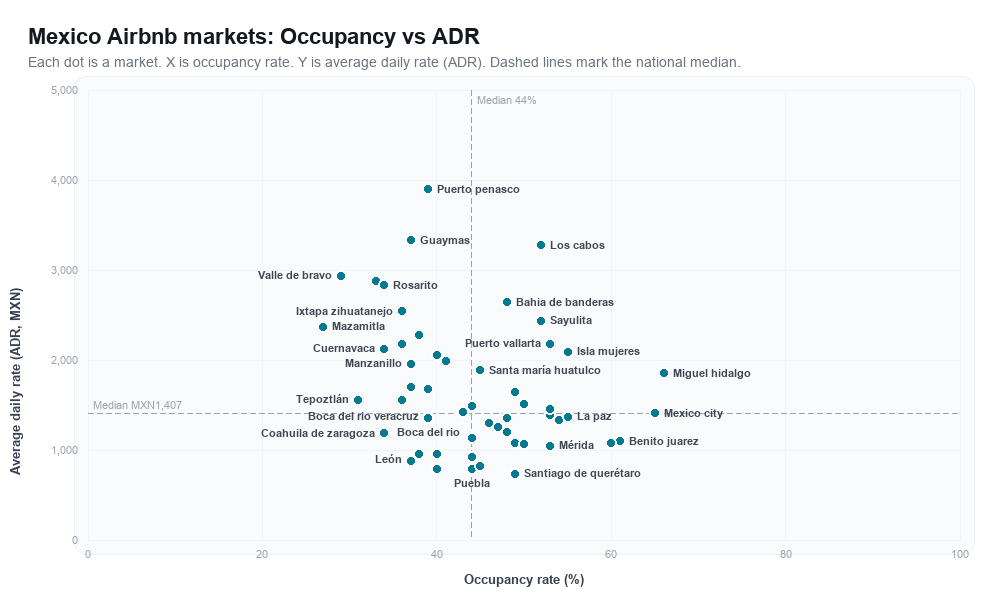
Análisis de Saturación del Mercado: Mexico

Each dot is a vacation rental market in Mexico, plotted by occupancy rate (x-axis) and average daily rate (ADR) (y-axis). Dashed lines mark the national median.

Mexico Airbnb markets rankboard scatter chart showing occupancy rate versus average daily rate (ADR)
Occupancy rate and average daily rate for each Mexico market plotted in the chart above, in Market Grade order.
MarketOccupancy rateAverage daily rate
Mexico City65.0%MXN1,531
Monterrey48.0%MXN1,307
Miguel Hidalgo66.0%MXN2,017
Benito Juarez61.0%MXN1,195
Coyoacán60.0%MXN1,176
Guadalajara50.0%MXN1,158
Mérida53.0%MXN1,139
Oaxaca de Juárez44.0%MXN1,232
Zapopan47.0%MXN1,363
La Paz55.0%MXN1,494
Santa Maria Colotepec53.0%MXN1,587
Playas De Rosarito33.0%MXN3,138
Guaymas37.0%MXN3,623
Rosarito34.0%MXN3,082
Puerto Penasco39.0%MXN4,240
Puebla44.0%MXN859
Santa María Huatulco45.0%MXN2,054
Bahia De Banderas48.0%MXN2,876
Coahuila De Zaragoza34.0%MXN1,288
Cuernavaca34.0%MXN2,316
Heróica Puebla de Zaragoza44.0%MXN859
Santiago de Querétaro49.0%MXN803
León37.0%MXN971
Morelia37.0%MXN934
Sayulita52.0%MXN2,652
Ensenada Mx39.0%MXN1,830
San Luis Potosi45.0%MXN896
San Miguel De Cozumel50.0%MXN1,643
Chihuahua44.0%MXN1,008
Isla Mujeres55.0%MXN2,278
Bacalar44.0%MXN1,625
Boca Del Rio39.0%MXN1,475
Valladolid37.0%MXN952
Guanajuato City49.0%MXN1,176
Acapulco36.0%MXN2,372
Mazatlan37.0%MXN1,849
Zihuatanejo38.0%MXN2,484
Tijuana46.0%MXN1,419
Hermosillo40.0%MXN1,046
Aguascalientes40.0%MXN1,046
Manzanillo37.0%MXN2,129
Tepoztlán31.0%MXN1,699
Mexicali36.0%MXN1,699
San Cristobal De Las Casas40.0%MXN859
Boca del Rio Veracruz39.0%MXN1,494
Los Cabos52.0%MXN3,567
San Miguel de Allende40.0%MXN2,241
San Miguel de Allende41.0%MXN2,166
Cabo San Lucas49.0%MXN1,793
Playa del Carmen53.0%MXN1,513
Puerto Vallarta53.0%MXN2,372
Cancun54.0%MXN1,457
Leon37.0%MXN971
León De Los Aldama37.0%MXN952
Mazamitla27.0%MXN2,577
Valle De Bravo29.0%MXN3,194
Veracruz38.0%MXN1,046
Cozumel48.0%MXN1,475
Tulum43.0%MXN1,550
Ixtapa Zihuatanejo36.0%MXN2,764

Compare property prices, short-term rental yield, rent gap, annual revenue, and supply growth in the Airbtics Market Explorer watchlist.


Estima tus ingresos de Airbnb en Mexico


¿Estás listo para empezar a buscar las oportunidades de inversión en alquiler a corto plazo más rentables en Mexico?

Usa nuestra calculadora de Airbnb para estimar rápida y precisamente el potencial de ganancias y rentabilidad de cualquier ciudad, barrio y zona.

Prueba nuestra calculadora de Airbnb

Si quieres ver tendencias, oferta y cambios interanuales, lee el informe del mercado de alquiler a corto plazo 2025 de Mexico.