Xcaret
Airbnb Market Data & Overview
Mexico
Is it profitable to do Airbnb in Xcaret, Mexico?
What is the occupancy rate of Airbnb in Xcaret, Mexico?
What is the average daily rate of Airbnb in Xcaret, Mexico?


Xcaret, Mexico Airbnb Data
Last updated on: 15th May, 2024
Mexico / Xcaret
Is Airbnb Profitable in Xcaret ?
Yes, there is a good short-term rental demand..
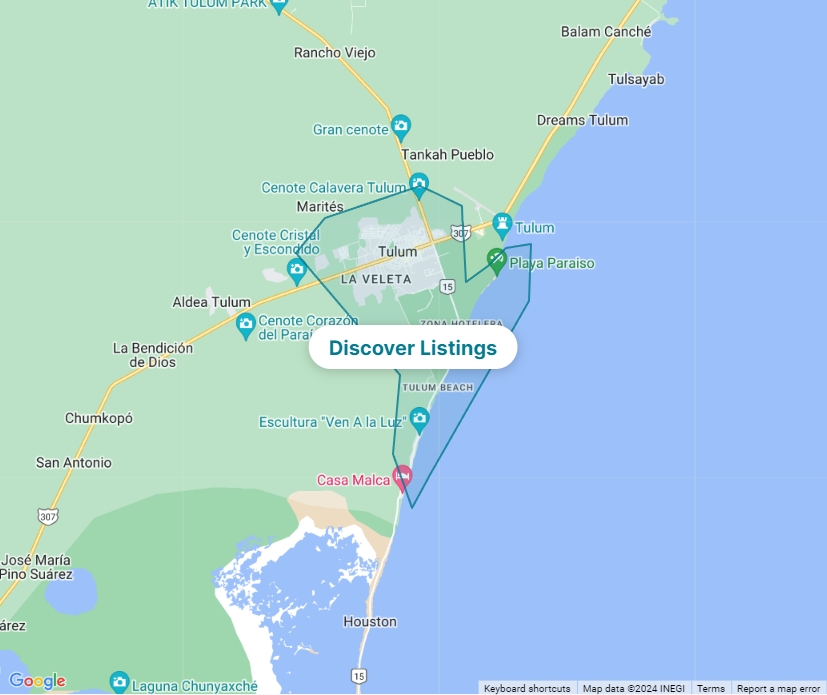
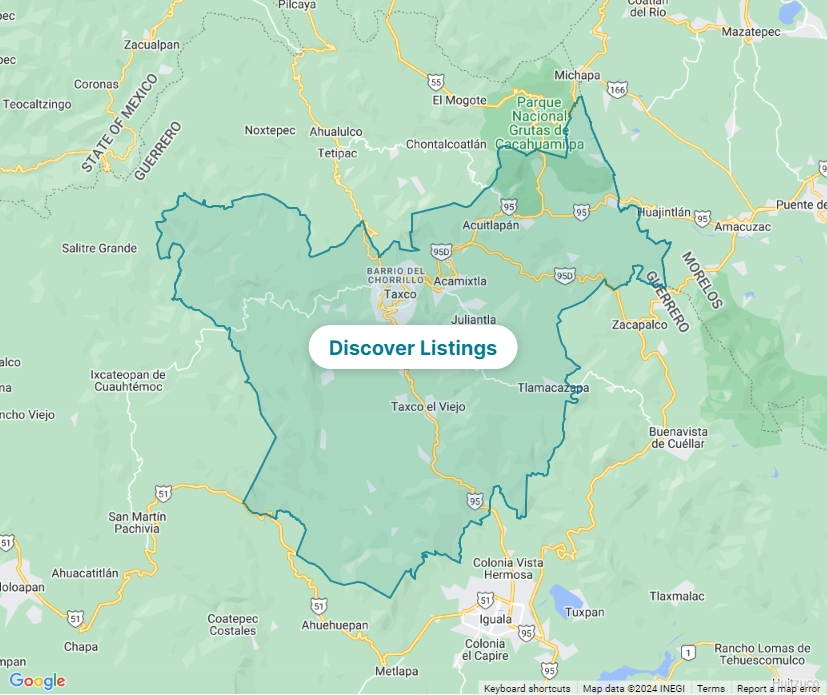
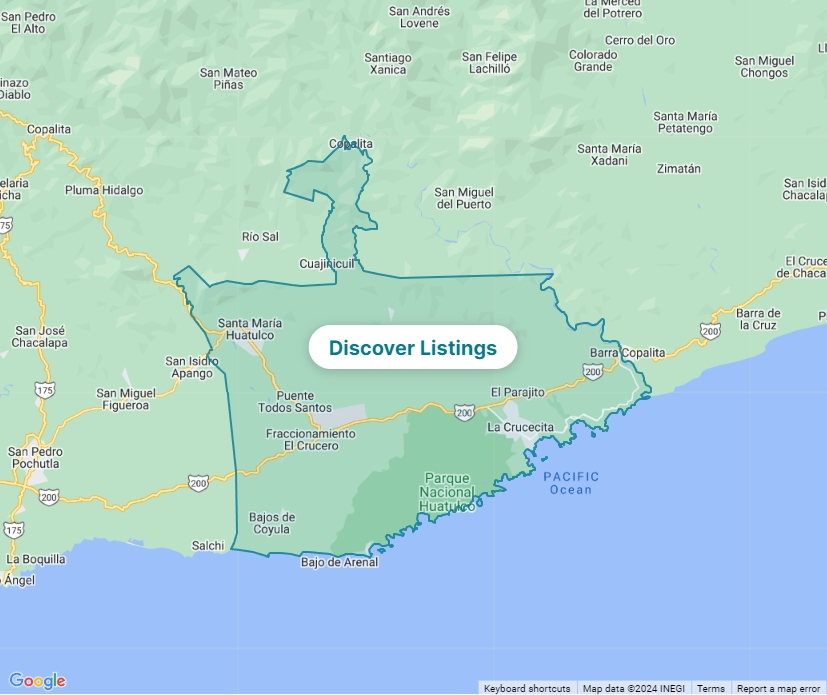
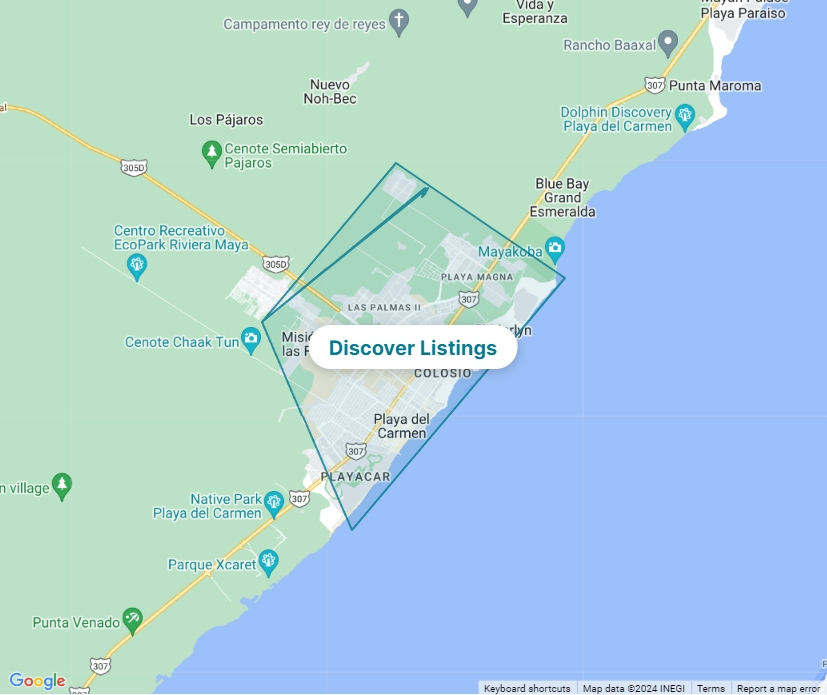
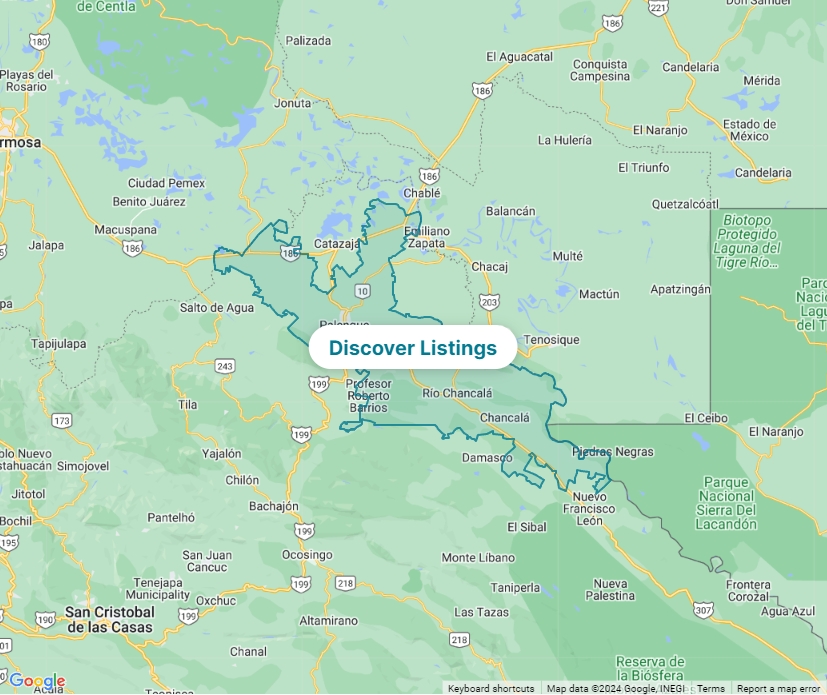
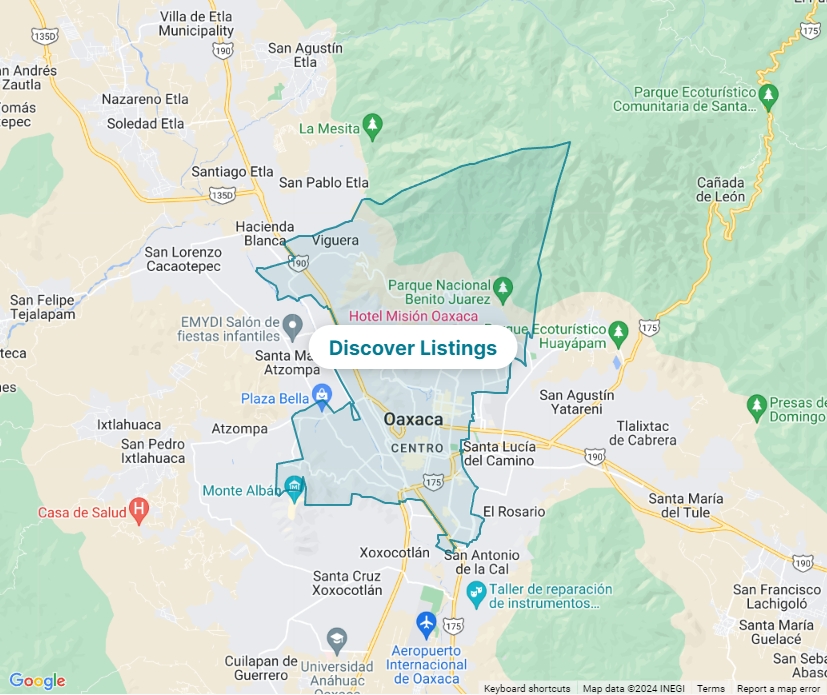
Best Areas in Xcaret for Airbnb
Best Areas in Xcaret for Airbnb Are you wondering where to invest in Xcaret? Look no further! Here are 10 areas travelers often search for. You can find the short-term rental statistics of all of these neighborhoods from Airbtics! Check out which neighborhood has the highest rental demand. 🚀- Xcaret Park
- Xcaret Beach
- Xcaret Underground Rivers
- Xcaret Mexico Espectacular
- Xcaret Coral Reef Aquarium
- Maya Village
- Xcaret Scenic Tower
- Xcaret Butterfly Pavilion
- Xcaret Aviary
- Xcaret Archaeological Sites
Signup and check out more in-depth vacation rental data for free.
Explore Xcaret‘s Airbnb Data ⟶