San Miguel
Airbnb Market Data & Overview
Peru
Is it profitable to do Airbnb in San Miguel, Peru?
What is the occupancy rate of Airbnb in San Miguel, Peru?
What is the average daily rate of Airbnb in San Miguel, Peru?


San Miguel, Peru Airbnb Data
Last updated on: 15th May, 2024
Peru / San Miguel
Is Airbnb Profitable in San Miguel ?
Yes, there is a good short-term rental demand..
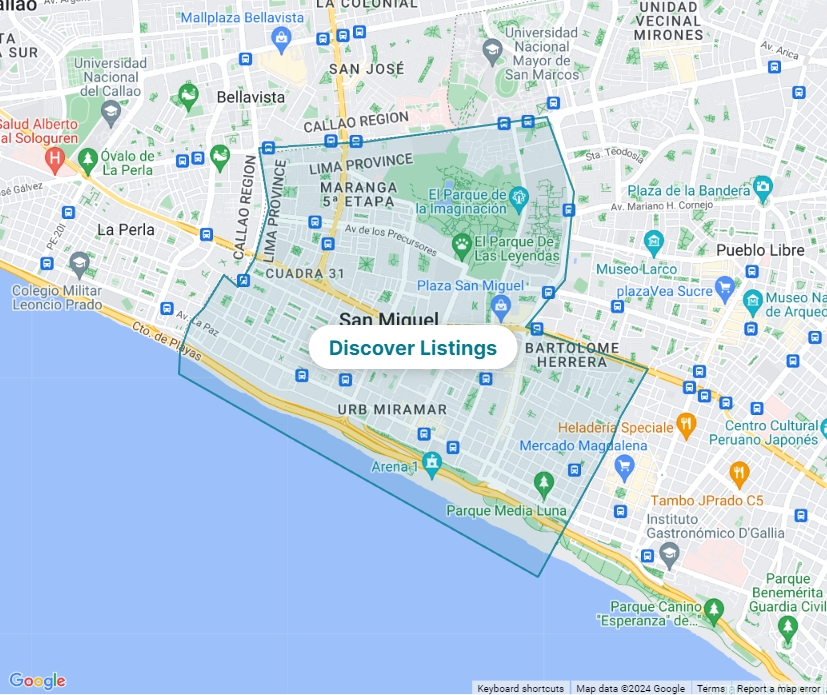
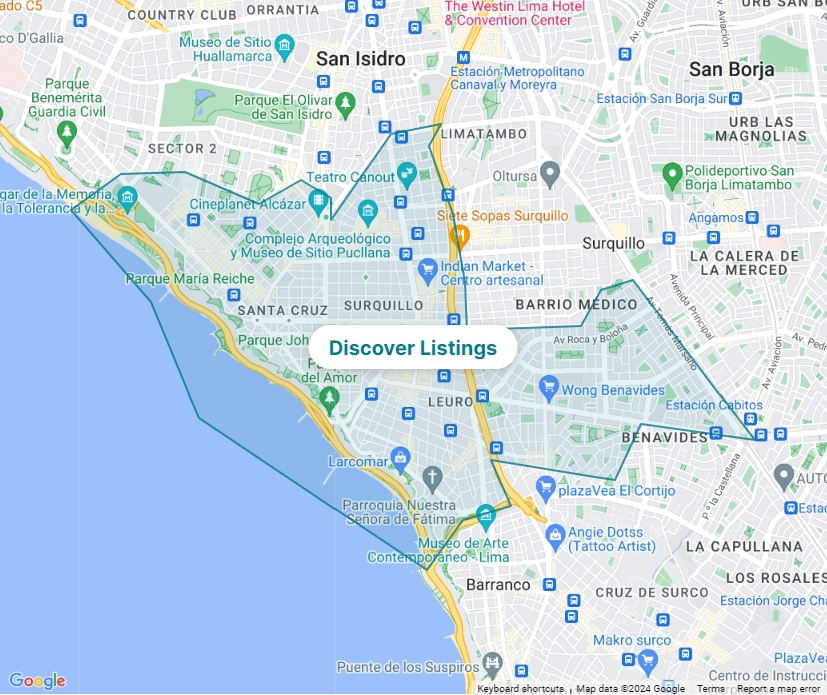
Best Areas in San Miguel for Airbnb
Best Areas in San Miguel for Airbnb Are you wondering where to invest in San Miguel? Look no further! Here are 10 areas travelers often search for. You can find the short-term rental statistics of all of these neighborhoods from Airbtics! Check out which neighborhood has the highest rental demand. 🚀- Plaza San Miguel
- Parque de las Leyendas
- Plaza Vea
- Jockey Plaza
- Universidad Nacional Mayor de San Marcos
- Plaza de la Bandera
- Club de Regatas Lima
- Mercado de San Miguel
- Centro Comercial Plaza San Miguel
- Costa Verde
Signup and check out more in-depth vacation rental data for free.
Explore San Miguel‘s Airbnb Data ⟶