Top Places to Start an Airbnb in Asia
Using Airbnb guest reviews, we identified tourist hotspots across Asia: places guests mention when they stay nearby. For each one, we measured how much extra revenue short-term rentals earn compared to similar listings in the same market.
The table lists 50 markets from our best Airbnb markets in Asia guide. Each row shows one top hotspot, sorted by market rank rather than hotspot premium.
For all hotspot types worldwide, see our Top Places to Start an Airbnb hub. If you are still picking a market, see our best Airbnb markets worldwide guide.
We pulled hotspots from Airbnb review text. These are locations guests name in reviews, not just entries from a generic tourist attraction list.
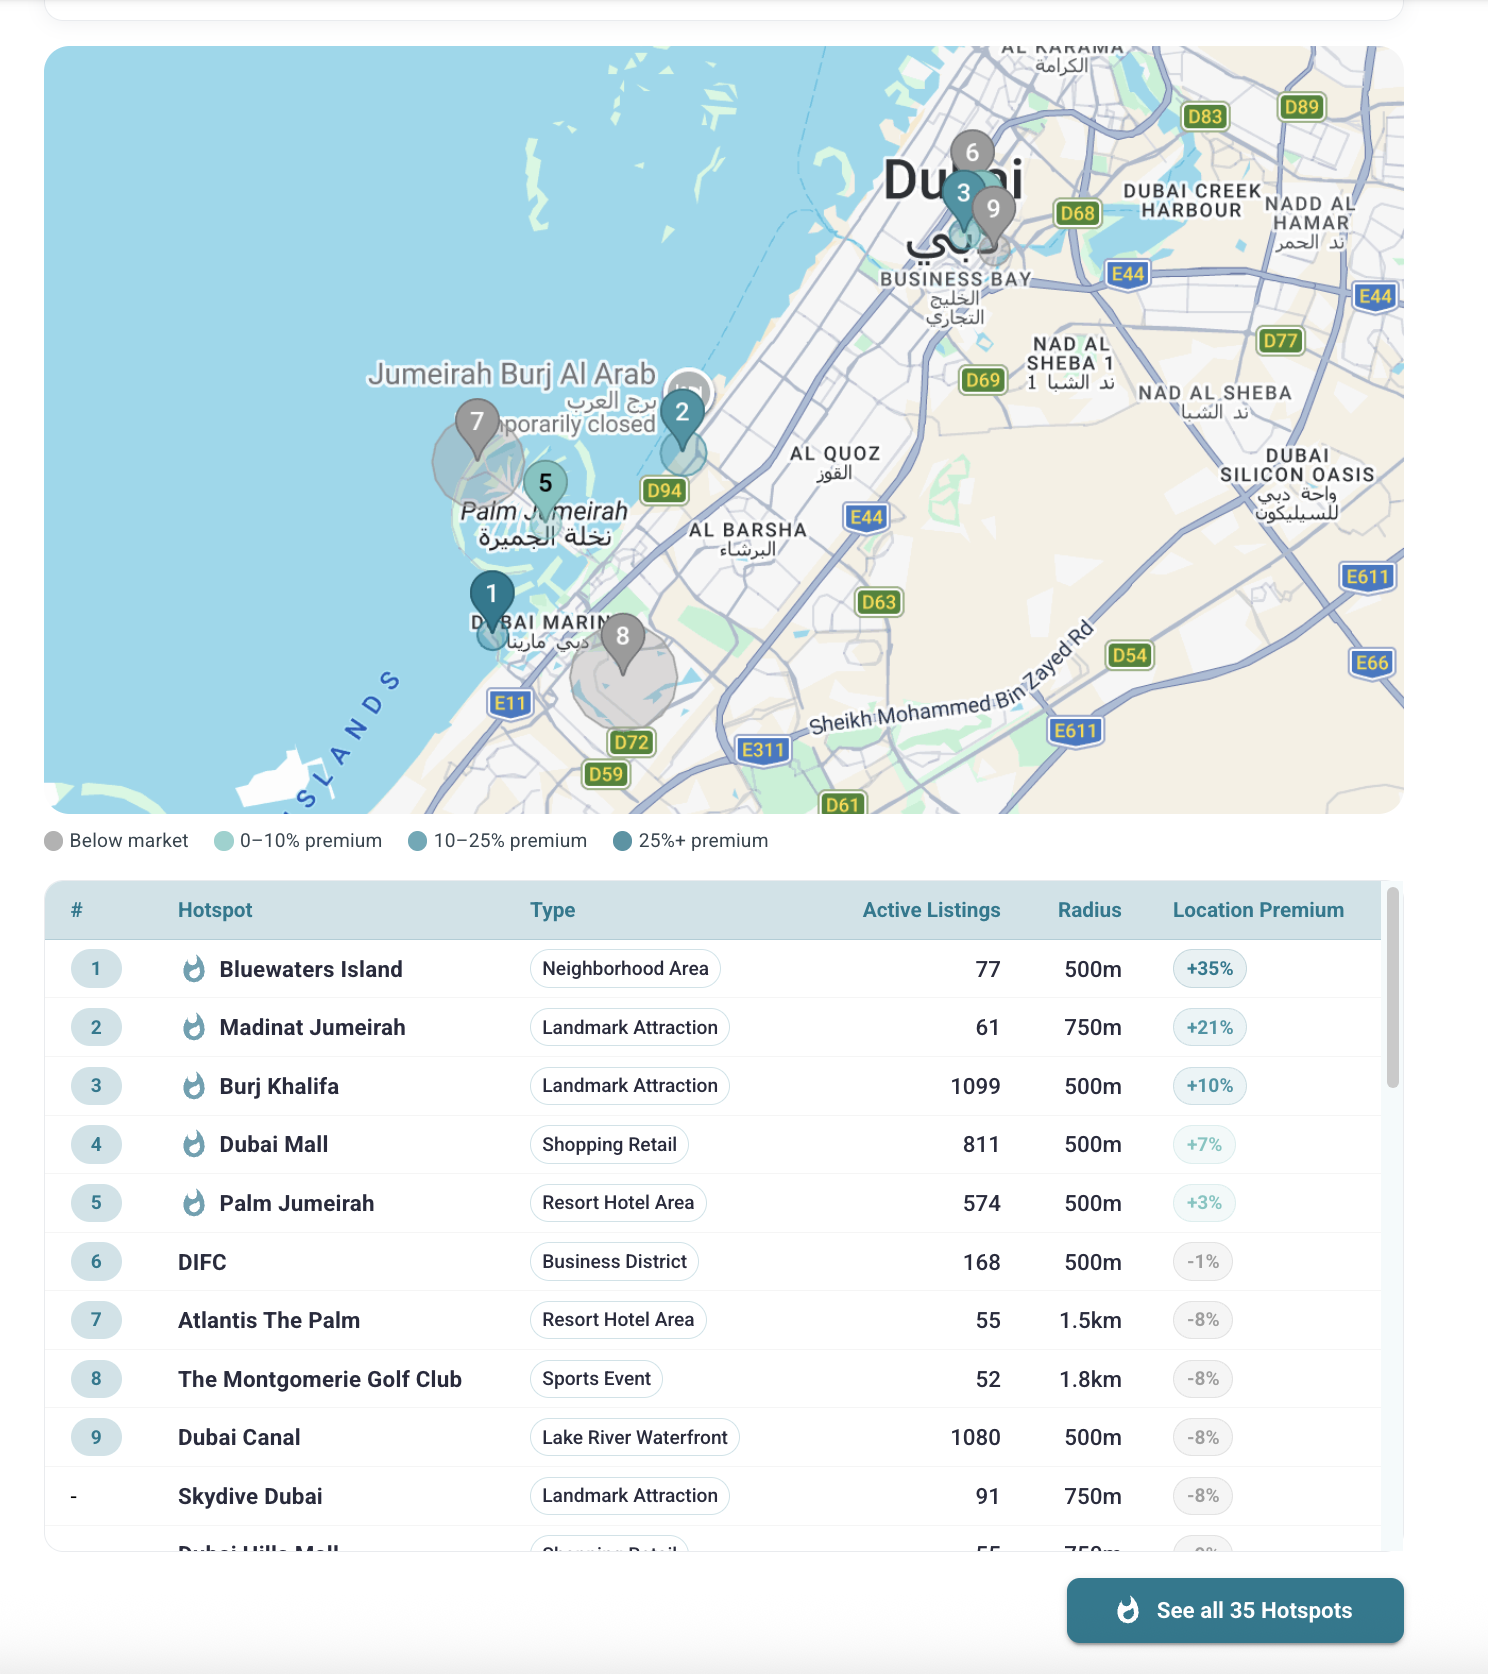
For each hotspot, we set a search radius based on listing density nearby. In central London, a major landmark might use a 500m radius. A national park might need 5 to 10 km.
For listings near each hotspot, we predicted revenue using comparable listings in the same market (bedrooms, property type, amenities, review scores). Actual revenue minus predicted revenue is the location premium. The table shows the average premium for nearby listings.
Last updated: June, 2026
Top 50 Markets & Hotspots in Asia
| Rank | Market | Hotspot Name | Category | No. of Listings | Premium % | Country |
|---|---|---|---|---|---|---|
| 1 | Bali | Bingin Beach | Beaches & Coastlines | 126 | +42% | Indonesia |
| 2 | Metro manila | Makati | Business Districts | 180 | +28% | Philippines |
| 3 | Tokyo | Harajuku | Shopping & Retail | 76 | +94% | Japan |
| 4 | Seoul | Gwanghwamun | Culture & History | 30 | +50% | South Korea |
| 5 | Kuala lumpur | Mid Valley Megamall | Shopping & Retail | 126 | +48% | Malaysia |
| 6 | Bangkok | Sathorn | Business Districts | 89 | +47% | Thailand |
| 7 | Ho chi minh city | Notre Dame Cathedral Basilica of Saigon | Culture & History | 116 | +65% | Vietnam |
| 8 | Jeju island | Camellia Hill | Parks & Gardens | 51 | +56% | South Korea |
| 9 | Osaka | Namba | Neighborhood Areas | 432 | +28% | Japan |
| 10 | Phuket | Racha / Raya Island | Beaches & Coastlines | 2 | +68% | Thailand |
| 11 | Goa | Agonda Beach | Beaches & Coastlines | 26 | +79% | India |
| 12 | Pattaya | Soi Buakhao | Nightlife & Entertainment | 1,764 | +3% | Thailand |
| 13 | Hanoi | Ba Dinh District | Neighborhood Areas | 152 | +60% | Vietnam |
| 14 | Busan | Busan International Passenger Terminal | Transport Hubs | 46 | +49% | South Korea |
| 15 | Chiang mai | Chiang Mai Old City | Downtown & City Centers | 45 | +15% | Thailand |
| 16 | Bengaluru | Cubbon Park | Parks & Gardens | 17 | +99% | India |
| 17 | Da nang | Montgomerie Links | Sports & Events | 13 | +73% | Vietnam |
| 18 | Johor bahru | Johor Premium Outlets | Shopping & Retail | 94 | +8% | Malaysia |
| 19 | Taipei | Taipei MRT / Metro | Geographic Areas | 301 | +19% | Taiwan |
| 20 | Koh samui | Chaweng | Neighborhood Areas | 5 | +65% | Thailand |
| 21 | Cebu city | Sirao Garden | Parks & Gardens | 27 | +19% | Philippines |
| 22 | Kyoto | Shijo-Karasuma | Business Districts | 64 | +23% | Japan |
| 23 | Melaka | Baba & Nyonya Heritage Museum | Culture & History | 101 | +13% | Malaysia |
| 24 | Jakarta | Senayan | Sports & Events | 46 | +105% | Indonesia |
| 25 | Okinawa | Yonaha Maehama Beach | Beaches & Coastlines | 29 | +62% | Japan |
| 26 | Baguio | Burnham Park | Parks & Gardens | 155 | +31% | Philippines |
| 27 | Mumbai | Taj Mahal Palace | Landmarks & Attractions | 10 | +89% | India |
| 28 | Hong kong | Victoria Peak | Mountains & Nature | 89 | +52% | Hong Kong |
| 29 | Krabi | Railay Beach | Beaches & Coastlines | 16 | +96% | Thailand |
| 30 | Yerevan | Kentron | Downtown & City Centers | 627 | +2% | Armenia |
| 31 | Tagaytay | Crosswinds Tagaytay | Resort & Hotel Areas | 91 | +8% | Philippines |
| 32 | Almaty | Medeu | Sports & Events | 24 | +56% | Kazahstan |
| 33 | Incheon | Paradise City | Resort & Hotel Areas | 13 | +28% | South Korea |
| 34 | Kota kinabalu | Karambunai | Resort & Hotel Areas | 30 | +39% | Malaysia |
| 35 | Davao city | Talicud Island | Beaches & Coastlines | 22 | +58% | Philippines |
| 36 | Gangneung | Ojukheon | Culture & History | 24 | +33% | South Korea |
| 37 | Hoi an | Hoi An Central Market | Markets & Food | 12 | +50% | Vietnam |
| 38 | New delhi | Vasant Kunj | Neighborhood Areas | 19 | +63% | India |
| 39 | Gyeongju | Hwangridan-gil | Markets & Food | 91 | +75% | South Korea |
| 40 | Petaling jaya | TTDI | Neighborhood Areas | 10 | +29% | Malaysia |
| 41 | Lapu-lapu city | Tambuli Seaside Resort / Tambuli area | Resort & Hotel Areas | 143 | +46% | Philippines |
| 42 | Gurgaon | Moulsari Avenue | Transport Hubs | 11 | +68% | India |
| 43 | Sapporo | Mount Moiwa | Mountains & Nature | 32 | +22% | Japan |
| 44 | Hyderabad | Banjara Hills | Neighborhood Areas | 29 | +40% | India |
| 45 | Ipoh | D.R. Seenivasagam Park | Parks & Gardens | 90 | +13% | Malaysia |
| 46 | Nagano | Hakuba Goryu | Resort & Hotel Areas | 22 | +72% | Japan |
| 47 | Jaipur | Amer Fort / Amber Fort | Culture & History | 1 | +250% | India |
| 48 | Shah alam | Glenmarie | Business Districts | 33 | +47% | Malaysia |
| 49 | Nha trang | Nha Trang Bay | Beaches & Coastlines | 4 | +58% | Vietnam |
| 50 | Yeosu | Odongdo Island | Mountains & Nature | 26 | +45% | South Korea |
Key Findings
- These 50 Airbnb markets in Asia come from our best-markets ranking. Each row includes one top hotspot, sorted by market rank rather than hotspot premium. 50 hotspots have a positive premium; 0 are below the market average.
- The list starts with Bali (+42%), Metro manila (+28%), Tokyo (+94%). Even top-ranked markets can have hotspots with very different premiums.
- The highest premium on this page is Amer Fort / Amber Fort in Jaipur (+250%). Many well-known markets still have modest or negative premiums.
What hotspot analysis tells you
Hotspot analysis shows where Airbnb guests pay more to stay, not just where tourists visit on a map.
Property prices and long-term rents often miss this. A neighborhood can look average on paper but still earn strong Airbnb revenue if it sits near a landmark, beach, venue, or other draw that guests mention in reviews.
That is the gap this data fills. It points to areas where acquisition may still be reasonable while short-term rental revenue runs above the market average.
In the Airbtics dashboard, each market includes its own hotspot breakdown so you can compare neighborhoods before buying or listing.
Frequently Asked Questions
See hotspot data for your market
Open any market in Airbtics to see which areas earn a location premium and compare neighborhoods side by side.
Open Airbtics Dashboard