
Airbnb Occupancy Rate Tool - Check Occupancy Data for Any Markets
Instantly See AnAverageAirbnbOccupancyRate
Discover 30+ Airbnb statistics of any city worldwide!


What Is Occupancy Rate?
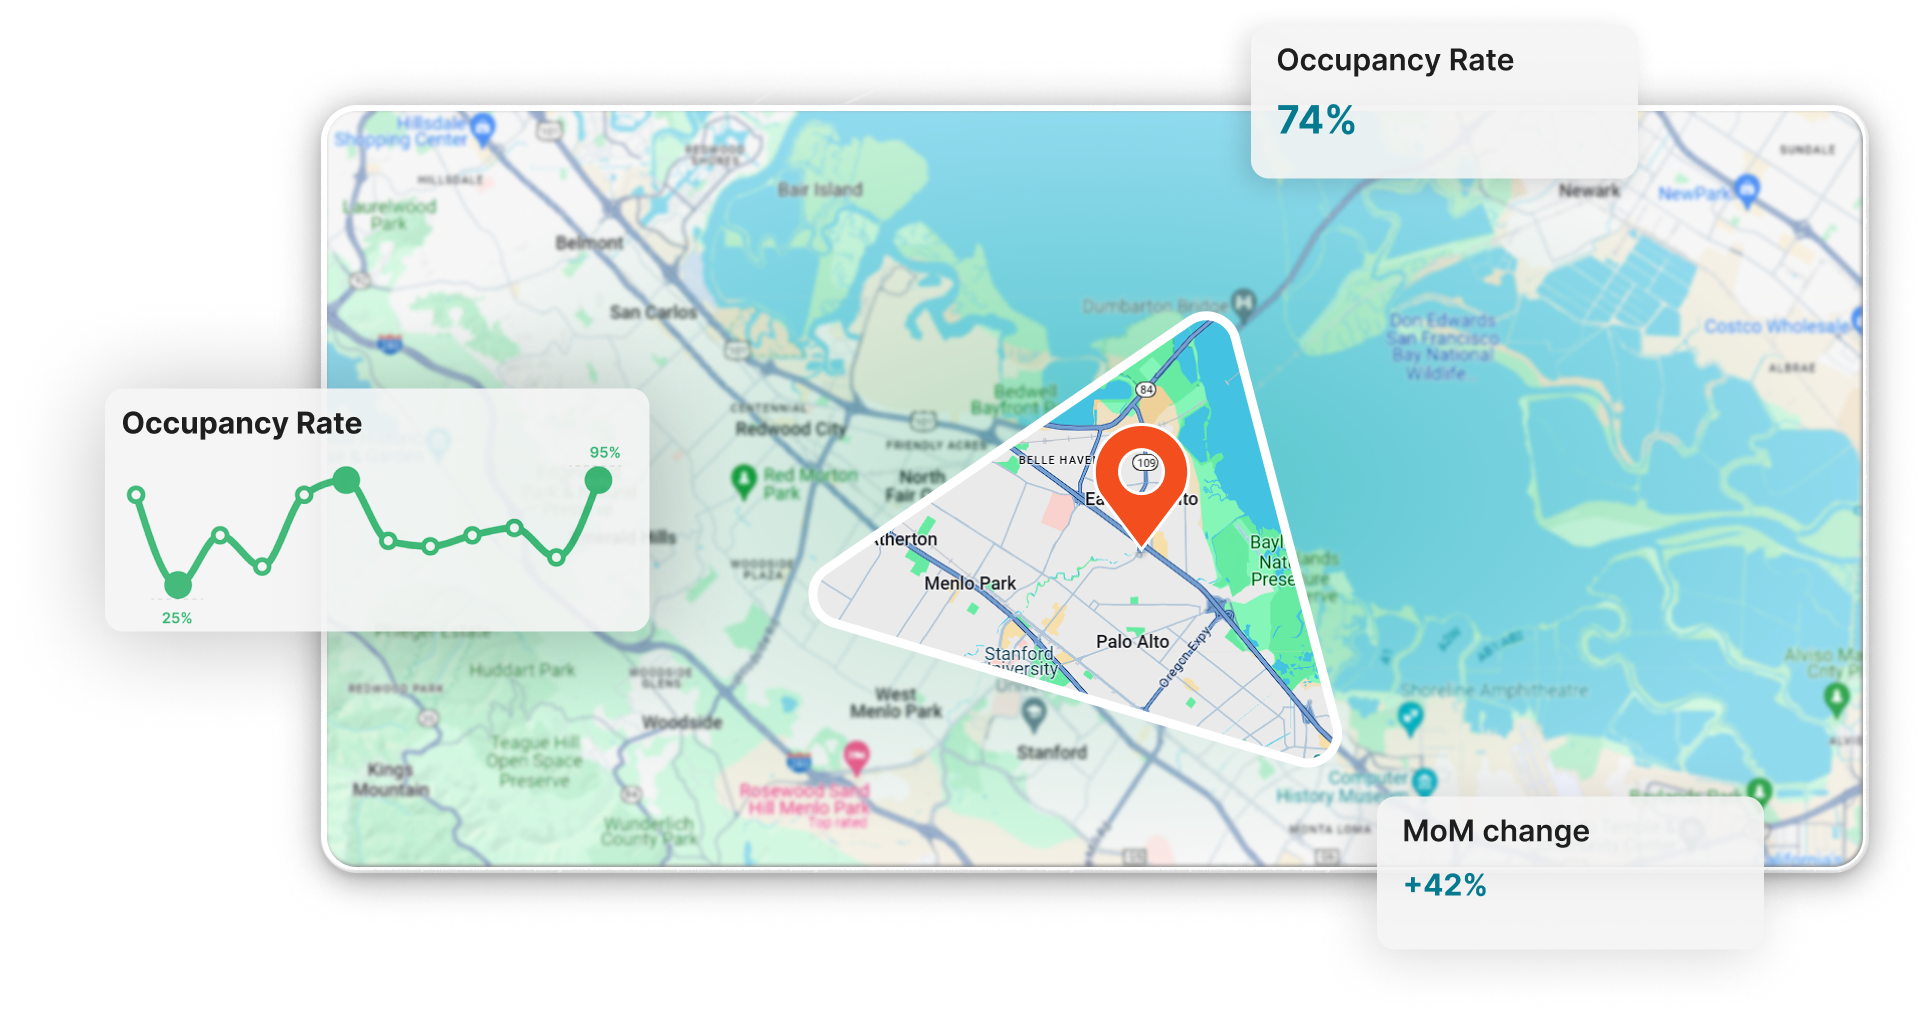
It is the percentage of nights booked among the available nights on an Airbnb listing. How can you find the average occupancy rate of your market?
How to find Airbnb Occupancy Rates?
Simply enter an address above, and it’ll show you the average occupancy rate of any address in the world for free! The average occupancy rate is calculated by 10-20 similar listings around the input addresses.
What Is a good Occupancy Rate?
We provide a simple guide: “70% is considered a good year-round occupancy rate.” About 20% of markets worldwide fall under this category.
How does Airbtics collect this data?
As a short-term rental data company, we’ve been tracking Airbnb listing occupancy rates and bookings since 2019. This allows us to have comprehensive Airbnb statistics at listing level.
Those statistics includes:
Why do you need to know the Airbnb Occupancy Rate?
Market Research: Starting on your Airbnb venture? Knowing the Airbnb rates in your area will steer you in the right direction.
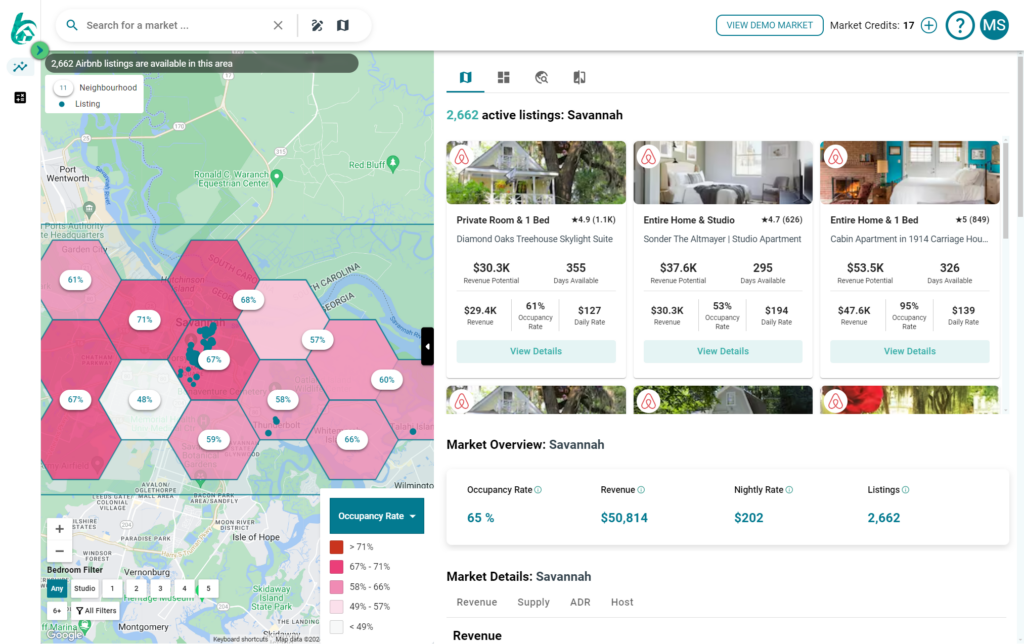
The two most important factors are 1) choosing the perfect location with the highest average occupancy rate and 2) determining the right number of bedrooms because you can’t change these two once you commit to a property.
If you want to know the right location, simply use Airbtics’ Airbnb Occupancy Rate map.
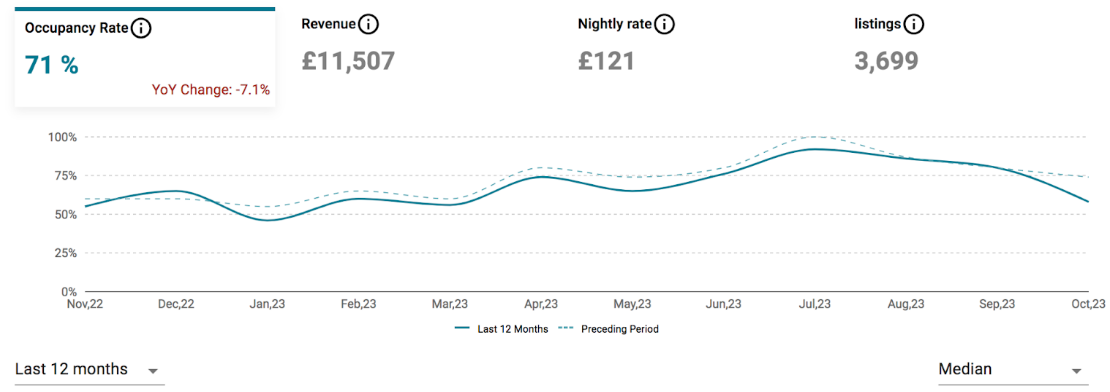
Get more bookings: Knowing the peak season allows you to maximize your profit by charging higher fees. During low season, you can consider giving a discount for long-term rates, or it might be the right timing for you to use it as your vacation home!
4 Interesting AirBNB Occupancy Rate Facts
Are you thinking of investing on short-term rentals or already have a few? These are some Airbnb Occupancy rate statistics that can be useful for you to know to get more bookings.
Summary: Take professional photos, get more reviews – at least 5 reviews, be a super host to maximise your occupancy rates!
Average Airbnb Occupancy Rates by City (US)
- Fort Collins Airbnb Active Listing: 2,533 Average Airbnb Occupancy Rate (2023): 68% Peak Season: July
- Seattle Airbnb Active Listing: 5,791 Average Airbnb Occupancy Rate (2023): 76% Peak Season: July
- Memphis Airbnb Active Listing: 1,488 Average Airbnb Occupancy Rate (2023): 58% Peak Season: April
- Milwaukee Airbnb Active Listing: 1,552 Average Airbnb Occupancy Rate (2023): 60% Peak Season: July
- Ontario, NY Airbnb Active Listing: 632 Average Airbnb Occupancy Rate (2023): 56% Peak Season: July
- Phoenix Airbnb Active Listing: 7,600 Average Airbnb Occupancy Rate (2023): 60% Peak Season: March
- Austin Airbnb Active Listing: 10,779 Average Airbnb Occupancy Rate (2023): 61% Peak Season: April
- San Antonio Airbnb Active Listing: 5,290 Average Airbnb Occupancy Rate (2023): 57% Peak Season: July
- Newark, NJ Airbnb Active Listing: 1,480 Average Airbnb Occupancy Rate (2023): 60% Peak Season: September
- Houston Airbnb Active Listing: 10,263 Average Airbnb Occupancy Rate (2023): 56% Peak Season: July
- Fresno Airbnb Active Listing: 1,830 Average Airbnb Occupancy Rate (2023): 54% Peak Season: July
- Chicago Airbnb Active Listing: 6,634 Average Airbnb Occupancy Rate (2023): 66% Peak Season: July
- New York Airbnb Active Listing: 10,048 Average Airbnb Occupancy Rate (2023): 72% Peak Season: June
- Boston Airbnb Active Listing: 2,690 Average Airbnb Occupancy Rate (2023): 81% Peak Season: October
- Gainesville, FL Airbnb Active Listing: 871 Average Airbnb Occupancy Rate (2023): 56% Peak Season: August
- Nashville Airbnb Active Listing: 8,137 Average Airbnb Occupancy Rate (2023): 62% Peak Season: April
- Miami Airbnb Active Listing: 8,533 Average Airbnb Occupancy Rate (2023): 61% Peak Season: March
- Jacksonville Airbnb Active Listing: 8,874 Average Airbnb Occupancy Rate (2023): 59% Peak Season: March
- Orlando Airbnb Active Listing: 1,351 Average Airbnb Occupancy Rate (2023): 64% Peak Season: March
- Denver Airbnb Active Listing: 4,595 Average Airbnb Occupancy Rate (2023): 77% Peak Season: June
- Pittsburgh, PA Airbnb Active Listing: 2,195 Average Airbnb Occupancy Rate (2023): 63% Peak Season: July
- Wichita, KS Airbnb Active Listing: 683 Average Airbnb Occupancy Rate (2023): 60% Peak Season: July
- Kansas, MO Airbnb Active Listing: 3,433 Average Airbnb Occupancy Rate (2023): 61% Peak Season: July
- Tampa Airbnb Active Listing: 3,820 Average Airbnb Occupancy Rate (2023): 62% Peak Season: March
- Raleigh Airbnb Active Listing: 1,504 Average Airbnb Occupancy Rate (2023): 63% Peak Season: July
- Baltimore Airbnb Active Listing: 1,769 Average Airbnb Occupancy Rate (2023): 58% Peak Season: June
Average Airbnb Occupancy Rates by City (Canada)
Toronto Airbnb Active Listing: 12,637 Average Airbnb Occupancy Rate (2023): 77 % Peak Season: September
Calgary Airbnb Active Listing: 5,290 Average Airbnb Occupancy Rate (2023): 77 % Peak Season: July
Quebec Airbnb Active Listing: 1,443 Average Airbnb Occupancy Rate (2023): 76 % Peak Season: July & August
Edmonton Airbnb Active Listing: 2,954 Average Airbnb Occupancy Rate (2023): 69 % Peak Season: July
Montreal Airbnb Active Listing: 7,605 Average Airbnb Occupancy Rate (2023): 74 % Peak Season: August
Vancouver Airbnb Active Listing: 5,478 Average Airbnb Occupancy Rate (2023): 85 % Peak Season: June-August
Winnipeg Airbnb Active Listing: 1,588 Average Airbnb Occupancy Rate (2023): 69 % Peak Season: July
Kitchener Airbnb Active Listing: 793 Average Airbnb Occupancy Rate (2023): 69% Peak Season: September
Victoria Airbnb Active Listing: 1,267 Average Airbnb Occupancy Rate (2023): 79 % Peak Season: July & August
London, ON Airbnb Active Listing: 830 Average Airbnb Occupancy Rate (2023): 66 % Peak Season: September
Halifax Airbnb Active Listing: 1,238 Average Airbnb Occupancy Rate (2023): 84 % Peak Season: July & August
Sudbury Airbnb Active Listing: 352 Average Airbnb Occupancy Rate (2023): 67% Peak Season: April
Kingston Airbnb Active Listing: 453 Average Airbnb Occupancy Rate (2023): 70 % Peak Season: August
Ottawa Airbnb Active Listing: 2,248 Average Airbnb Occupancy Rate (2023): 69 % Peak Season: July
Average Airbnb Occupancy Rates by City (Australia)
Adelaide Airbnb Active Listing: 3,782 Average Airbnb Occupancy Rate: 73 % Peak Season: April
Perth Airbnb Active Listing: 5,312 Average Airbnb Occupancy Rate: 87 % Peak Season: April
Canberra Airbnb Active Listing: 1,738 Average Airbnb Occupancy Rate: 73% Peak Season: April
Newcastle Airbnb Active Listing: 1,125 Average Airbnb Occupancy Rate: 62% Peak Season: January
Melbourne Airbnb Active Listing: 20,327 Average Airbnb Occupancy Rate: 66 % Peak Season: April
Brisbane Airbnb Active Listing: 3,901 Average Airbnb Occupancy Rate: 85 % Peak Season: July
Sydney Airbnb Active Listing: 11,732 Average Airbnb Occupancy Rate: 79% Peak Season: April
Darwin Airbnb Active Listing: 1,110 Average Airbnb Occupancy Rate: 69% Peak Season: August
Wollongong Airbnb Active Listing: 855 Average Airbnb Occupancy Rate: 64% Peak Season: January
Hobart Airbnb Active Listing: 1,057 Average Airbnb Occupancy Rate: 72% Peak Season: April
Toowoomba Airbnb Active Listing: 303 Average Airbnb Occupancy Rate: 75% Peak Season: April
Central Coast Airbnb Active Listing: 2,598 Average Airbnb Occupancy Rate: 43% Peak Season: January
Ballarat Airbnb Active Listing: 510 Average Airbnb Occupancy Rate: 510 Peak Season: April
Greater Bendigo Airbnb Active Listing: 484 Average Airbnb Occupancy Rate: 60% Peak Season: April
Average Airbnb Occupancy Rates by City (UK)
London Airbnb Active Listing: 4,000 Average Airbnb Occupancy Rate: 87% Peak Season: June & July
Edinburgh Airbnb Active Listing: 6,857 Average Airbnb Occupancy Rate: 91% Peak Season: June- September
Liverpool Airbnb Active Listing: 3,376 Average Airbnb Occupancy Rate: 57% Peak Season: April
Manchester Airbnb Active Listing: 2,338 Average Airbnb Occupancy Rate: 66% Peak Season: July
Glasgow Airbnb Active Listing: 2,329 Average Airbnb Occupancy Rate: 76% Peak Season: 76%
Leeds Airbnb Active Listing: 1,465 Average Airbnb Occupancy Rate: 65% Peak Season: July
York Airbnb Active Listing: 1,730 Average Airbnb Occupancy Rate: 66% Peak Season: July
Birmingham Airbnb Active Listing: 2,762 Average Airbnb Occupancy Rate: 61% Peak Season: July
Nottingham Airbnb Active Listing: 1,212 Average Airbnb Occupancy Rate: 61 % Peak Season: September
Bristol Airbnb Active Listing: 2,299 Average Airbnb Occupancy Rate: 77 % Peak Season: September
Sheffield Airbnb Active Listing: 1,114 Average Airbnb Occupancy Rate: 61% Peak Season: July
Cardiff Airbnb Active Listing: 1,880 Average Airbnb Occupancy Rate: 60% Peak Season: July
Aberdeen Airbnb Active Listing: 725 Average Airbnb Occupancy Rate: 70% Peak Season: July
Belfast Airbnb Active Listing: 1,446 Average Airbnb Occupancy Rate: 74% Peak Season: 74%
Average Airbnb Occupancy Rates (Top 50 Global Cities)
Amsterdam, Netherlands Airbnb Active Listing: 5,778 Average Airbnb Occupancy Rate: 96% Peak Season: April- September
Athens, Greece Airbnb Active Listing: 11,223 Average Airbnb Occupancy Rate: 79% Peak Season: June & September
Atlanta City, USA Airbnb Active Listing: 6,224 Average Airbnb Occupancy Rate: 56 % Peak Season: July
Auckland, New Zealand Airbnb Active Listing: 5,026 Average Airbnb Occupancy Rate: 77 % Peak Season: December
Austin, Texas Airbnb Active Listing: 10,779 Average Airbnb Occupancy Rate: 61% Peak Season: April
Bangkok, Thailand Airbnb Active Listing: 14,532 Average Airbnb Occupancy Rate: 55 % Peak Season: December
Barcelona, Spain Airbnb Active Listing: 13,829 Average Airbnb Occupancy Rate: 88 % Peak Season: April, July & October
Batumi, Georgia Airbnb Active Listing: 4,564 Average Airbnb Occupancy Rate: 49 % Peak Season: August
Beyoglu, Turkey Airbnb Active Listing: 7,891 Average Airbnb Occupancy Rate: 61% Peak Season: October
Bogota, Colombia Airbnb Active Listing: 11,249 Average Airbnb Occupancy Rate: 54 % Peak Season: July
Bordeaux, France Airbnb Active Listing: 4,369 Average Airbnb Occupancy Rate: 82% Peak Season: September
Berlin, Germany Airbnb Active Listing: 7,754 Average Airbnb Occupancy Rate: 87% Peak Season: June & September
Brooklyn, New York Airbnb Active Listing: 8,858 Average Airbnb Occupancy Rate: 79 % Peak Season: June
Budapest, Hungary Airbnb Active Listing: 9,741 Average Airbnb Occupancy Rate: 79% Peak Season: July
Buenos Aires, Argentina Airbnb Active Listing: 24,453 Average Airbnb Occupancy Rate: 70 % Peak Season: April
9 Simple Tips To Boost Your Airbnb Occupancy Rate
1. Choose the Right Airbnb Market
Finding the ideal Airbnb city or market is crucial in optimizing your occupancy rate. Look for popular destinations and analyze their Airbnb demand. These can positively affect your property’s visibility and desirability.
2. Search for the Best Submarket
Identify the most lucrative submarkets within your Airbnb city. A good Airbnb submarket includes the best neighborhoods, property types, and number of bedrooms. Targeting the specific preferences of potential guests in different areas can help you tailor your Airbnb to meet their needs and attract more bookings.
3. Add Some Amenities
Adding basic amenities such as towels, toilet paper, and wifi just meets guests’ expectations. However, going for an extra mile differentiates you from the rest. This may include adding a few small fancy Airbnb amenities, an Airbnb hot tub, or a swimming pool.
4. Furnish your Rental
Don’t skimp on quality furnishings because they will make your rental stand out. A thoughtfully designed and comfortable Airbnb is more likely to receive positive reviews and repeat bookings. Target the needs of your guests then create a welcoming environment conducive to longer stays.
5. Take Nice Photos
First impressions matter. Photos are worth a thousand words. Lure your guests with your property’s features captured in the best light. Showcase each room from different angles and center your rental’s unique aspect. While you can pick up some Airbnb photo tips, opting for a professional photographer can significantly enhance the visual appeal of your listing.
6. Boost Your Listings Visibility
Optimize your listing for Airbnb and search engine algorithms. Use relevant keywords in your title and description to target potential guests. Regular calendar updates and quick responses to guests’ inquiries also improve your search ranking.
7. Enable Airbnb Instant Book
Active Airbnb Instant Book for a seamless booking experience. This attracts spontaneous travelers. Plus, Airbnb often prioritizes and boosts the listings with this feature.
8. Aim To Be An Airbnb Superhost
Aspire to have a Superhost status by giving exceptional hospitality. The rewards can be outstanding. These include increased visibility that can lead to higher occupancy rates and earnings.
9. Consider Professional Airbnb Managers
Consider hiring professional Airbnb managers who specialize in optimizing property listings. Aside from doing the marketing side of your rental, these experts can also handle tasks from the pricing strategy to communication with guests. You can also hire them for property upkeep and maintenance. However, these services come at a cost usually with a commission-based pricing structure.
In the below, I’ve compiled the occupancy rates of major cities in the US, UK, Australia, and Canada. (There’s also a bonus of 50 global cities too!)