 Airbtics | Airbnb Analytics
Precise Short-term Rental Analytics
Airbtics | Airbnb AnalyticsA balanced AirDNA review highlighting the platform’s strengths and areas for improvement. Find out also what actual users have to say, both the good and the bad.
Home > Resources > Alternative >
A balanced AirDNA review highlighting the platform’s strengths and areas for improvement. Find out also what actual users have to say, both the good and the bad.
[elementor-template id=”61228″]
Airbnb analytics is a relatively young but incredibly influential tool. In less than a decade, it has made success possible for a lot of Airbnb investors. This exciting tool was introduced when AirDNA came to the scene in 2015. With little to no competition, it seemed then that it was the only one you got. And an AirDNA review was hard to find.
Fast forward to today, AirDNA remains the most popular Airbnb analytics tool with the biggest market share. But does it still hold up in 2024? In this article, we will put this to the test.
Our team has been deeply immersed in the world of short-term rentals since 2020. During this time, we’ve been on a mission to uncover the hottest Airbnb destinations, using the power of short-term rental analytics to guide us. We have tried multiple and closely followed different STR analytics tools, allowing us to understand each strengths and areas for improvement.
In this article, our goal is to give you an honest and thorough look at the AirDNA platform. Our approach is all about being fair and detailed, drawing from our industry knowledge. Plus, we’ll also share some AirDNA reviews from the actual users, highlighting what they love about the platform and addressing any concerns they’ve voiced. It’s our way of helping you make an informed decision about whether AirDNA is the right fit for your needs.
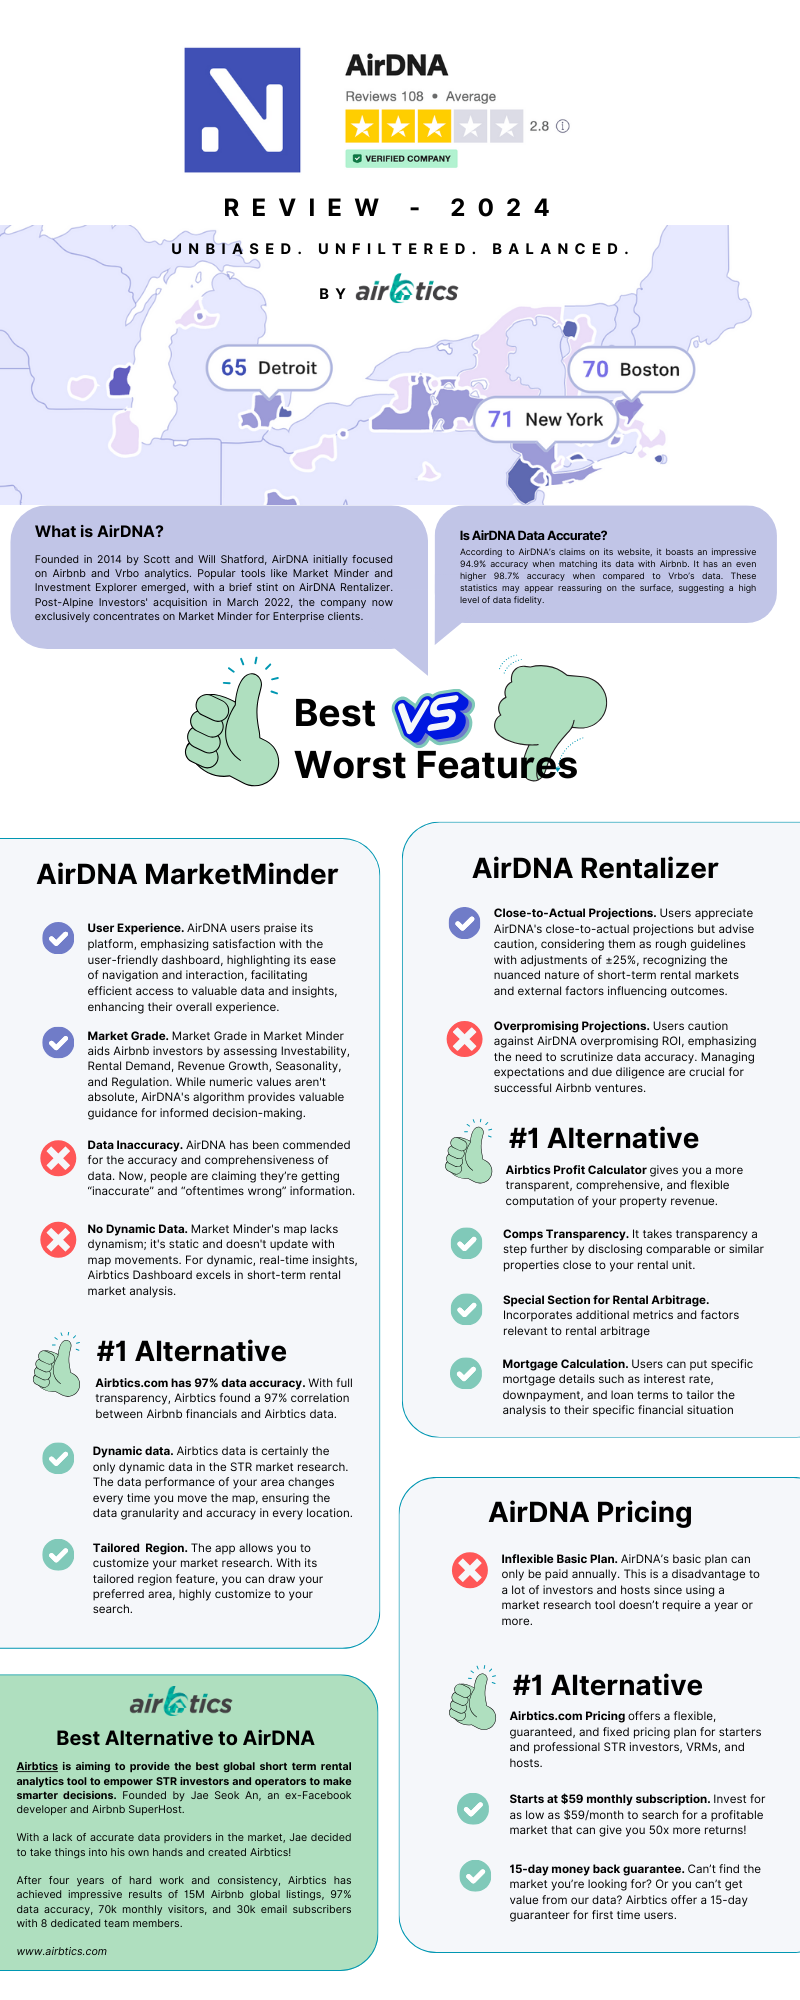
AirDNA was founded in 2014 by Scott and Will Shatford. Headquartered in Denver, the company’s initial focus was on providing data analytics and insights related to Airbnb and Vrbo listings. Over time, AirDNA gained popularity among short-term rental hosts and investors, offering valuable tools and market data to help users enhance the profitability of their rental properties.
Initially, their emphasis was placed on showcasing two primary products: Market Minder and Investment Explorer (no longer available). Over the years, they also added their very own Airbnb calculator called AirDNA Rentalizer. However, their core focus has now shifted exclusively towards Market Minder and catering to Enterprise clients. In March 2022, Alpine investors acquired AirDNA.
They made a huge update to their product in October 2023. Users can now subscribe to the annual plan only. They’ve acquired Arrivalist (location intelligence platform) and Uplisting (vacation rental management software) in 2024.
According to the company disclosure, AirDna scrapes or collects data on over 10 million Airbnb and Vrbo rentals in over 120,000 international markets. They say that scraping Airbnb data from a host of servers is legal, and we second that.
In addition to this, AirDNA also partners with channel managers, hosts, and property management systems to diversify its sample size. This partnership sources data from an additional 1.1 million properties worldwide.
While this is the case, AirDNA updates its rental database every first week of the month. Sure, AirDNA scrapes STR data daily. But it is not presented in real time. This means that the freshest that you can get was from the previous month, and AirDNA only updates its database 12 times a year. In comparison to other AirDNA alternatives, they have a much longer timeline.
Since we’re talking about rental analytics, accuracy matters a lot. After all, you’re paying for the information that will greatly impact your financial security. So, is AirDNA accurate?
According to AirDNA’s claims on its website, it boasts an impressive 94.9% accuracy when matching its data with Airbnb. It has an even higher 98.7% accuracy when compared to Vrbo’s data. These statistics may appear reassuring on the surface, suggesting a high level of data fidelity.
AirDNA qualifies its claim by stating that its data has the smallest margin of error when compared to Airbnb and Vrbo’s SEC financial filings. Despite the unavoidable margin of error in any data analysis, I’d still say that AirDNA’s accuracy is impressive in this context.
However, it’s essential to delve deeper into what these accuracy figures truly mean. AirDNA may be accurate for city-specific data. But later you will learn about the quality of their neighborhood-level data, which matters more to most investors.
While Airbnb is a regulated industry, Airbnb rental analytics are not. This means that there is no regulatory body that audits the quality of STR data sold by different companies.
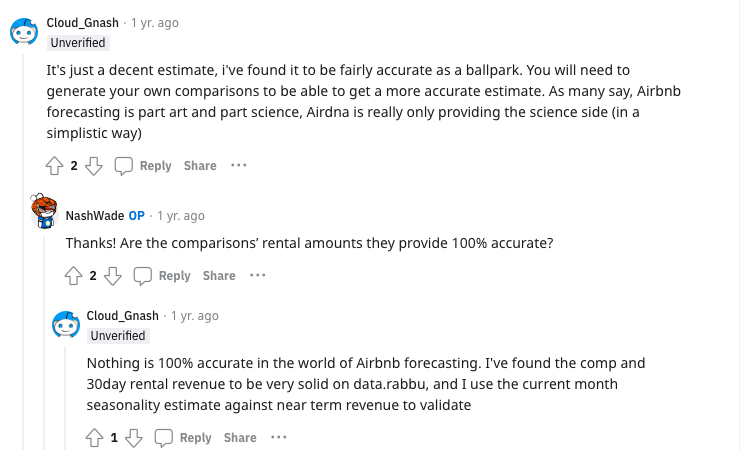
AirDNA Reddit thread, some users seem satisfied with the AirDNA data. It’s important to note that their accuracy can be seen as a good starting point, providing a close estimate.
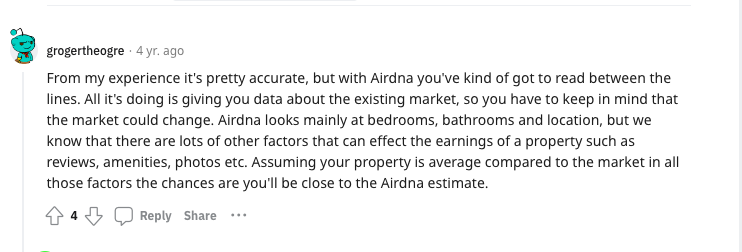
Many consider Airbnb to be a combination of both art and science. AirDNA primarily offers the scientific, data-driven aspect in a simplified manner. So, while AirDNA’s data serves as a valuable scientific foundation, fine-tuning your rental, Airbnb listing, and hosting will still help you achieve optimal earnings.
In this part, we will discuss the main selling points of AirDNA, particularly:
As promised, we will be balanced in talking about AirDNA features. We’ll shed light on both their strengths and areas where improvement may be needed. Additionally, we’ll take a step further by incorporating AirDNA Reviews from the actual users who have voiced their experiences across various online platforms. This approach ensures that you get a comprehensive understanding of AirDNA’s capabilities and its impact on users.
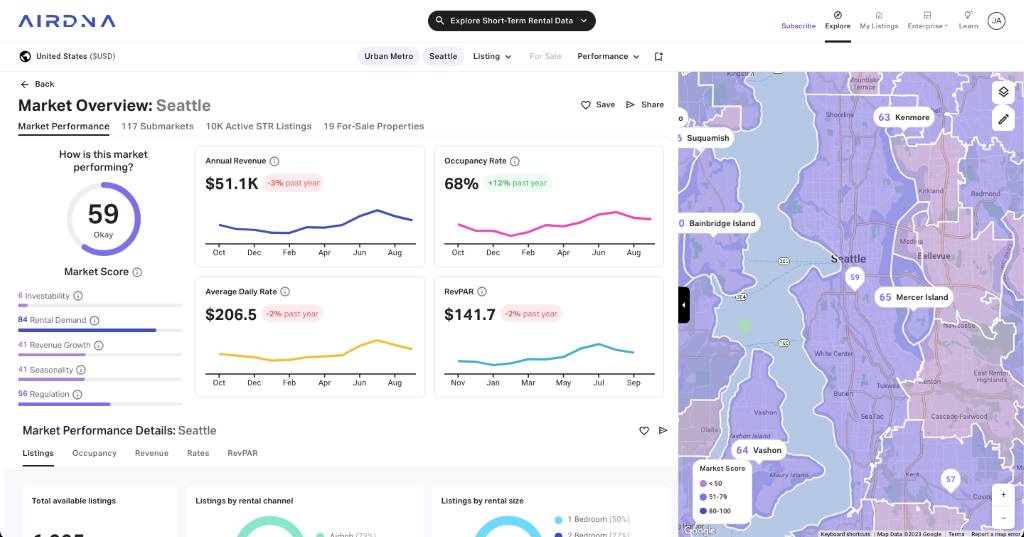
MarketMinder is the AirDNA dashboard designed for STR investors searching for profitable Airbnb markets. This comprehensive tool follows the performance of 10 million listings in more than 80,000 cities worldwide.
To help investors gauge investment viability, Market Minder has a Market Grade section which provides insights into your prospect city’s local market condition based on:
Each of these data points has its separate rating calculated by AirDNA’s algorithm. With their overall average, the Market Grade is benchmarked against the best 2,500 Airbnb markets worldwide to have a comprehensive assessment.
MarketMinder also provides historical Airbnb data averaging key performance indicators of short-term rentals in the city you’re searching. These include:
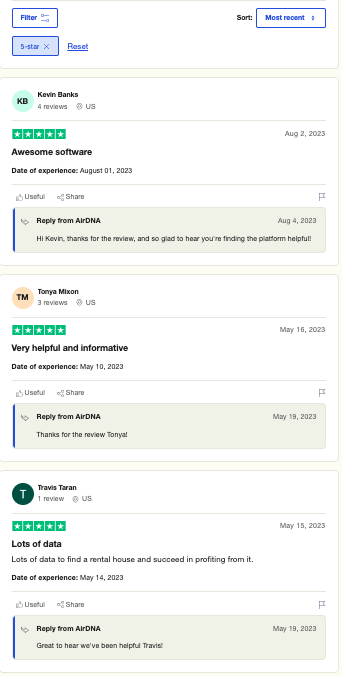
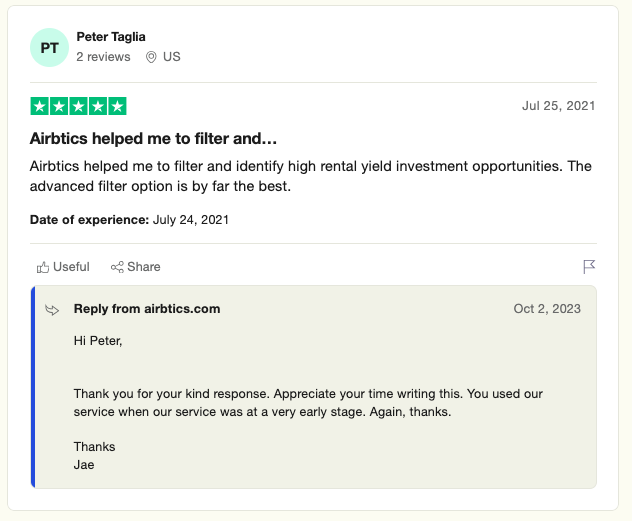
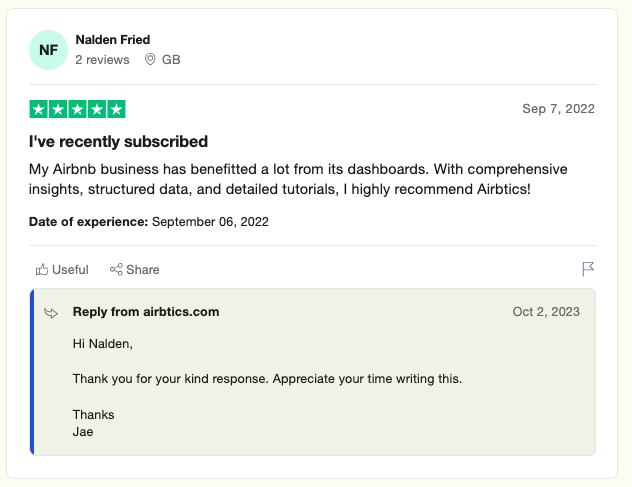
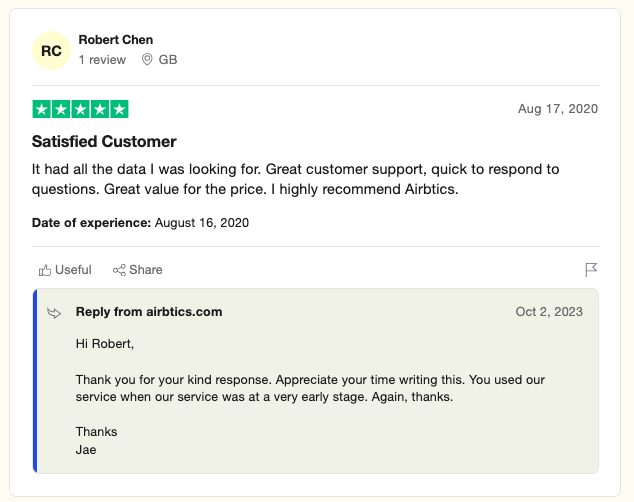
User Experience. Users of AirDNA consistently express their satisfaction with the platform, particularly when it comes to their experience with the dashboard. They frequently laud the platform for its user-friendliness, finding it remarkably easy to navigate and interact with. This ease of use is a crucial factor in enhancing their overall experience, allowing users to efficiently access the wealth of data and insights that AirDNA provides.
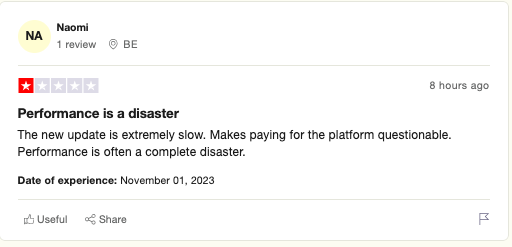
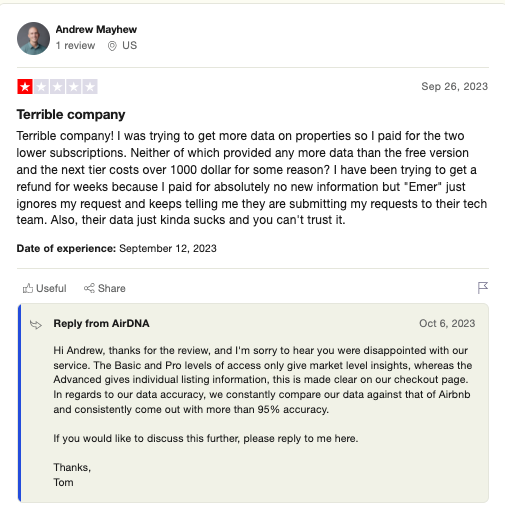
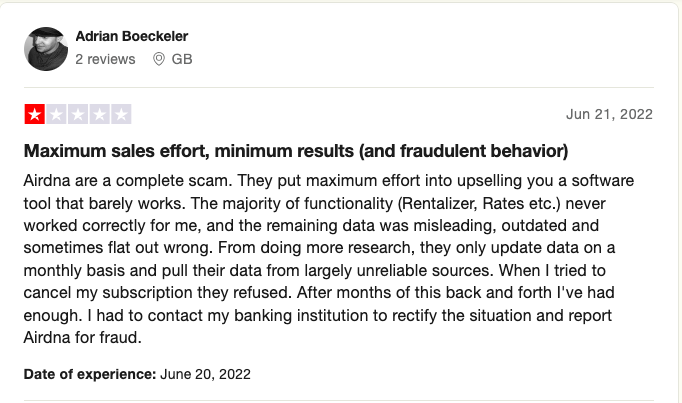
Disappointed users did not mince words in voicing out their frustrations with AirDNA. They have not held back in conveying their dissatisfaction and concerns regarding the platform’s performance and the extent to which it meets (or falls short) of their expectations.
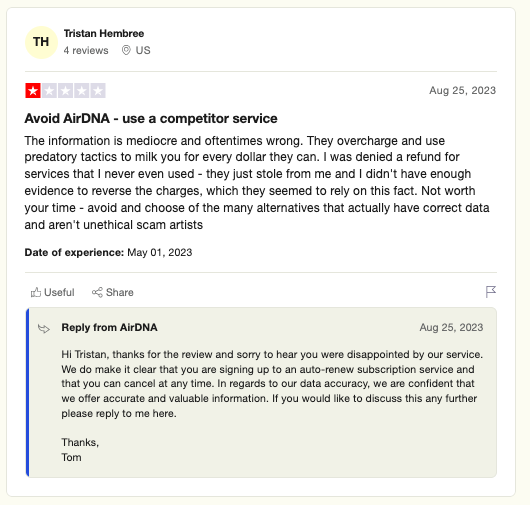
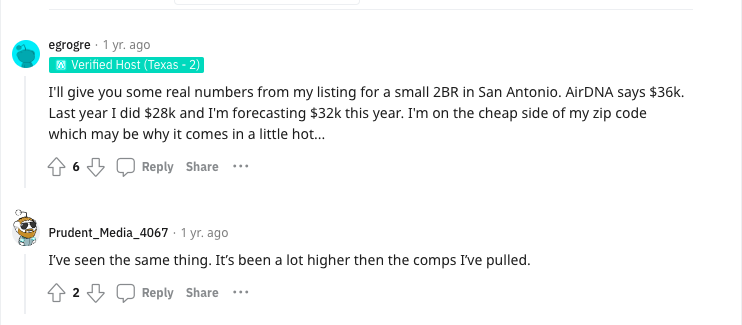
Data Inaccuracy. Previously, AirDNA has been commended for the accuracy and comprehensiveness of data. Now, people are claiming they’re getting “inaccurate” and “oftentimes wrong” information.
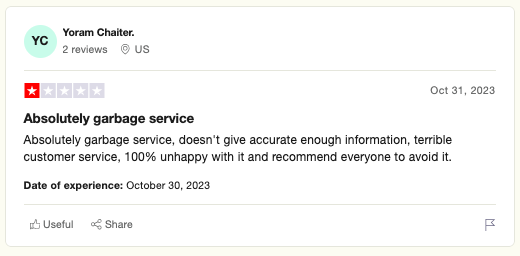
Their candid AirDNA reviews provide valuable insights into the challenges that some users have encountered using the platform. These things need to be considered, especially since people do not appreciate the new changes that AirDNA rolled out this September 2023.
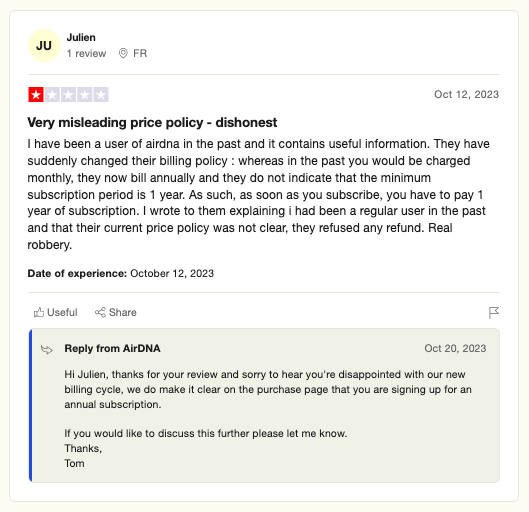
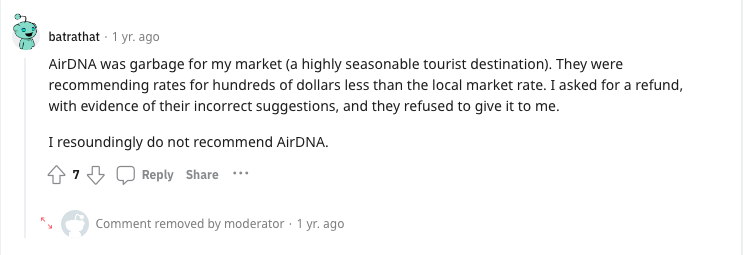
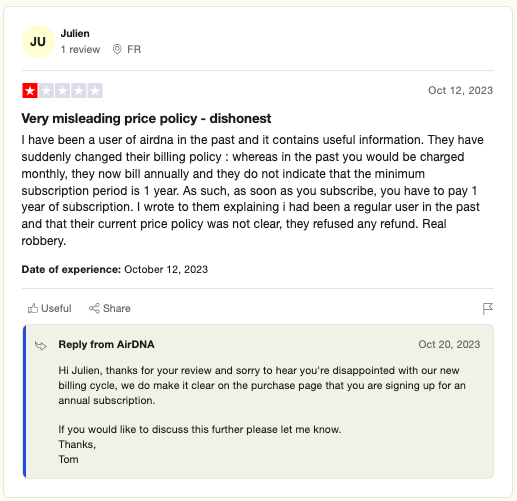
To put salt in the wound, users have found it difficult to ask for a refund. This is especially the case since AirDNA subscriptions are now billed annually.
Without a doubt, the Market Grade section in the Market Minder is helpful, especially for first-time Airbnb investors. Let’s have a recap of what Market Grade offers:
Knowing what these terms mean is one thing, but getting their numeric value in your prospective market can be a great guide. It’s crucial to emphasize that these values are not absolute, but rather they are generated through AirDNA’s algorithm. While this may add a layer of complexity to the interpretation, I trust that it still offers a good lead.
We see the reason why the map is just on the side, and not at the forefront of the dashboard.
The map on the Market Minder does not have a dynamic feature. This means that the data does not get updated with every move or drag of the map. In other words, it’s just static or stuck.
When it comes to market analysis for short-term rental investments, dynamic analytics prove to be exceptionally valuable. They offer real-time, up-to-date insights that can greatly assist both investors and property managers in analyzing market trends. This feature is only available on the Airbtics Dashboard.
Notice how the data gets updated with every move of your finger. So, you can sweep through your preferred city knowing which neighborhood is the most profitable!
You can read more about Airbnb Dynamic Data from our article.
Market Minder also has “Submarkets.” It has its own dedicated tab that shows the different geographical segmentations of your chosen Airbnb city.
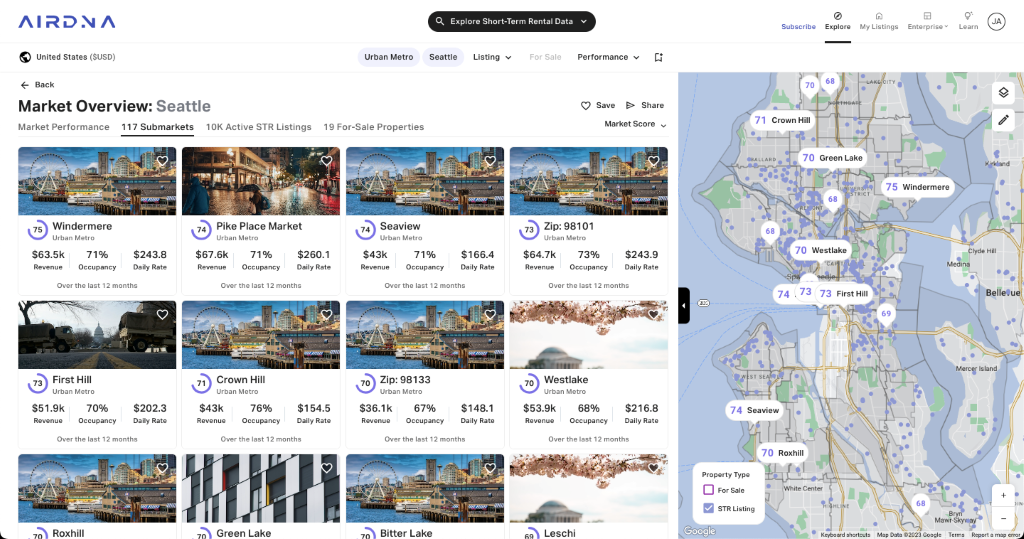
We admit that this is a useful feature. However, these submarkets are already pre-determined by AirDNA. It means they are not customizable.
On Airbtics, you can enjoy the flexibility of creating your own custom markets. They can be as small as a neighborhood or as big as ten. We do not regard formal geographical boundaries here. That’s how flexible we can be!
Why does this matter? So you can understand your own Airbnb Submarket better!
This is arguably the most popular Airbnb calculator online. AirDNA Rentalizer can predict the STR performance of your prospective property anywhere in the world. To use this feature, you need to provide the following information:
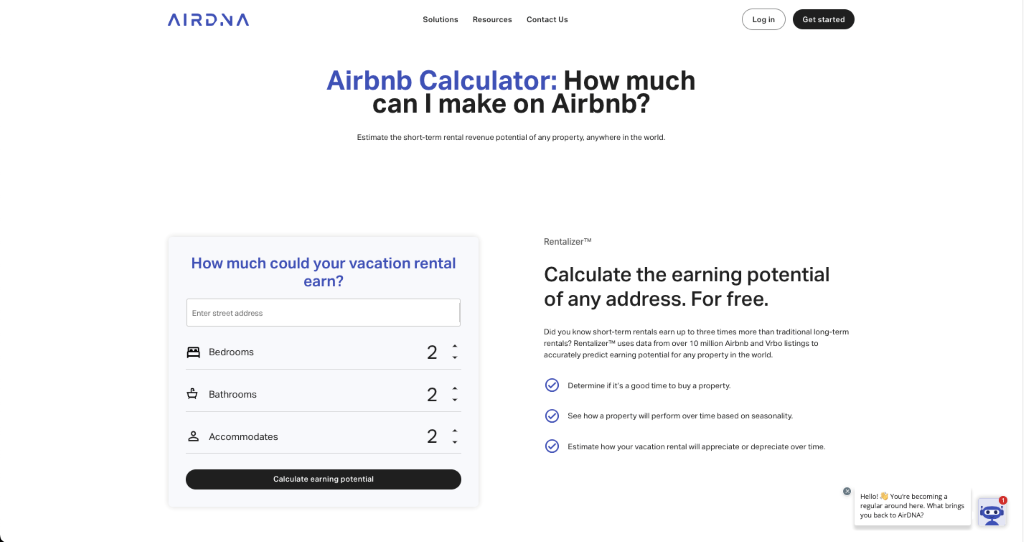
We already have a full review of the AirDNA Rentalizer. Know from the article about the pros and cons of using the calculator as well as its best alternative. But to keep this one running, let’s go on with what users have to say about the AirDNA calculator.
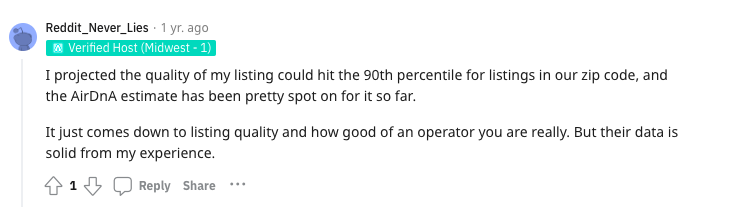
User opinions on the accuracy of AirDNA Rentalizer paint a diverse picture. Some express genuine satisfaction with its precision, with some even emphatically stating that it provided spot-on projections.
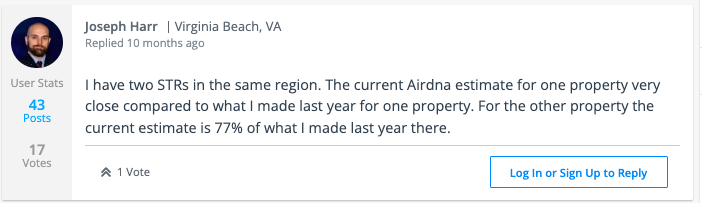
Close-to-Actual Projections. A separate group of users acknowledges that while the tool’s estimates may not be exact, they come remarkably close to reflecting their actual earnings.
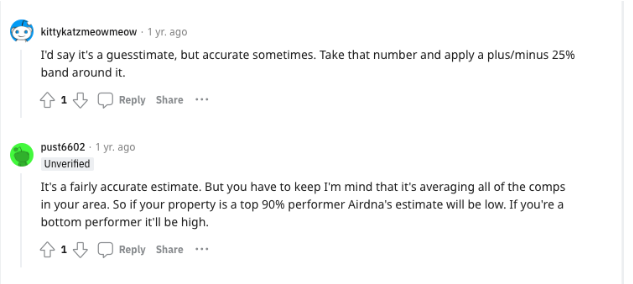
But there’s an even further side of customers whom we may consider as still satisfied. However, they are still cautious and advise people to manage their expectations.
They suggest taking the projections as a rough guideline rather than a definitive prediction. They remind people to adjust around ±25 percent from AirDNA’s estimate.
This sentiment may highlight the dynamic and nuanced nature of short-term rental markets, where factors beyond the tool’s control can influence outcomes. On the other hand, this may signal a bit of accuracy on the part of the calculator.
Overpromising Projection. A common concern raised by AirDNA users centers on the platform potentially overpromising the projected return on investment (ROI).
This apprehension highlights the importance of scrutinizing the accuracy and reliability of data and insights provided by AirDNA. Users seem to want to understand whether AirDNA’s projections align with the actual outcomes in the real world.
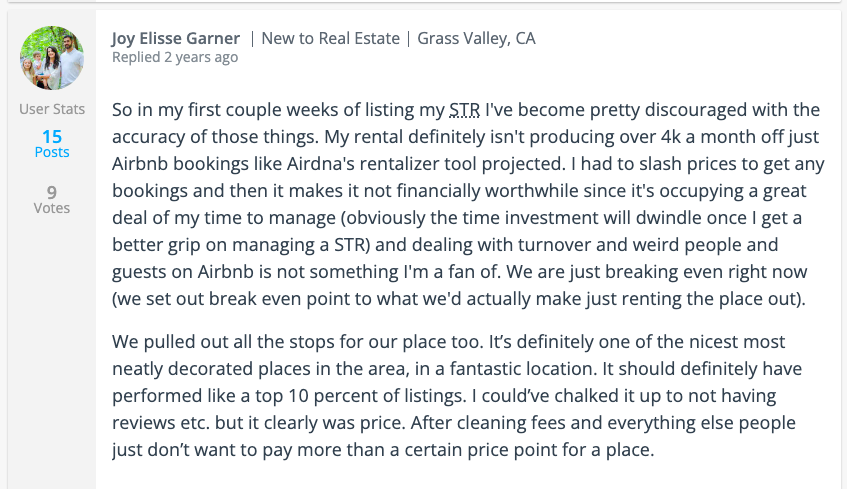
This recurring theme underscores the importance of managing expectations and conducting due diligence when using AirDNA. Take AirDNA data with a grain of salt to make your Airbnb thrive and not just keep afloat.
AirDNA’s Smart Rates is a specialized tool designed for Airbnb hosts. It is a dynamic pricing feature that helps them optimize their property’s occupancy rate and revenue.
Smart Rates responds to the need to adjust nightly rates based on seasonal demands. This way, hosts can attract bookings during low seasons and maximize income during peak seasons. This flexibility allows hosts to maintain a steady stream of revenue all year round.
We’d say that it is a useful tool, even for investors. Now that investors have found an Airbnb property, they can use Smart Rates to see how their properties perform.
The good thing about Smart Rates is you can determine your own comp set. A competitive set is a group of properties with similar attributes to your own. This means you can handpick your direct competitors and see how they’re doing! You can save a minimum number of 5, but you can extend this to up to 20 properties as long as your own market allows.
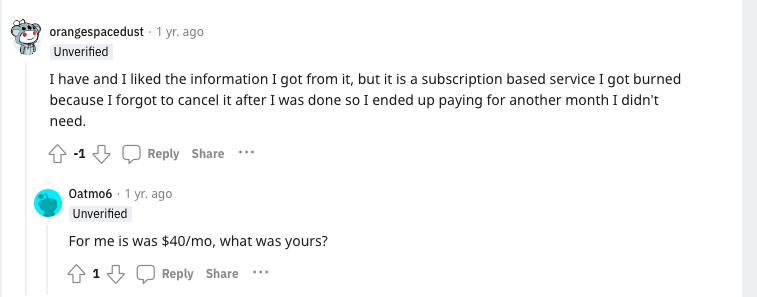
AirDNA has four subscription plans. Three of these are billed annually, while one is “forever free.” Each subscription plan follows a feature-based model, which users can choose from depending on their needs and preferences.
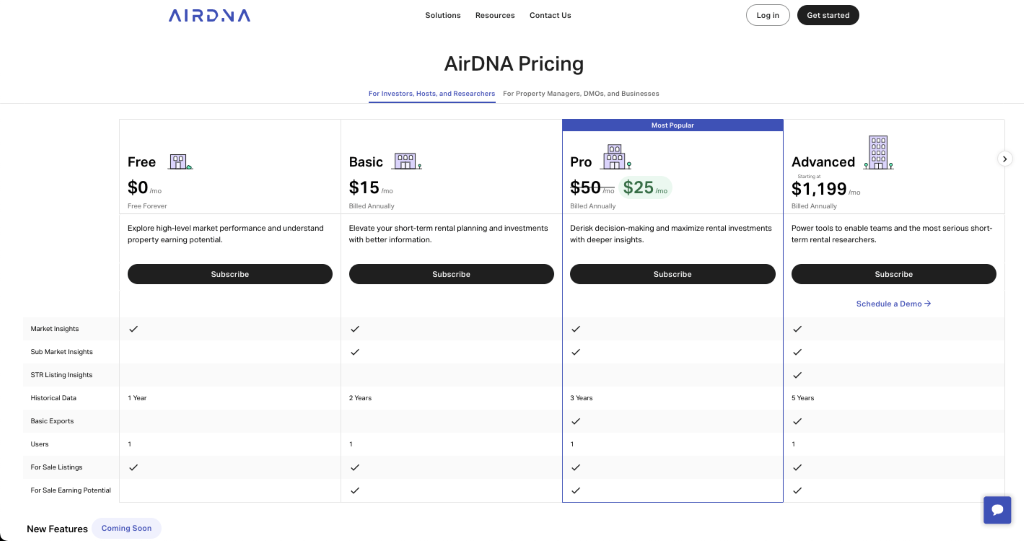
Before choosing a paid subscription, bear in mind that it will be billed annually. This means that you will be paying for a whole year even if you’re not satisfied with AirDNA data.
Most likely, you will go for either Basic or Pro plans. Based on the hundreds of investors that Airbtics has provided data for, finding a profitable short-term rental usually takes less than a month.
Yes, less than a month.
If you’ve already found a property (even if it will be profitable based on rental analytics) are you still willing to pay for the data you will no longer need?
It’s something that you have to think about, considering that you will spend a significant amount of money on a property.
And that’s already the best-case scenario.
What if you feel that you have been duped? You’re frustrated with the services that you paid for. Yet, you can never get a refund. This has already been the concern of a lot of disappointed AirDNA customers.
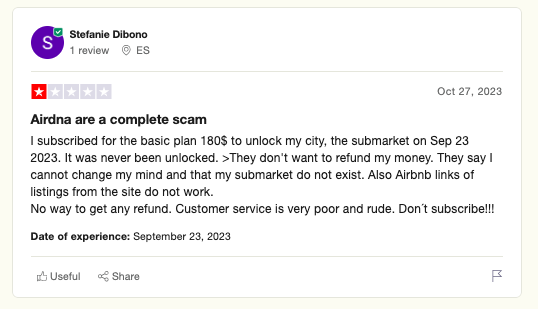
On Airbtics Dashboard, no need to unlock your city or submarket because you can access them all on your own.
Airbtics pricing plans have always been transparent. You can choose our affordable plans with monthly billing. You can also get -35% off on any of our plans if you choose to be billed annually.
This way, you’ll only pay for the data that you need. And although it’s sad to see you go after finding your property, we’re still happy that Airbtics has helped you!
.
It’s very easy to go for the most popular for anything. But instead of going with the flow, why not dig more and go for the best one there is? Luckily, the best one can also give value for your money!
Try Airbtics! Our plan starts at only $59 / month for 1 market. With this entry plan, you can experience many features that a rental analytics tool should have:
Plus, we also have a great Customer Support team!
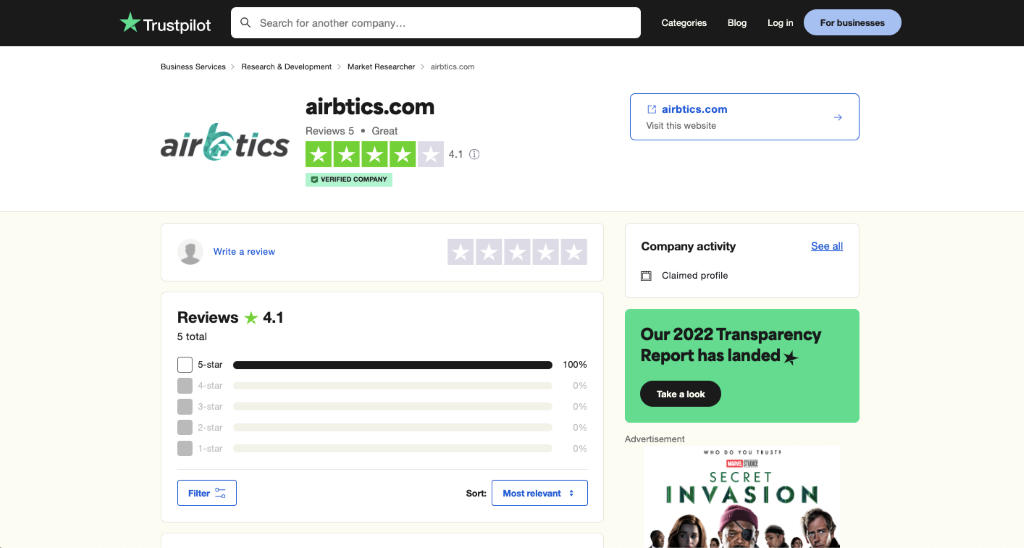
AirDNA reviews on Trustpilot paint a clear picture of the divided sentiments, with a stark divide between 5-star (35%) and 1-star (40%) ratings. It appears that users either highly appreciate AirDNA’s services or they experience profound disappointment with the product.
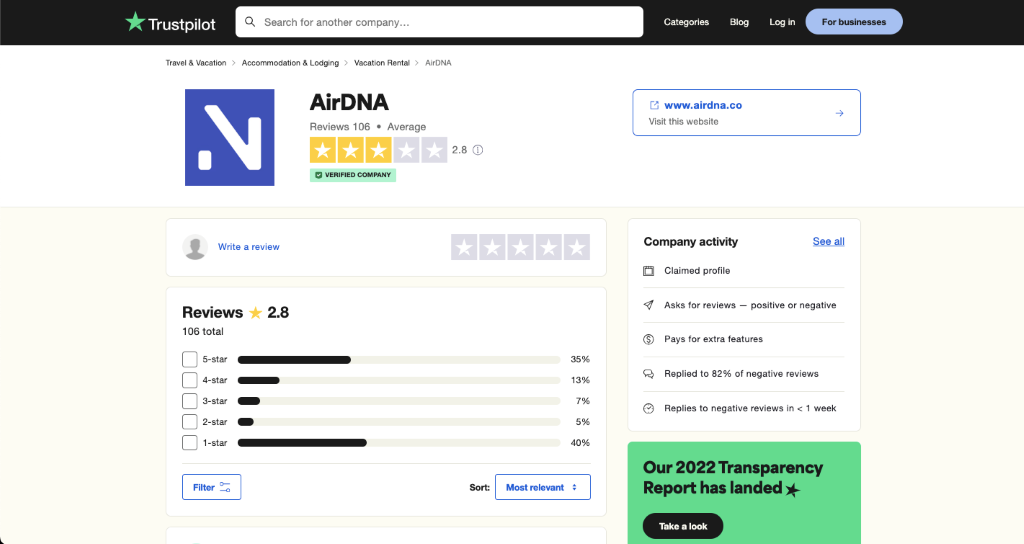
This stark contrast in ratings emphasizes the polarizing nature of AirDNA’s impact on users. AirDNA reviews on Trustpilot are a clear illustration of how users’ experiences with AirDNA can sharply differ. It highlights the importance of carefully considering individual needs and expectations when deciding to use AirDNA.
In this article, we have given you a straightforward and thorough look at the AirDNA platform. While we admit that it’s our competitor, this AirDNA review comes from the place of industry knowledge. As you have seen, we have been fair in reviewing AirDNA.
We have mentioned the strengths of the AirDNA. It’s a decent platform, after all. In addition to this, we have also shared proofs of satisfied AirDNA customers.
But we have also wanted to achieve balance. We have shown its areas for improvement as well as AirDNA redlags. These include the perceived inaccuracies by users, its poor customer support, and its misleading pricing structure. These complaints are all valid, considering that AirDNA is expensive. But AirDNA’s major red flag is its one-year locked-in policy with zero possibility for a refund.
If these things are shady to you, you might as well try Airbtics – the best AirDNA alternative!
[elementor-template id=”61999″]
[elementor-template id=”74925″]