Sulla base dei dati Airbtics del periodo September 2025 to August 2026, questa pagina mostra le migliori località Airbnb per investire in Italy con statistiche e approfondimenti chiave, come le normative sugli affitti brevi, il numero di annunci, il tasso di occupazione, la tariffa giornaliera media e il fatturato annuale. Ciò consente di scoprire le città più redditizie per investire, acquistare e possedere proprietà in affitto su Airbnb in Italy.
I mercati di questa pagina sono ordinati per il grado Airbtics, non per il numero di annunci. Il grado confronta rendimento, crescita del fatturato e occupazione (domanda) con gli altri mercati di questa classifica, poi tiene conto della normativa sugli affitti brevi.
Rendimento: Fatturato annuo degli affitti brevi diviso per il prezzo dell'immobile. Un rendimento più alto sale in classifica.
Crescita: Variazione del fatturato rispetto all'anno precedente. Una crescita più rapida sale in classifica.
Domanda: Tasso di occupazione medio degli ultimi 12 mesi. Un'occupazione più alta sale in classifica.
Trova i migliori mercati Airbnb con il nostro strumento interattivo
Usa il nostro Market Explorer interattivo per trovare i posti migliori dove avviare un Airbnb in Italy. Confronta più mercati fianco a fianco, applica filtri come normative, budget (prezzi degli immobili o degli affitti) e dimensioni del mercato, e scarica i risultati in Excel.
Negli ultimi anni, Italy è emersa come una delle migliori destinazioni per investire in affitti brevi grazie alle sue popolari attrazioni turistiche, alle fiorenti attività commerciali, alla crescente presenza di nomadi digitali e a città vivaci come Palermo, Castellammare Del Golfo and Arzachena. Con milioni di visitatori internazionali in arrivo ogni anno, la domanda di alloggi per vacanze è in crescita, rendendo Airbnb in Italy un'opzione lucrativa sia per gli investitori locali che stranieri.
Grazie alla forte domanda dei viaggiatori, Italy offre tariffe giornaliere medie (ADR) competitive, tassi di occupazione sani e un potenziale di guadagno attraente nei migliori mercati Airbnb. Che tu stia cercando di avviare la tua prima attività su Airbnb con un budget modesto o di aggiungere una proprietà di lusso al tuo portafoglio, Italy offre località redditizie per soddisfare il tuo budget e le tue aspirazioni di investitore.
Top 3 Airbnb markets in Italy by Market Grade
These are the three highest-graded Airbnb markets in Italy. Market Grade compares yield, revenue growth, and occupancy (demand) with the other markets on this page, then adjusts for short-term rental regulation. The chart repeats those three percentiles in text so the ranking is readable without the graphic.
Palermo is rank 1 of 94 markets in this Italy ranking by Airbtics Market Grade A, with 22.6% short-term rental yield, 68.0% occupancy, and +12.3% year-over-year revenue growth.
Compared with the other markets on this page, Palermo ranks top 7% for yield, top 7% for growth, and top 14% for demand. The market shows an average daily rate of €95, annual revenue of €24,339, a rent gap of 4139.2%, 5,674 active listings, strict short-term rental regulation, and a typical 2-bedroom property price of €133,815.
Market gradeA
Yield22.6%
Revenue growth+12.3%
Occupancy68.0%
Average daily rate€95
Annual revenue€24,339
Rent gap4139.2%
Active listings5,674
2-bedroom price€133,815
RegulationStrict
Percentile versus other Italy markets on this page. Farther from the center is stronger.
Castellammare Del Golfo is rank 2 of 94 markets in this Italy ranking by Airbtics Market Grade A, with 21.0% short-term rental yield, 64.0% occupancy, and +12.7% year-over-year revenue growth.
Compared with the other markets on this page, Castellammare Del Golfo ranks top 9% for yield, top 6% for growth, and top 37% for demand. The market shows an average daily rate of €115, annual revenue of €27,669, a rent gap of 4394.4%, 1,129 active listings, strict short-term rental regulation, and a typical 2-bedroom property price of €133,815.
Market gradeA
Yield21.0%
Revenue growth+12.7%
Occupancy64.0%
Average daily rate€115
Annual revenue€27,669
Rent gap4394.4%
Active listings1,129
2-bedroom price€133,815
RegulationStrict
Percentile versus other Italy markets on this page. Farther from the center is stronger.
Arzachena is rank 3 of 94 markets in this Italy ranking by Airbtics Market Grade A, with 18.9% short-term rental yield, 65.0% occupancy, and +8.7% year-over-year revenue growth.
Compared with the other markets on this page, Arzachena ranks top 20% for yield, top 14% for growth, and top 29% for demand. The market shows an average daily rate of €252, annual revenue of €60,764, a rent gap of 5405.6%, 816 active listings, strict short-term rental regulation, and a typical 2-bedroom property price of €312,235.
Market gradeA
Yield18.9%
Revenue growth+8.7%
Occupancy65.0%
Average daily rate€252
Annual revenue€60,764
Rent gap5405.6%
Active listings816
2-bedroom price€312,235
RegulationStrict
Percentile versus other Italy markets on this page. Farther from the center is stronger.
Yield: top 20%
Growth: top 14%
Demand: top 29%
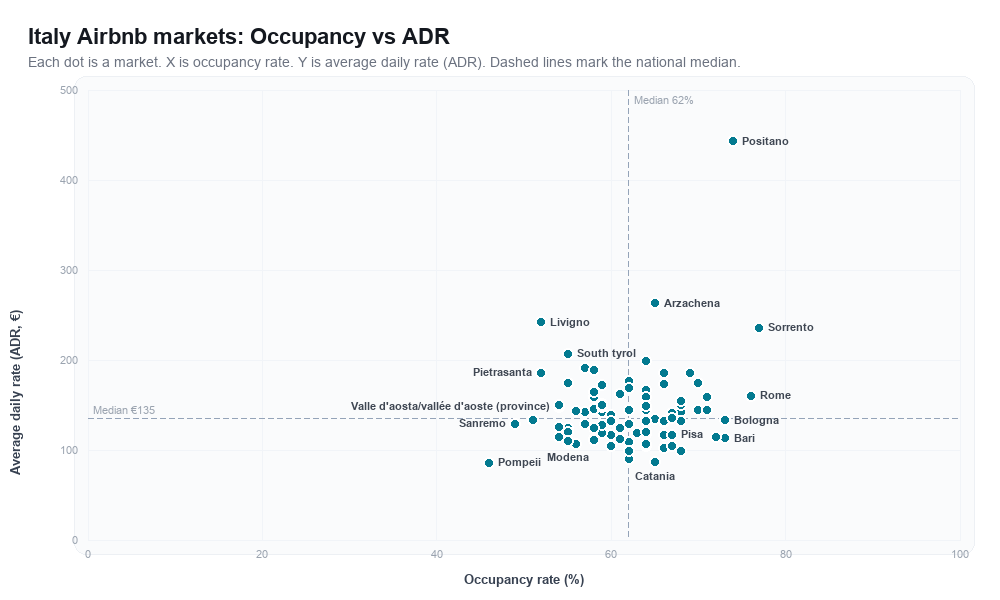
Analisi di saturazione del mercato: Italy
Each dot is a vacation rental market in Italy, plotted by
occupancy rate (x-axis) and average daily rate (ADR) (y-axis).
Dashed lines mark the national median.
Occupancy rate and average daily rate for each Italy market plotted in the chart above, in Market Grade order.
Market
Occupancy rate
Average daily rate
Palermo
68.0%
€95
Castellammare Del Golfo
64.0%
€115
Arzachena
65.0%
€252
San michele al tagliamento
64.0%
€190
Tempio pausania
64.0%
€160
Rome
76.0%
€154
Valle d'Aosta/Vallée d'Aoste (Province)
54.0%
€142
Catania
65.0%
€83
Sorrento
77.0%
€226
Alghero
67.0%
€135
Bergamo
72.0%
€110
Noto
57.0%
€136
Trapani
62.0%
€86
Monopoli
70.0%
€139
Polignano A Mare
68.0%
€144
Martina Franca
59.0%
€142
Orosei
68.0%
€127
Fasano
54.0%
€144
Melendugno
58.0%
€107
Ceglie Messapica
58.0%
€157
Cala Gonone
64.0%
€143
Syracuse
64.0%
€103
Langhe
51.0%
€128
Lecce
62.0%
€96
Pula
64.0%
€153
Florence
71.0%
€153
Naples
64.0%
€99
Venice
69.0%
€178
Pisa
67.0%
€112
Salerno
62.0%
€105
Padova
67.0%
€100
Taormina
70.0%
€167
Lake Iseo
58.0%
€140
Viareggio
54.0%
€142
Cefalu
71.0%
€138
Gallipoli
54.0%
€121
Matera
55.0%
€106
Marciana
64.0%
€126
Castelsardo
59.0%
€123
Lipari
61.0%
€107
Nardo
55.0%
€106
Portoferraio
67.0%
€131
Lake Garda
62.0%
€162
Torino
66.0%
€98
Bologna
73.0%
€128
Cagliari
64.0%
€113
Verona
64.0%
€130
Bari
73.0%
€108
Lake Maggiore
59.0%
€136
Lucca
60.0%
€133
Trieste
66.0%
€112
Olbia
65.0%
€130
San Vito Lo Capo
66.0%
€125
Porto Cesareo
66.0%
€126
Fiumicino
61.0%
€107
Parma
62.0%
€95
Assisi
56.0%
€103
Ostuni
55.0%
€115
Positano
74.0%
€425
Castiglione della pescaia
59.0%
€144
Vieste
58.0%
€107
Lerici
58.0%
€153
Otranto
60.0%
€127
Lake Como
62.0%
€170
South Tyrol
55.0%
€198
Siena
62.0%
€124
Rapallo
58.0%
€140
Lido di Jesolo
55.0%
€168
Finale Ligure
56.0%
€137
Camaiore
59.0%
€165
Ravenna
59.0%
€115
Capoliveri
64.0%
€139
San Gimignano
59.0%
€145
Forio
58.0%
€119
Pompeii
46.0%
€82
Livigno
52.0%
€232
Milano
68.0%
€136
Genoa
60.0%
€112
La Spezia
63.0%
€114
Modena
55.0%
€104
Sanremo
49.0%
€124
Rimini
55.0%
€119
Perugia
60.0%
€99
Oristano
54.0%
€110
Levanto
68.0%
€148
La Maddalena
62.0%
€138
Greve in chianti
61.0%
€156
Imperia
57.0%
€124
Monte argentario
58.0%
€181
Trento
61.0%
€120
Costa Rei
66.0%
€166
Amalfi Coast
66.0%
€179
Cortona
57.0%
€183
Pietrasanta
52.0%
€178
Compare property prices, short-term rental yield, rent gap, annual revenue, and supply growth in the
Airbtics Market Explorer watchlist.