fbpx
🎉 FREE WEBINAR - July 24th, 11am / 8pm CET - Learn Airbtics in 7 Minutes - Revenue and Market Analysis Tips and Best Practices!
Categories
Guides

What Does Airbnb Mean? A Guide to the Most Skeptical Investors

What does Airbnb mean? It depends on whom you ask this question. Discover the multifaceted meaning of Airbnb by reading this article!

Home > Resources > Guides 

What Does Airbnb Mean

What does Airbnb mean? It depends on whom you ask this question. Discover the multifaceted meaning of Airbnb by reading this article!

What Does Airbnb Mean? Affordable Accommodation for Travellers

Airbnb is a pioneering online service platform that allows property owners to share their spaces with travelers seeking cheaper accommodations. From a cozy room to an entire property like a house or an apartment, Airbnb offers a vast variety of options to travelers worldwide.

What Does Airbnb Mean

Airbnb stands for “Air Bed and Breakfast.” And how the company got its name is just as interesting. 

The origin of the term Airbnb dates back to 2007 when its founders (Joseph Gebbia and Brian Chesky) decided to rent out a lounge room in their San Francisco apartment to the artists attending a design conference. 

All these two visionary minds could offer were 3 air mattresses for a good night’s sleep and breakfasts in the morning. They called it “Air and Breakfast,” a name that would be shortened to a catchier “Airbnb.” Little did they know that this small and quirky endeavor would revolutionize the travel and hospitality industry.

From Air Mattresses to a Global Empire

Brian and Joseph had an idea that would forever change the way the world thought about travel and accommodation. And yet, the initial days of Airbnb were not without challenges. Brian and Joseph had to entice the interest of their target market with a clever tactic.

Setting and Expanding the Online Market

The 2 founders reached out to the attendees of the design conference. They offered them a place to stay with a promise of a homey experience. They even took professional photos to make their apartment look appealing. 

This simple yet innovative approach set the foundation for the company’s future success. In fact, this business model that they had in 2007 is pretty much what most Airbnb hosts have been doing since.

In 2008, Nathan Blecharczyk joined the team and brought computer programming expertise to this promising company. The trio launched their website in 2009 and expanded beyond 3 humble air beds. They introduced hosts to the idea of renting out their entire homes or spare rooms, providing a diverse range of accommodations to travelers.

$112 Million Investment

The turning point came in 2011 when Airbnb secured a $112 million investment from Andreessen Horowitz, a venture capital firm. This infusion of capital allowed the company to scale its operations and take its platform worldwide. Airbnb launched a dedicated mobile app, making booking accommodations easier than ever before. 

Airbnb Now

In September 2021, Airbnb became a publicly traded company. Its market capitalization 2 years after was $87.07 billion. With a whopping more than 5 million active listings in 220 countries, Airbnb has truly become a global platform for unique travel experiences. 

How Does Airbnb Make Money?

Many hosts find the Airbnb platform appealing because they only have to cover a fixed 3% service fee based on the booking subtotal. This subtotal includes their nightly rate, as well as additional charges they may apply to guests like cleaning fees, However, the subtotal does not include Airbnb fees and applicable taxes. 

On the flip side, guests shoulder a service fee of approximately 14% of the booking subtotal. 

What Does Airbnb Mean? Lucrative Opportunities for Real Estate Investors

If you’re a skeptical real estate investor, it’s perfectly understandable to approach new opportunities with caution. After all, your investments are not just financial endeavors. They can make or break your financial security. But we’ll address the concerns that might be holding you back from considering Airbnb as a lucrative addition to your real estate investments.

1. Diversify Your Real Estate Portfolio with Airbnb

Diversification is an important factor in smart investing. Airbnb allows you to widen your real estate portfolio beyond traditional long-term rentals. By doing Airbnb, you tap into a market that has a consistent demand from travelers such as tourists and business professionals. This diversification can help mitigate risks and increase your income potential.

2. Higher Profit Margins and Cash Flow

This is why some investors have shifted to Airbnb. It has the potential for higher profit and consistent locations. Unlike traditional rentals, Airbnb units can price premium rates, especially in desirable locations such as tourist spots and business centers. With careful pricing and effective management, you can maximize your returns and maintain a steady stream of income.

3. Tax Benefits and Deductions

Investing in Airbnb properties can offer substation tax advantages that you won’t see in other real estate investments. Expenses related to your Airbnb business such as maintenance and utilities can be tax-deductible. See the other items that can be written off and how to file them from “A Guide to Writing Off Airbnb Expenses.”

4. Flexibility and Control

If you are skeptical about property management, rest assured that Airbnb provides an unparalleled level of flexibility and control. You decide when to host guests and set your rental rate as you see fit.

What Does Airbnb Mean? Potential Risks

While Airbnb may offer enticing opportunities to real estate investors, it’s crucial to approach this type of investment with a degree of caution. This time, a little bit of skepticism can become handy when it comes to protecting your investments. 

1. Regulatory Uncertainty

One of the most significant concerns surrounding Airbnb investment is the ever-changing regulations. Local governments are still adapting to the Airbnb landscape. This means that rules regulating Airbnb properties can vary widely from one city to another. This is why it’s essential to research and comply with local regulations to avoid potential legal issues.

2. Active Management

While Airbnb offers flexibility and control over your property, it also requires active management. Hosting guests, coordinating check-ins and check-outs, cleaning, and maintenance demand time and effort. Investors should consider whether they have the resources and willingness to manage the daily operations of running an Airbnb. If not, they’ll have to hire property managers, which can diminish their profits.

3. Income Variability

The income that an Airbnb makes can fluctuate based on seasonal demands or economic conditions. So, be prepared by building financial reserves for periods of low occupancy and reduced income. They can affect cash flow.  

4. Property Security and Liability

Hosting strangers on your property carries inherent security risks. While Airbnb provides host damage protection, it is still better to ensure your property to minimize potential security issues. Hosts are also responsible for any liability in case of accidents or injuries on their properties.

What Does Airbnb Mean? Providing Excellent Service

Airbnb hosting is the business of renting out your property to guests on a short-term basis through the Airbnb platform. Individual property owners as well as full-fledged companies can use Airbnb hosting as a way to earn income by offering accommodation from a wide range of options. These include a cozy spare room or an entire property. 

What are Airbnb Hosting Requirements?

Before starting as an Airbnb host and opening your doors to your short-term rental business, it’s essential to understand the hosting requirements. In this section, we’ll discuss the key prerequisites and standards set by Airbnb to ensure that guests will have an enjoyable stay.

1. Hosts are responsible for confirmed bookings and a reliable check-in process.
2. Hosts are expected to be readily available to attend to any guest’s questions and unforeseen issues before or during their stay.
3. The listing page should reflect an accurate description of the place at the time of the reservation. Make sure that guests will be able to enjoy the listed features and amenities from their check-in to check-out.
4. Before check-in, the place should be thoroughly cleaned and free from any health and safety hazards.

While Airbnb is strict about these rules, they will still reach out to hosts to clarify if such violations occur. 

How Do You List Your Property on Airbnb?

Here is a step-by-step guide on how to list your property on Airbnb:

1. Create an Airbnb Account.
2. Complete your profile with a picture and verify your identity.
3. Click “Become a Host” to start listing your property.
4. Describe the details of your space. Specify the property type, number of bedrooms and bathrooms, and the number of guests it can accommodate. 
5. Set your house rules, pricing, and the availability of your property.
6. Upload clear and well-lit photos that showcase your property’s best features
7. Create a catchy yet accurate property description
8. Choose your booking settings, whether you want to accept instant bookings or prefer to review guests beforehand
9. If you have any, add amenities and features such as wifi, kitchen, or hot tubs.

How Do Hosts Get Paid on Airbnb?

Hosts have various payout options such as PayPal, Fast Pay, Payoneer debit cards, Western Union, and bank transfers. The availability of the said options will depend on the host’s location. Hosts can select their preferred method in the “Payment & Payouts” section of their Airbnb accounts.

Airbnb will release the payment minus their fees within 24 hours following the guest’s check-in date.

What Does Airbnb Mean? Endless Possibilities

The rise of Airbnb has undeniably reshaped the landscape of real estate investment. What airbnb stands for is the contradiction between promising opportunities and potential pitfalls to investors. It will depend on what you’re willing to give it. The journey from a modest San Francisco apartment with only air mattresses to a global empire valued at over $91 billion is a testament to Airbnb’s disruptive power and appeal.

For skeptical real estate investors, it’s crucial to weigh the advantages and challenges of investing in Airbnb rentals. On the positive side, diversifying your real estate portfolio via AIrbnb can provide consistent income streams, higher profit margins in desirable locations, and attractive tax benefits. The flexibility and control investors can enjoy should not go unnoticed. This allows them to tailor their hosting experience to their preferences.

Airbnb can be a lucrative addition to your real estate investments. But unlike any other investment, it requires careful consideration, proactive management, and a willingness to adapt to changing circumstances. With the right strategy and discipline, Airbnb can indeed be a golden opportunity in this modern world of real estate.

Want to start an Airbnb business? Start with an Airbnb analyzer tool!

Unlock Worldwide
Short-Term Rental Data
Find unsaturated neighborhoods with the highest occupancy history.

Unlock Worldwide
Short-Term Rental Data
Find unsaturated neighborhoods with the highest occupancy history.

Annual Airbnb Revenue in Bemidji minnesota, USA

Bemidji, Minnesota| Airbnb Market Data & Overview | USA Bemidji, Minnesota Airbnb Market Data & Overview USA Is it profitable to do Airbnb in Bemidji, …

Read More →
Best Airbnb Markets in Asia

Best Airbnb Markets in Asia Best Places to Buy an Airbnb in Asia Last updated on: 12th May, 2024 Asia 87% of Asian people responded …

Read More →
Annual Airbnb Revenue in Kalispell montana, USA

Kalispell, Montana| Airbnb Market Data & Overview | USA Kalispell, Montana Airbnb Market Data & Overview USA Is it profitable to do Airbnb in Kalispell, …

Read More →
Annual Airbnb Revenue in Loveland colorado, USA

Loveland, Colorado| Airbnb Market Data & Overview | USA Loveland, Colorado Airbnb Market Data & Overview USA Is it profitable to do Airbnb in Loveland, …

Read More →
Annual Airbnb Revenue in Monte rio california, USA

Monte Rio, California| Airbnb Market Data & Overview | USA Monte Rio, California Airbnb Market Data & Overview USA Is it profitable to do Airbnb …

Read More →
Annual Airbnb Revenue in Cambridge massachusetts, USA

Cambridge, Massachusetts| Airbnb Market Data & Overview | USA Cambridge, Massachusetts Airbnb Market Data & Overview USA Is it profitable to do Airbnb in Cambridge, …

Read More →

investing in turkey real estate
Categories
Guides

Where to Get Airbnb Rental History?

Looking where to find Airbnb rental history? Then, look no more because we’re telling you where to find it!

Home > Resources > Guides 

Airbnb Rental History

Looking where to find Airbnb rental history? Then, look no more because we’re telling you where to find it!

Airbnb Rental History

In Airbnb, success isn’t just about having a beautiful property, an active listing, or giving your guests the best experience. It’s about making informed decisions based on real insights. That’s where Airbnb rental history from a reliable data analytics tool becomes valuable. 

Airbnb rental history is not just a record of past bookings. It provides a historical narrative that can serve as a roadmap to unlock the full potential of your property. In this article, we will delve deeper into the importance of getting Airbnb historical data while using the best Airbnb analytics tool.

Can I check the Airbnb rental history of properties in my area?

You cannot, unless you approach the host to share with you this information.

Only Airbnb hosts can access rental history. The same goes for your own Airbnb rental history.

Obviously, this approach is not ideal.

Imagine approaching thousands of Airbnb hosts only to find out their Airbnb rental history. First, it will cost you so much time. Second, the results won’t guarantee you success if you only do it once. Even if all of the hosts you ask share their Airbnb rental history with you, it can take time for you to compile and analyze this information.

So, what should you do then?

Data Analytics for Airbnb Rental History

The age of modern technology offers a more convenient way of getting Airbnb rental history. Short-term rental analytics has streamlined this process. It can give you the historical and granular data of any Airbnb market. Let’s highlight “Airbnb market.” 

Getting the Airbnb rental history of a market, instead of individual properties, is like seeing the forest for the trees. It gives you a holistic picture of the trends in occupancy, nightly rate, and annual revenue – just to name a few.

But let’s say you want to get the Airbnb rental history of properties having the same attributes as your own Airbnb property. Then, you should go for an analytics tool that has advanced filters

As an example: From 6,413 active Airbnb listings in Seattle, we’re now just down to 125 listings with Hot Tub by using the advanced filters. Notice that data points such as revenue, occupancy rate, and nightly rate, among others, change according to your chosen property attributes.

The most advanced data analytics tools not only have access to a broader range of data sources. They can also present this information in a more organized and user-friendly manner, making your analysis more efficient and insightful.

Why the Airbnb Rental History of A Market is Important?

Airbnb rental history from a powerful short-term rental analytics tool allows you to do the following

1. Check Performance

Understanding your property’s performance is the first step to enhancing it. But where will you compare it against? You compare it side by side with your Airbnb market. Is your property getting booked less compared to your direct competitors? If so, how can you improve your Airbnb booking?

2. Pricing Better 

In connection with the first part, Airbnb rental history allows you to gain insights into past nightly rates of your market. By checking this, you can identify price-sensitive periods and adjust your rates accordingly. Therefore, you can maximize your revenue during such seasons.

3. Competitive Edge

You are in a fiercely competitive world of short-term rentals. But one of the most powerful tools at your disposal for achieving an edge is Airbnb rental history. By harnessing this data, you can benchmark your property against similar listings in your area. You can gain valuable insights into what works best for others and then integrate these practices into your long-term strategy.

4. Adapting to Seasonal Fluctuations

Seasonal fluctuations are common in the Airbnb industry, Historical data helps you anticipate these shifts by showing when demand tends to peak or dive. Armed with this valuable knowledge, you can adjust your pricing and exert more effort in marketing during low periods. 

How To See Airbnb Rental History of Any Market Worldwide?

On the Airbtics Dashboard, type in the name of the market whose rental history you would want to see. Instantly, you will see the following powerhouse trio and more:

  • Annual Revenue
  • Occupancy Rate
  • Nightly Rate

Just to flex the advanced capabilities of the Airbtics Dashboard, let’s keep the filters we ticked before (2-bedroom entire house Airbnb properties with hot tubs). So, you can check for yourself the Airbnb rental history of properties with the same features as yours.

AirbticsDashboard
Seattle Airbnb Market with advanced filters: 2-bedroom entire house Airbnb properties with hot tubs)
Historical Revenue, Occupancy Rate, and Nightly Rate

The graphs for Airbnb rental history of Annual Revenue, Occupancy Rate, and Nightly Rate for this specific property attribute are already shown from the get-go.

You can instantly see that January is the slow month for this property type with a median revenue of $3,250. The same also shows in occupancy rate (50%) and nightly rate ($200). These data are just for 2023. 

On the Airbtics Dashboard, you can always go back to previous years to check if it’s a pattern. Just click the “View Historical Trends” of any of the key metrics.

Hosts probably already know that January is the lowest month in Seattle for short-term rentals. This is caused by the challenging weather conditions – with both the Winter season and persistent rain (because it is Seattle). 

However, Airbnb hosts would not know the impact of these weather conditions on their rentals without data analytics. For example, properties in the 50th percentile show a significantly lower occupancy rate than the average 74%.

Airbnb Rental History

This also holds true for the nightly rate. Due to decreased occupancy during this period, hosts have adjusted their pricing downward in order to remain competitive. 

Airbnb Rental History
Booking Lead Time

Hosts in the 75th and above percentile managed to price above the market average in January 2022 and 2023. This is because hosts might have noticed that guests book their rentals more than 30 days in advance. This shows that their properties have a long booking lead time. This is confirmed by the Airbtics Dashboard.

Booking lead time refers to the number of days between the booking date and the actual check-in date. This is another metric that Airbnb hosts need to check when optimizing their daily rate.

Long booking lead time can empower hosts to charge a higher rate since bookings are made in advance. Given this length of time, it allows Airbnb hosts to play with their nightly rate, to charge as high as possible until it hurts the occupancy rate. 

Hosts in the 75th percentile and above not only charged a higher nightly rate during a slow season in Seattle, but they also successfully secured bookings.

Analyze Airbnb Rental History with Airbtics

The importance of analyzing Airbnb rental history using a reliable data analytics tool cannot be overstated in the world of short-term rentals. This tool provides hosts with valuable insights that go beyond mere booking records.

By leveraging Airbnb rental history data, hosts can identify trends and patterns in their market. They can gain a competitive edge and ensure the long-term success of their Airbnb business.

Airbtics simplifies the process of analyzing Airbnb rental history and market data. With advanced filters and user-friendly intercase, Airbtics empowers hosts to make data-driven decisions effortlessly. By harnessing the insights provided by the Dashboard, hosts can elevate their property’s performance and navigate the Airbnb landscape with confidence.

In an industry where data is power, Airbnb rental history from Airbtics is not just a choice but a necessity for success in the short-term rental industry.

Wanna know if you’re leaving money on the table? Then check out this comprehensive and accessible Airbnb Profit Calculator!

Unlock Worldwide
Short-Term Rental Data
Find unsaturated neighborhoods with the highest occupancy history.

Unlock Worldwide
Short-Term Rental Data
Find unsaturated neighborhoods with the highest occupancy history.

Annual Airbnb Revenue in Lodi new jersey, USA

Lodi, New Jersey| Airbnb Market Data & Overview | USA Lodi, New Jersey Airbnb Market Data & Overview USA Is it profitable to do Airbnb …

Read More →
Annual Airbnb Revenue in Inverness california, USA

Inverness, California| Airbnb Market Data & Overview | USA Inverness, California Airbnb Market Data & Overview USA Is it profitable to do Airbnb in Inverness, …

Read More →
Annual Airbnb Revenue in Carnegie pennsylvania, USA

Carnegie, Pennsylvania| Airbnb Market Data & Overview | USA Carnegie, Pennsylvania Airbnb Market Data & Overview USA Is it profitable to do Airbnb in Carnegie, …

Read More →
Annual Airbnb Revenue in Stanton california, USA

Stanton, California| Airbnb Market Data & Overview | USA Stanton, California Airbnb Market Data & Overview USA Is it profitable to do Airbnb in Stanton, …

Read More →
Annual Airbnb Revenue in Worcester massachusetts, USA

Worcester, Massachusetts| Airbnb Market Data & Overview | USA Worcester, Massachusetts Airbnb Market Data & Overview USA Is it profitable to do Airbnb in Worcester, …

Read More →
Annual Airbnb Revenue in Key largo florida, USA

Key Largo, Florida| Airbnb Market Data & Overview | USA Key Largo, Florida Airbnb Market Data & Overview USA Is it profitable to do Airbnb …

Read More →

investing in turkey real estate
Categories
Guides

Airbnb Market Report: Maximizing Your Investment Portfolio with Data-driven Insights

Maximize ROI with Airbtics Pro’s Airbnb Market Report! Discover the top Airbnb cities in the US, the UK, Canada, and Australia. Learn more in this article!

Home > Resources > Guides 

Airbnb Market Report

Maximize ROI with Airbtics Pro’s Airbnb Market Report! Discover the top Airbnb cities in the US, the UK, Canada, and Australia. Learn more in this article!

In the 21st century, Airbnb has revolutionized how people travel and find accommodation. What started as a small startup with only 3 air mattresses to offer in its early days has morphed over the years into a global empire that has reshaped the travel and hospitality industry.  

There’s no stopping Airbnb. In fact, more and more investors are riding on the success of this platform, investing a high sum of money in the hope of getting a high return on investments. This is why understanding the Airbnb market becomes crucial more than ever.

Understanding the Airbnb Market

Airbnb’s business model is simple. It connects travelers with hosts who offer accommodation. The types of accommodation can range from a spare room to an entire property such as a house or an apartment.

This successful business model is so simple, that it hid under our noses. Why hadn’t we thought about it?  Today, Airbnb is a force to be reckoned with, operating in 220 countries that have a total of more than 5 million listings. 

The Importance of Airbnb Market Reports

Successful Airbnb investors do not see Airbnb as just a trend. It is a business for grownups that they have to run knowingly. For this reason, an Airbnb market report becomes handy. Staying informed about the latest trends offers the following advantages:

Making Calculated Decisions

Their primary goal is to maximize their ROI while managing the risks effectively. Staying informed of the latest trends and insights becomes a valuable tool in their rental property search. 

Knowing Competition Before It Even Starts

The Airbnb market is highly competitive, with numerous listings all in the ring fighting for travelers’ attention. Gaining a competitive advantage by knowing the market you are most likely to invest in is a must for achieving optimal occupancy rates and rental income. Learn which property type and the number of bedrooms are best in each market, and chances are high that you will outperform your competitors.

Airbtics Pro: Airbnb Market Reports

We understand that the search for profitable Airbnb locations can be challenging for a lot of investors. However, this is just business as usual at Airbtics, having been in the industry for over 3 years. On a daily basis, our team encounters Airbnb data on the bustling financial districts, picturesque coastal cities, vibrant university towns, and idyllic vacation hotspots worldwide that can be the best Airbnb market for investors with varying financial goals.

Leveraging the advanced features of our ever-reliable companion Airbtics Dashboard, we have compiled comprehensive Airbnb statistics by city in the following countries:

We have also included the median property prices in the best Airbnb cities. Our ultimate goal is to uncover the income potential of each market relative to its property cost by calculating their cap rates. After crunching the numbers and tabulating the results, we’re excited to share our findings with you. 

Quantifiable Data in Airbnb Market Report

The quantifiable data in the Airbtics Pro delves into the core of a short-term rental market. Knowing the following key data points allows Airbnb investors a holistic understanding of the intricate yet valuable set of numbers, trends, and patterns that shape an Airbnb market:

1. Airbnb Market Size

An Airbnb market report should include the total number of active Airbnb listings. This metric is a key indicator of the short-term rental market in a specific area. This helps you assess not only the strong presence of the Airbnb platform but also the level of competition in the market.

Airbnb Market Report
2. Airbnb Occupancy Rate

The average Airbnb occupancy rate offers an overview of the guests’ dependency on  Airbnb throughout the year. The report should also include regional differences in occupancy, giving insights into local demand and potential investment opportunities or challenges in each market.

Airbnb Market Report
3. Airbnb Annual Revenue

Analyzing and comparing the revenue of Airbnb markets helps to narrow down the profitable investment opportunities. Higher average revenue means greater profit potential. This potential revenue can also be your guide in future-proofing your investment strategies. This data can help you make informed decisions about holding or acquiring new properties. If you plan to sell the property eventually, knowing that it has a high average revenue can help you set a higher selling price and still attract potential buyers or investors.

Airbnb Market Report
4. Median Property Price

Comparing median property prices helps investors locate the markets that align with their budget and investment goals. Simply put, this is the price for a market entry. Knowing this helps investors assess the affordability of property, estimate initial investment costs, and evaluate potential returns on investment.

Median property can also measure the economic health of your investment location. Rising property prices may suggest strong economic growth. On the other hand, relatively stagnant prices may indicate economic challenges. The trend of these prices can serve as a reference to whether a market has a history of property value appreciation. 

Unlock Investment Success with Airbtics Pro

Airbnb has grown from a humble concept to a household name worldwide, and investors are flocking to the best of the best cities for Airbnb to seize the opportunities it offers. To navigate this dynamic market successfully, you need data-driven insights.

Subscribe now to Airbtics Pro, which offers valuable Airbnb market data in the US, UK, Canada, and Australia.  Powered by the Airbtics Dashboard, our reports cover crucial metrics such as market size, occupancy rate, annual revenue, and median property prices. With this data at your fingertips, you can identify the most promising investment opportunities, understand market dynamics, and optimize your returns!

Unlock Worldwide
Short-Term Rental Data
Find unsaturated neighborhoods with the highest occupancy history.

Unlock Worldwide
Short-Term Rental Data
Find unsaturated neighborhoods with the highest occupancy history.

Annual Airbnb Revenue in Miami lakes florida, USA

Miami Lakes, Florida| Airbnb Market Data & Overview | USA Miami Lakes, Florida Airbnb Market Data & Overview USA Is it profitable to do Airbnb …

Read More →
invest-in-portugal
Portugal’s Golden Returns: Maximising Revenue on Your Vacation Rental Investment

Whether you already own a vacation rental in Portugal, or you have plans to invest, this article will help you maximise revenue and get the …

Read More →
Annual Airbnb Revenue in East lindsey, UK

East Lindsey| Airbnb Market Data & Overview | UK East Lindsey Airbnb Market Data & Overview UK Is it profitable to do Airbnb in East …

Read More →
Annual Airbnb Revenue in Encinitas california, USA

Encinitas, California| Airbnb Market Data & Overview | USA Encinitas, California Airbnb Market Data & Overview USA Is it profitable to do Airbnb in Encinitas, …

Read More →
property management companies in Florida
Top 12 Property Management Companies in Florida

Why these Property Management Companies located in Florida? The Aim of this list is to give you a resource of reliable Top 11 Property Management …

Read More →
Annual Airbnb Revenue in 대전 한국-kr

대전| 에어 비앤비 수익률 & 에어 비앤비 통계 & 에어 비앤비 데이터 분석 | 한국 대전 에어 비앤비 수익률 & 에어 비앤비 통계 & 에어 …

Read More →

investing in turkey real estate
Categories
Guides

Population Rate and the Property Market

Population rate influences the city landscapes, especially housing markets. This is why investors consider this before investing in real estate.

Home > Resources > Guides 

Population Rate

Population rate influences the city landscapes, especially housing markets. This is why investors consider this before investing in real estate.

How Does Population Affect Housing?

Population rate is an important demographic indicator that measures the change in the number of people in a specific area over a given period. Typically expressed as a percentage, this rate is computed by subtracting the current population size from the previous one and then multiplying the difference by 100. 

Current population size – Previous population size * 100 = Population Rate

Population rate plays a vital role in shaping various aspects of a locality, including its economic and real estate landscape. In the content or property prices, the population rate can exert an influence on the housing market due to the following factors:

Population Rate
1. Local Economy

Population growth can signal a thriving local economy. As businesses expand and job opportunities increase, individuals and families are drawn to relocate. A strong economy can lead to higher income levels. These enable residents to afford more expensive homes and rents, contributing to the upward movement of property and rent prices.

2. Demand for Housing

A growing population stiffens the competition for housing. People migrating to progressive cities for better job opportunities and greater quality of life create a high demand in the housing market. This demand drives up property prices as buyers vie for limited housing options.

3. Rental Market

Not only do the property prices go high, but also rent prices. Population growth also intensifies competition in the rental market. Landlords can raise rent as demand is greater than the supply. 

4. Investor Interest

A growing population is a magnet for real estate investors looking to capitalize on increasing demand for properties. Investors may purchase homes with the expectation of property appreciation over time.

5. Infrastructure Development

City planners may invest in infrastructure and development projects to accommodate the rising population rate. Improved amenities, transportation systems, and public services can make a city more attractive. 

The population rate is not merely a statistic, but a driving force that shapes an urban landscape. It underscores the intricate relationship between demographics and property markets.

This makes it a key factor for homeowners, landlords, investors, and policymakers to consider when navigating the complex world of the local real estate sector. Understanding this connection is essential for these stakeholders seeking to make informed decisions in the ever-evolving landscape of the real estate market.

How to Get Insights Report on the Population Growth Rate?

To gain deeper insights into how population growth affects the property market in your area, consider leveraging the power of short-term rental analytics.  With Airbtics Pro, you can access comprehensive information and trends related to population growth and its impact on the following short-term rental markets:

Don’t miss out on the opportunity to stay ahead in the ever-evolving world of real estate. Take action today and explore the valuable insights available through Airbtics Pro to make intelligent choices in this dynamic market. Your real estate success starts with informed decisions – get started now!

Unlock Worldwide
Short-Term Rental Data
Find unsaturated neighborhoods with the highest occupancy history.

Unlock Worldwide
Short-Term Rental Data
Find unsaturated neighborhoods with the highest occupancy history.

Annual Airbnb Revenue in Norman oklahoma, USA

Norman, Oklahoma| Airbnb Market Data & Overview | USA Norman, Oklahoma Airbnb Market Data & Overview USA Is it profitable to do Airbnb in Norman, …

Read More →
Annual Airbnb Revenue in Swindon, UK

Swindon| Airbnb Market Data & Overview | UK Swindon Airbnb Market Data & Overview UK Is it profitable to do Airbnb in Swindon, UK? What …

Read More →
Top Property Management Companies Central coast, Australia

Top 13 Property Management Companies in Central Coast Top 13 Property Management Companies in Central Coast Last updated on: 14th June, 2024 This list aims …

Read More →
Annual Airbnb Revenue in Tampa florida, USA

Tampa, Florida| Airbnb Market Data & Overview | USA Tampa, Florida Airbnb Market Data & Overview USA Is it profitable to do Airbnb in Tampa, …

Read More →
Annual Airbnb Revenue in Springfield ohio, USA

Springfield, Ohio| Airbnb Market Data & Overview | USA Springfield, Ohio Airbnb Market Data & Overview USA Is it profitable to do Airbnb in Springfield, …

Read More →
Annual Airbnb Revenue in Melbourne florida, USA

Melbourne, Florida| Airbnb Market Data & Overview | USA Melbourne, Florida Airbnb Market Data & Overview USA Is it profitable to do Airbnb in Melbourne, …

Read More →

investing in turkey real estate
Categories
Guides

What is LTM in Airbnb? Tips and Tools to Leverage It

What is LTM in Airbnb data? Learn from this article what it means and how you can leverage it for your Airbnb success!

Home > Resources > Guides 

what is ltm

What is LTM in Airbnb data? Learn from this article what it means and how you can leverage it for your Airbnb success!

The dynamic Airbnb marketplace demands staying ahead of the curve. This goes beyond having a knack for hospitality. It demands a keen understanding of data analytics. This article delves into the pivotal role of LTM or “last twelve months” data in your Airbnb investment success. 

What is LTM?

LTM, or Last Twelve Months Data, refers to financial or performance data that covers the past 12-month period. This isn’t exclusive to short-term rentals. In fact, it is commonly used in business to provide a snapshot of a company’s performance over the past year.

For Airbnb investors, the Last Twelve Months (LTM) data serves as the financial compass guiding investment decisions in the short-term rental industry. It’s your lens to scrutinize the performance of Airbnb markets over the past year. This crucial tool allows you to brace yourself for the twists and turns of this sharing economy.

Where Can I Get The LTM Data of my Airbnb Market?

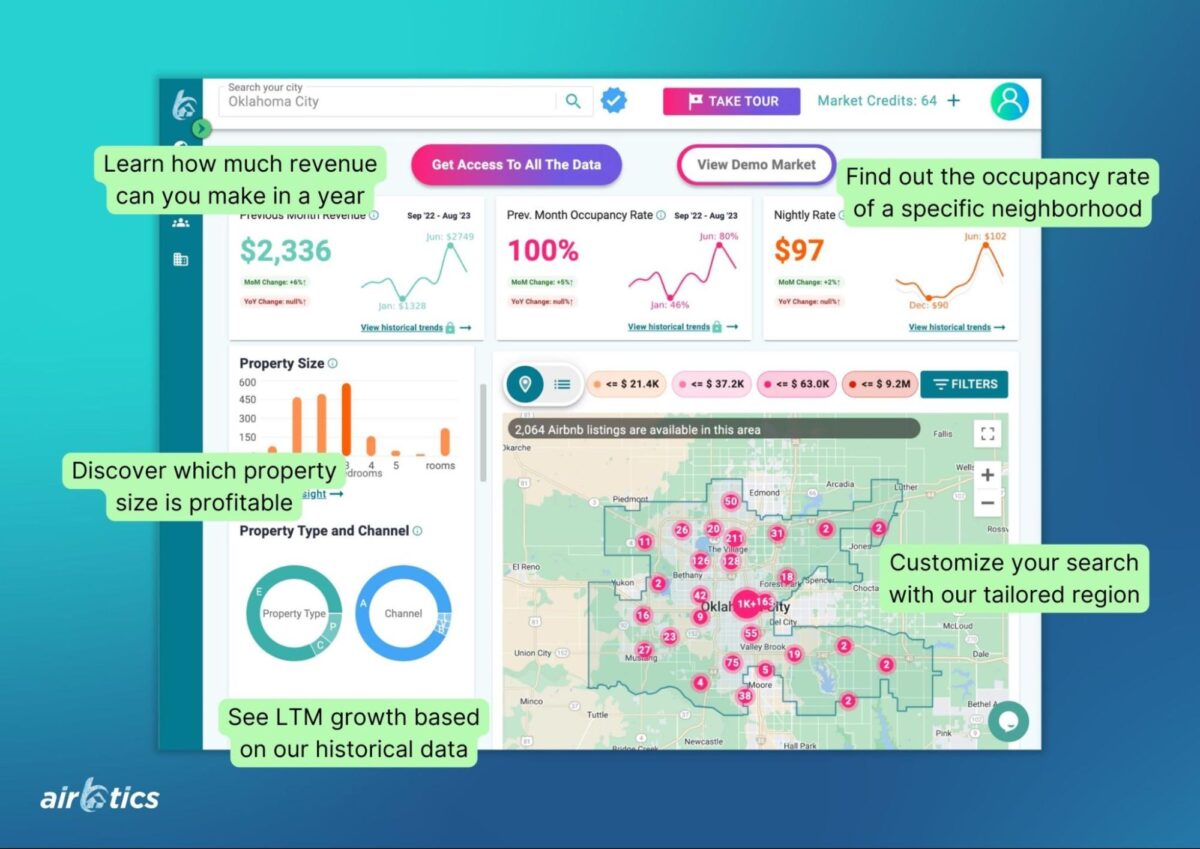
Type in your Airbnb market in the Airbtics Dashboard, and you will instantly see the LTM data of Revenue, Occupancy Rate, and Nightly Rate, along with other Airbnb metrics!

Source: Airbtics App

For a more comprehensive analysis, hover over the graphs to see the values!

The Uses of LTM in Short-Term Rental

The “Last Twelve Months” is a quantitative metric that holds immense value for investors, hosts, and property managers. By examining data from the past year, stakeholders can make informed decisions and implement strategic actions:

1. Understanding Seasonal Trends 

Analyzing LTM Airbnb data offers a significant advantage in gaining a comprehensive grasp of seasonal patterns. This knowledge empowers hosts and property managers to make well-informed pricing decisions: lower the nightly rates when demand is low. 

This is especially advantageous for Airbnb investors seeking to establish a more stable income stream by diversifying their investment portfolio. For instance, if their existing rental properties generate limited income during the third quarter of the year, they have the option to explore Airbnb markets that experience peak seasons during this period. 

what is ltm

For example, the Seattle Airbnb market’s average monthly revenue started to increase in March and has continued to have a steady rise since. 

This strategic diversification can help them balance and enhance their overall revenue flow.

For property investors and managers, the analysis of LTM data plays a pivotal role in budget allocation and resource planning. It provides insights into the expenses incurred over the preceding year, facilitating more accurate financial forecasting. Armed with this information, investors can strategically allocate funds for purposes such as property maintenance, marketing initiatives, or expansion efforts.

2. Competitive Benchmarking

Airbnb is a cutthroat industry. This is why hosts and property managers need to keep an eye on the competition. Analyzing LTM data allows you to compare your property’s performance to similar listings in your area. 

what is ltm

Seasonal fluctuations are expected in the hospitality industry, but has your rental fared well in the past 12 months in this regard? If you’re a host in Seattle, have you enjoyed at least a 60% Airbnb occupancy rate since March?

This benchmarking can help you identify the strengths and weaknesses of your Airbnb rental. Oftentimes, weaknesses can be addressed by pricing your property right!

3. Strategic Pricing

Airbnb is a dynamic platform that continually welcomes new listings. It’s essential to keep an eye on the average nightly rate to remain competitive. If you observe that similar listings consistently offer lower prices, you can fine-tune your pricing approach.

what is ltm

For example, the nightly rate in Seattle is $150. This is the average in the last twelve months. However, hosts set the nightly rate at $119 in February. If you kept a $150 rate around this time, that might be the reason behind not hitting at least 60% occupancy during that month. 

You can uncover pricing trends by delving into the LTM data. For instance, you may notice that specific seasons or regular local events increase the demand, which results in a higher nightly rate.

Adjusting your pricing strategy enables you to maximize your earnings during peak seasons. In Seattle, the market had a 100% median occupancy rate. This allowed hosts to earn around $172 nightly.

what is ltm
what is ltm

Striking the perfect balance between price and occupancy is crucial. Overpricing may lead to fewer bookings and more vacant nights. On the other hand, underpricing might attract bookings but limit your income potential. Regularly monitoring the average nightly rate allows you to pinpoint the optimal pricing strategy.

Harness the Power of LTM Data with Airbtics

In the fast-paced world of Airbnb investments, success hinges on data-driven decisions. Last Twelve Months Data is your compass, guiding you through the ups and downs of the short-term rental market. 

To harness its power, look no further than Airbtics. As you have seen, it’s so easy to use, allowing you to instantly gain insights into seasonal trends, competitive benchmarks, and strategic pricing. Elevate your game today and stay ahead of the curve!

Eyeing a rental property and wanna know its profit potential? The answer lies in

the most powerful Airbnb Calculator!

Unlock Worldwide
Short-Term Rental Data
Find unsaturated neighborhoods with the highest occupancy history.

Unlock Worldwide
Short-Term Rental Data
Find unsaturated neighborhoods with the highest occupancy history.

Melbourne airbnb rules
Airbnb Rules in Melbourne

Before you start to invest in a property in Australia, particularly in Melbourne, the primary key metrics that all investors need to know should be …

Read More →
Annual Airbnb Revenue in reims-france-fr

Reims| statistiques airbnb & simulateur airbnb | France Reims statistiques airbnb & simulateur airbnbFrance Est-il rentable de faire de l’Airbnb à Reims, France? Quel est …

Read More →
Annual Airbnb Revenue in South staffordshire, UK

South Staffordshire| Airbnb Market Data & Overview | UK South Staffordshire Airbnb Market Data & Overview UK Is it profitable to do Airbnb in South …

Read More →
Best Cities To Buy Rental Property In Australia

Best places to buy Rental Property in the Australia Best places to buy Rental Property in the Australia Last updated on: 1st May, 2024 Australia …

Read More →
Annual Airbnb Revenue in Santa monica california, USA

Santa Monica, California| Airbnb Market Data & Overview | USA Santa Monica, California Airbnb Market Data & Overview USA Is it profitable to do Airbnb …

Read More →
Annual Airbnb Revenue in Pagosa springs colorado, USA

Pagosa Springs, Colorado| Airbnb Market Data & Overview | USA Pagosa Springs, Colorado Airbnb Market Data & Overview USA Is it profitable to do Airbnb …

Read More →

investing in turkey real estate
Categories
Guides

RevPAN: Definition, Formula, and Uses

RevPAN: Definition, Formula, and Uses: Leverage RevPAN, or Revenue per Available Night, to boost property revenue and excel in the competitive Airbnb hosting landscape.

Home > Resources > Guides 

revpan

Leverage RevPAN, or Revenue per Available Night, to boost property revenue and excel in the competitive Airbnb hosting landscape.

What is RevPan?

Originally used in hotel accommodations and other hospitality establishments, RevPan provides insight into the property’s revenue-generating capability for each night that rooms or units are available.

In the context of vacation rental data, revenue per available night is a key performance metric to measure the average revenue generated per listing for each night it is available for booking. To calculate Airbnb RevPAN, you need to divide its total revenue by the total available nights.

RevPAN = Total Revenue  / Total Available Nights

You can set the time frame in the total revenue and total available nights. For example, you want to check the RevPAN of your listing in the last 30 available nights which have a total revenue of $6,482. The computation will look like this:

$6,482 / 30 Days = $216 per day is your RevPAN

How Can You Leverage RevPAN?

revpan

RevPAN provides insights into how a listing generates revenue on a nightly basis. This piece of information can help hosts improve the following aspects of their Airbnb business:

1. Pricing Strategy

RevPAN can help host set their nightly rates more effectively. Hosts may increase their rates during peak seasons and offer discounts during low-demand periods.

2. Length of Stay

RevPAN can help hosts encourage longer stays. If you find that longer bookings result in higher RevPAN, you can adjust your pricing to incentivize guests for more extended periods by offering weekly or monthly discounts.

3. Performance Tracking

Regularly tracking RevPAN allows hosts to evaluate the success of their pricing strategies and marketing efforts. If RevPAN is consistently low, it may indicate a need for adjustments in property management, marketing, and even amenities.

4. Investing in Improvements

If you think that your pricing is right for your listing, it may be that your property is the issue. Consistently low RevPAN may indicate the urgency to invest in property improvements. Remember that this is an investment that can later on command higher nightly rates. Make your property more attractive, and this will increase your RevPAN due to improved bookings.

Leveraging RevPAN

By leveraging this metric effectively, hosts can not only boost the revenue potential of their property but also elevate its overall performance in the competitive world of Airbnb. In the ever-evolving realm of short-term rental hosting, RevPAN is one of the yardsticks to achieve higher profitability and success.

Unlock Worldwide
Short-Term Rental Data
Find unsaturated neighborhoods with the highest occupancy history.

Unlock Worldwide
Short-Term Rental Data
Find unsaturated neighborhoods with the highest occupancy history.

Annual Airbnb Revenue in Whittier california, USA

Whittier, California| Airbnb Market Data & Overview | USA Whittier, California Airbnb Market Data & Overview USA Is it profitable to do Airbnb in Whittier, …

Read More →
airbnb vs renting
Airbnb vs Renting: Which is Right for YOU?

Airbnb vs Renting: Which is Right for YOU?: Curious if the grass is greener on the other side? Decide for yourself between Airbnb vs Renting …

Read More →
Annual Airbnb Revenue In Whistler British Columbia Canada

Whistler, British Columbia| Airbnb Market Data & Overview | Canada Whistler, British Columbia Airbnb Market Data & OverviewCanada Is it profitable to do Airbnb in …

Read More →
Annual Airbnb Revenue in Madison wisconsin, USA

Madison, Wisconsin| Airbnb Market Data & Overview | USA Madison, Wisconsin Airbnb Market Data & Overview USA Is it profitable to do Airbnb in Madison, …

Read More →
Ingresos anuales de Airbnb en malaga-españa

Malaga| Ingresos Airbnb y Rentabilidad Airbnb | España Malaga Ingresos Airbnb y Rentabilidad AirbnbEspaña ¿Es rentable hacer Airbnb en Malaga? ¿Cuál es la tasa de …

Read More →
Top Property Management Companies Long beach united states

Top 9 Property Managers in Long beach, United states Top 9 Property Managers in Long beach, United states Last updated on: 5th July, 2024 This …

Read More →

investing in turkey real estate
Categories
Guides

Median Property Price: Why Do We Use it in Real Estate?

Median Property Price: Why Do We Use it in Real Estate?: Why is median property price used in real estate transactions? Get the answer from this article!

Home > Resources > Guides 

Median Property Price

Why is median property price used in real estate transactions? Get the answer from this article!

Navigating the ever-evolving realm of real estate demands informed choices. Whether you’re hunting for your dream house, considering selling your current one, or diving into real estate investment, you need to grasp some critical terms.

One such essential metric is the median property price. In this article, we’ll introduce you to this trusted guide in the real estate world, break down this concept, and shed light on its importance!

What is the Median Property Price?

The median property price is the measure that finds the middle ground in the property prices within a specific location and time period. 

It is not to be confused with the average (mean) property price or average house cost, which can be skewed by extremely high or low values. 

Instead, imagine that all properties on sale are stacked from the cheapest to the most expensive. Then, the median property price is smacked right in the middle, providing a more balanced representation of the market. Everything above it is the higher price segment, and properties below it are more affordable. 

Why You Should Care About Median Property Price?

Understanding the median property price is crucial in the world of real estate for various stakeholders. Depending on your role, it provides the following insights and benefits:

1. House Hunters

The median property price is a vital tool for prospective homebuyers. It can give them a benchmark to assess whether a property is reasonably priced. If a property is significantly higher than the median, they may need to consider other options well within their budget.

Armed with this knowledge, homeowners may have a stronger case for negotiation. If a property is listed above the median, they can use this information to negotiate a more favorable deal.

2. Sellers

For those wanting to sell their property, the median property price is also valuable for setting a competitive asking price. Pricing your property too high above the median can scare off potential buyers. On the other hand, pricing it too far below may mean missing out on potential profits. The median property price can help you strike a balance.

3. Real Estate Investors

Real estate investors rely on median property prices to identify promising investment ventures. A rising median in a particular market can signal good potential for property appreciation and rental income. 

4. Real Estate Analysts and Professionals

Real estate experts and market observers rely on median property prices as a dynamic gauge for tracking market trends. This serves as a real-time indicator of the market trend. A sustained increase in median property price can mean a flourishing market, while a decline may hint at economic challenges. 

5. Policymakers

Local authorities and policymakers closely track median property prices to assess the economic well-being of their regions. A higher median price may indicate progress, while a lower median may raise concerns about affordability within the area.

Median property prices also influence government policies pertaining to zoning regulations, property taxation, as well as affordability initiatives. Policymakers use this data to formulate strategies that address housing needs and economic stability.

Learn the median property prices of the top 100 cities to Airbnb in the US!

What Are the Factors Affecting the Median Property Price?

Understanding what influences median property prices is crucial for anyone involved in the real estate market. Several factors can have a significant impact on these prices, and it’s essential to consider them when making real estate decisions. Here, we’ll delve deeper into the key factors that influence median property prices:

1. Supply and Demand

One of the most fundamental factors affecting median property prices is the balance between supply and Airbnb demand. Median property prices tend to rise when there’s a high demand for properties while the supply is limited.

This scenario often occurs in popular cities or neighborhoods with limited available housing. On the other hand, median home prices can remain stagnant or even decrease in areas with an oversupply of properties and lower demand.  Real estate analysts often use the supply-demand dynamic to assess market conditions and predict future price trends.

2. Location

As in any aspect of real estate, location also plays a pivotal role in determining median property prices. Properties located in highly desirable neighborhoods, with easy access to amenities, good schools, parks, and vibrant cultural scenes, tend to have a higher median house price.

People are often willing to invest more for the convenience and enhanced quality of life that prime locations offer. In contrast, properties in less sought-after or less accessible areas typically have lower median home prices.

3. Economic Conditions

The overall economic health of an area and broader economic conditions at the regional or national level have a substantial influence on property prices. Here’s how economic factors come into play:

Economic Growth: Strong economic growth in an area can boost median home prices as people flock to places with job opportunities and a rising standard of living.

Interest Rates: Fluctuations in interest rates can significantly impact the real estate market. When interest rates are low, mortgage borrowing becomes more affordable. This can drive up the median property price due to increased demand Conversely, higher interest rates can slow down demand and lead to stable or lower prices.

Employment Levels: High employment rates usually correlate with increased demand for housing, especially in regions with thriving industries. Employment stability and job prospects directly affect people’s ability to buy homes, which in turn affects median prices.

4. Property Type

The type of property also plays a crucial role in determining median prices. Different housing types, such as single-family homes, condominiums, apartments, and townhouses, do not have the same median price ranges. 

Factors like square footage, number of bedrooms, and amenities can further differentiate within these categories. For instance, single-family homes typically command higher median prices than condos due to the larger living space and private outdoor areas they offer. Understanding these distinctions is vital when assessing the median price in a specific property category.

Searching The Profitable Property with Data Analytics

In the complex world of real estate, the median property price is your valuable compass. It guides your decisions when buying, selling, or investing. It reveals the market’s pulse. So, armed with the knowledge of the median property price and an understanding of the factors that shape it, you’re well-equipped to traverse the complex landscape of real estate. 

Your decisions will align with your goals, and your path will be guided by insights and wisdom accessible only via data analytics. For short-term rentals, Airbtics empowers users with accurate data, helping them make informed decisions in the Airbnb market.

Don’t miss out on the opportunities that data-driven decisions can bring. Take your real estate journey to the next level with Airbtics. Your path to success starts here.

Got the budget to buy a property and wanna know the profit? Then use the most powerful Airbnb Profit Calculator

Unlock Worldwide
Short-Term Rental Data
Find unsaturated neighborhoods with the highest occupancy history.

Unlock Worldwide
Short-Term Rental Data
Find unsaturated neighborhoods with the highest occupancy history.

Top Property Management Companies Boca raton united states

Top Property Managers in Boca raton, United states Top Property Managers in Boca raton, United states Last updated on: 5th July, 2024 This list aims …

Read More →
Annual Airbnb Revenue in Newark new jersey, USA

Newark, New Jersey| Airbnb Market Data & Overview | USA Newark, New Jersey Airbnb Market Data & Overview USA Is it profitable to do Airbnb …

Read More →
Top Property Management Companies Sydney nsw, Australia

Top 10 Property Management Companies in Sydney NSW Top 10 Property Management Companies in Sydney NSW Last updated on: 14th June, 2024 This list aims …

Read More →
Annual Airbnb Revenue in Richmond virginia, USA

Richmond, Virginia| Airbnb Market Data & Overview | USA Richmond, Virginia Airbnb Market Data & Overview USA Is it profitable to do Airbnb in Richmond, …

Read More →
Annual Airbnb Revenue in Port chester new york, USA

Port Chester, New York| Airbnb Market Data & Overview | USA Port Chester, New York Airbnb Market Data & Overview USA Is it profitable to …

Read More →
Annual Airbnb Revenue in Hurricane utah, USA

Hurricane, Utah| Airbnb Market Data & Overview | USA Hurricane, Utah Airbnb Market Data & Overview USA Is it profitable to do Airbnb in Hurricane, …

Read More →

investing in turkey real estate
Categories
Guides

Airbnb Research Tool: A Must-Have Tool for Every Airbnb Investor

Learn how to harness the ultimate Airbnb research tool to make data-informed Airbnb investment decisions!

Home > Resources > Guides 

airbnb research tool

Learn how to harness the ultimate Airbnb research tool to make data-informed Airbnb investment decisions!

Airbnb Market Research

Doing an Airbnb is not just about listing your rental unit and hoping for the best. In a digital platform like Airbnb where every click and booking counts, the need for the best Airbnb research tools has never been greater. The use of such tools empowers investors in several crucial ways. 

Airbnb operates in countless cities globally, each with its own characteristics and demand. Without the insights provided by short-term rental analytics, it can be challenging for both veteran and first-time investors to locate the markets that offer the best opportunities. A methodical approach that relies on the best Airbnb market research tool is the key to unlocking the full potential of your Airbnb investments. It all begins with understanding the Airbnb market’s key metrics such as:

  • Average Annual Revenue
  • Average Occupancy Rate
  • Average Nightly Rate
  • Total Number of Listings

Why You Need Airbnb Research Tool: 5 Top Reasons 

Setting sail on a journey without a map sounds risky. That’s exactly what investing in a rental looks like without proper market research for Airbnb. And remember, your hard-earned money is at stake in this venture. The following are the other reasons why you should do your homework on Airbnb investing.

1. Locate Profitable Markets

This is exactly the point of doing your homework. Market research for Airbnb serves as a map to locating the most lucrative Airbnb markets. By analyzing occupancy rates, profitability, and local regulations, you can identify the cities where your investment will yield the highest returns.

2. Know Your Competition

In the Airbnb landscape, knowledge is power. Part of your market research is knowing your competitors. What do they offer, and what will make you stand out? With this information, you can fine-tune your future rental way before buying a property. This proactive approach helps you cater to your target audience and rise above the competition in the early stages of doing a property search.

3. Be on Top of Trends

The short-term rental industry is ever-evolving. What’s in demand today may not be around tomorrow. An Airbnb market research can help you stay ahead of the curve by allowing you to align with changing trends, guest preferences, and booking patterns. Being adaptable can help your property remain relevant and profitable.

4. Calculate ROI with Precision

Airbnb investments aren’t just about property search and acquisition. They also involve return on investment. Market research allows you to crunch the numbers with precision. This should factor in expected costs and revenue. 

5. Boost Confidence and Peace of Mind

Confidence and peace of mind matter in any form of business venture, especially in the fast-paced world of Airbnb. There’s serenity that comes from knowing that you have practiced due diligence. You’re not just hoping for the best, you’re driving your venture with purpose. This sense of preparedness can be a powerful antidote to the anxieties that often come with financial and investment decisions. It allows you to sleep better at night, knowing you’ve taken every possible step to ensure your Airbnb’s success.  

Finding a Profitable Rental Using an Airbnb Research Tool

If you’re in pursuit of a profitable short-term rental property, a reliable Airbnb research tool should be your companion. In this section, we’ll unveil its incredible potential to help you with your market search for Airbnb.  We’ll explore the functionalities, strategies, and expert tips that can empower you to make data-informed decisions. This will ensure that your investment property not only reaps rewards but also aligns with your long-term aspirations.

To give you an idea of what the best Airbnb research tool should do, we’ll use the Airbtics Dashboard and show how it can lead investors to the best Airbnb location where they can maximize their investments. In fact, anyone can instantly get insights by simply typing in the city name on the search bar. If you like something simpler, try out our ChatGPT type tool for Airbnb investors.

airbnb research tool
1. Compare Markets

Every Airbnb investor already has a target market in mind. The wiser ones know that it is better to cast their nets wide. So, let’s consider these 2 Airbnb markets. These are Miami and Nashville, 2 of the most visited cities in the US.

airbnb research tool

An Airbnb host in Miami can earn $41,031 in annual revenue compared to $49,744 in Nashville. This part is a no-brainer. In terms of profit, you can expect to gain more in Nashville. But let’s keep our Airbnb market search methodical by computing their gross rental yields.

According to Redfin, the median property prices in Miami and Nashville are $639,000 and $525,000, respectively. We already know that Nashville is a better choice, with its lower median property price and higher annual revenue! 

logo
City Name Annual Revenue Average Property Price Gross Rental Yield
Miami, FL $41,031 $639,000 6.42%
Nashville, TN $49,744 $525,000 9.48%

Property Type

Dataset

  • Annual Revenue: $41,031
  • Average Property Price: $639,000
  • Gross Rental Yield: 6.42%
  • Annual Revenue: $49,744
  • Average Property Price: $525,000
  • Gross Rental Yield: 9.48%

While Nashville is already a strong contender in the case, a good Airbnb research tool such as Airbtics should also provide additional insights that investors should consider. Among these are occupancy rates and nightly rates. While Miami has a higher Airbnb occupancy rate, the nightly rate in Nashville is $41 more compared to Miami.

To put the icing on the cake, Nashville has a lower number of active Airbnb listings of 9,241. This means that its Airbnb market is less competitive than Miami with 11,130 Airbnb listings. 

2. Find the Most Profitable Neighborhood in an Already Profitable Airbnb Market

It goes without saying that Airbnb research tools should provide city-specific short-term rental data. Yet, the challenge remains in identifying the exact location where the highest profit lies!

Airbtics Dashboard grants investors the capability to zoom seamlessly from a city-wide perspective to a super specific neighborhood focus. Compare specific locations as you drag the map. All of this advanced feature comes with the assurance of real-time data updates.

This feature, which you can’t find elsewhere, allows investors to delve really deep into the ins and outs of any Airbnb city worldwide. And just by zooming in, you have identified the most profitable Airbnb neighborhood in Nashville. The Downtown Area has an average annual revenue of more than $95,000. This makes your search for only the most profitable Airbnb listings a lot easier. 

If you want to “bookmark” any location in the Airbtics Dashboard, you can simply create a custom market. Tailor your own region with or without regard for specific geographical boundaries!

3. Be Specific with The Property Type

After or before saving your custom market on the Airbtics Dashboard, you can study further the specifics of your chosen neighborhood. For instance, you can check the profitability of different property types in a market just by using Airbtics Advanced Filters. Instantly see the profitability according to property type by ticking the item of your choice!

Let’s analyze the results of this filter using Downtown Nashville market. Airbnb houses in the area generate $95,016 in annual revenue, while Airbnb condos earn $8,000 more. Both types have a 70% average Airbnb occupancy rate. Lastly, Airbnb condos charge $50 more for the nightly rate. 

airbnb research tool

Let’s now compute the gross rental yield to check which is more profitable in Downtown Nashville. Using the median prices from Redfin for each property type and the annual revenue from Airbtics Dashboard, their gross rental yields are:

logo
Property Type Annual Revenue Average Property Price Gross Rental Yield
House $95,016 $567,000 16.76%
Condo $103,286 $795,000 12.99%

Property Type

Dataset

House

  • Annual Revenue: $95,016
  • Average Property Price: $567,000
  • Gross Rental Yield: 16.76%

Condo

  • Annual Revenue: $103,286
  • Average Property Price: $795,000
  • Gross Rental Yield: 12.99%

Given that we have found out using Airbtics Dashboard that Downtown Nashville is the most profitable location in the city, both property types have excellent gross rental yield. Both of them surpass the 10% mark.

While condos in Downtown Nashville have higher annual revenue, they also have a higher average property price. In my opinion, the $228,000 difference in property price is just too steep for the $8,270 difference in annual revenue. This is why houses have higher gross rental yields. 

The Ultimate Airbnb Research Tool

The use of a powerful Airbnb research tool should not be considered a luxury but a necessity for any Airbnb investors wanting success in the competitive world of short-term rentals. 

Airbtics offers incredible potential to help you narrow down your search to the most lucrative investment options. The Airbtics Dashboard showcases a depth of information. You now have the ability to search deeper into the most profitable neighborhoods in already profitable cities. Just dragging or zooming into the map allows investors to make highly informed choices as the data updates in real time. Aside from this, it also has advanced filters to lead you to the most profitable property type and also the best number of bedrooms for Airbnb!

So, boost your confidence and peace of mind as you make the best investment decisions using Airbtics!

Ready to uncover short-term rental success? Check any property’s profit potential with the best Airbnb Calculator

Unlock Worldwide
Short-Term Rental Data
Find unsaturated neighborhoods with the highest occupancy history.

Unlock Worldwide
Short-Term Rental Data
Find unsaturated neighborhoods with the highest occupancy history.

cloud migration services
The Role of Cloud Technology in Enabling Airbnb’s Scalability and Global Expansion

cloud migration services Cloud technology has enabled Airbnb’s meteoric rise to become a leading platform for connecting individuals around the globe with unique short-term rental …

Read More →
Black Friday Deals for Airbnb hosts
Top 10 Black Friday Deals for Airbnb hosts

Black Friday deals already started last November 20th and this tradition brings undeniable hype to everyone, particularly Airbnb hosts! From furniture to appliances, decorative pieces, …

Read More →
Annual Airbnb Revenue in Evergreen colorado, USA

Evergreen, Colorado| Airbnb Market Data & Overview | USA Evergreen, Colorado Airbnb Market Data & Overview USA Is it profitable to do Airbnb in Evergreen, …

Read More →
Annual Airbnb Revenue in Salem virginia, USA

Salem, Virginia| Airbnb Market Data & Overview | USA Salem, Virginia Airbnb Market Data & Overview USA Is it profitable to do Airbnb in Salem, …

Read More →
Annual Airbnb Revenue in Middlebury indiana, USA

Middlebury, Indiana| Airbnb Market Data & Overview | USA Middlebury, Indiana Airbnb Market Data & Overview USA Is it profitable to do Airbnb in Middlebury, …

Read More →
airbnb rules in san francisco
Airbnb Rules in San Francisco

Table of Contents Add a header to begin generating the table of contents Is Airbnb legal in San Francisco? The answer is yes! San Francisco …

Read More →

Categories
Guides

Experience the New Airbtics Freemium

Be the very first to experience the NEW Airbtics Freemium. Better Look. Better Data. Better App. Try it today!

Home > Resources > Guides 

airbtics freemium

Be the very first to experience the NEW Airbtics Freemium. Better Look. Better Data. Better App. Try it today!

Tired of the guessing game if an Airbnb market is profitable? We heard you.

Finding the best market to invest in an Airbnb is a pain in the ass, especially if you don’t know where to start. You want to make sure you are investing your hard-earned money in the right market. Therefore, our team at Airbtics aims to help you lessen the frustration of investing in an Airbnb—whether you are a first-time investor or a pro-investor maximizing your portfolio.

With the Airbtics Freemium, you can access Airbnb’s data performance with more accuracy and ease of use. For free.

Table of Contents:

  • Better App
  • Better Data
  • Better Look
  • Better Investments

Get FREE Airbnb Data in Airbtics!

At Airbtics, transparency is our core value.

We want every customer to get the most accurate data without breaking the bank. You might encounter other Airbnb data tools that say they are giving data for free, but in the end, they will only make you pay a lot more.

We don’t want that to happen when you use Airbtics.

So here are the free data that you will get when you sign up in our dashboard:

  • Previous month’s data of annual revenue, occupancy rate, and nightly rate
  • The last twelve months (LTM) graph
  • YoY and MoM changes
  • Property size and property type supply
  • Top hosts and VRMs
  • Total number of listings
  • Amenities, cancellation policy, and extra pricing
  • Tailored region
  • And our free Airbnb Calculator

Stop assuming, Start investing. The right way.

Login to Airbtics App and experience:

  • 97% data accuracy of the trio: revenue, occupancy rate, and average daily rate to help you find out if a market is a good investment even at first glance.
  • Up-to-date LTM data from September 2022 to August 2023. Be the first one to access the last month’s data (Aug 2023) so you can stay ahead of your competitors and prep up your win!
  • 3-year historical trends to get deeper insights into your market. Right investing comes with data granularity, so feel free to access the daily, weekly, and monthly trends.
  • Planning to invest in shared rooms? Check the potential revenue of shared rooms, studios, and other property sizes at a glance! 
  • Make a competitor analysis by checking the Top Property Managers and how they currently perform.
  • Personalize the data according to your preferences by using the advanced filter
 

Better Projection. Better Investment. Introducing the Most Accurate Airbnb Calculator. 

Do you have a specific property address and you want to calculate its revenue projection? Cross out manual calculations in your to-do list and save time with the most accurate and free Airbnb calculator for investors and hosts—the Airbtics Profit Calculator.

The Airbtics profit calculator goes beyond the basics of most Airbnb calculators out there. With its incomparable features, you capture more insights to make smarter investment decisions: For free.

  • Comps transparency
  • Rental arbitrage section
  • Mortgage calculation
  • Compare and contrast multiple prospective properties

Better Data. Bigger Numbers. High Accuracy.

At Airbtics, we take data accuracy seriously.

Therefore, we pulled in the numbers we have with full transparency, plus facts on how we update our data in our app.

airbtics freemium
Bigger Numbers.
  • Currently, we have 15 million short-term rental listings from Airbnb alone. Although we only track Airbnb’s performance, we still show the data from other biggest STR platforms such as Booking.com with 1.8 million listings, VRBO with 2 million, and TripAdvisor with 440,000 listings. 
  • Aside from that, there are 7.3 million active listings that are updated every week. 5.9 million are Airbnb hosts and 240,000 of them are vacation rental managers (VRMs). 
  • In the Airbtics dashboard, you can search up to 54,000 visible markets globally,  43,000 of which are verified. For instance, if you are located in the US and you want to invest in Europe or Asia, then you can search any city or neighborhood in these regions.
High Accuracy. 
  • The Airbnb performance data you are accessing in our app is updated every week. It is scheduled every Wednesday to ensure that the data you’re getting is always fresh and accurate. 
  • For enterprises, our data is refreshed on a daily basis upon request. In short, our partners are gaining the most accurate and the most granular data that they need to grow their businesses. 
  • Airbtics data is 97% correlated with Airbnb’s financials from our findings last 2020. With this 97% data accuracy, we are confident that our data can be trusted by every Airbnb investor, host, researcher, and vacation rental manager.

👉🏽 Learn more about Airbtics data accuracy

Want to grow your vacation rental business? Tell us your business goals and we’ll give you the solution! The biggest names in the STR industry are trusting Airbtics!

airbtics freemium

Better Look. Better Search in Every Visit.

Do you know that it only takes you 5 seconds to access the data of your chosen market? With the new look of the Airbtics website, all you need to do is to type the first 1-3 letters of your chosen city and press enter for our system to analyze your search.

Fast, free, and effortless–so you can focus more on other important tasks. Try it now!

airbtics freemium

Join the 30,000 Investors, Hosts, and Property Managers who are staying ahead with Airbnb Data.

Unlock Worldwide
Short-Term Rental Data
Find unsaturated neighborhoods with the highest occupancy history.

Unlock Worldwide
Short-Term Rental Data
Find unsaturated neighborhoods with the highest occupancy history.

Best Airbnb Markets in Louisiana

Best Airbnb Markets in Louisiana Best Places to Buy an Airbnb in Louisiana Last updated on: 12th May, 2024 USA / Louisiana 82% of American …

Read More →
Annual Airbnb Revenue in Washington utah, USA

Washington, Utah| Airbnb Market Data & Overview | USA Washington, Utah Airbnb Market Data & Overview USA Is it profitable to do Airbnb in Washington, …

Read More →
Annual Airbnb Revenue in Kalamazoo michigan, USA

Kalamazoo, Michigan| Airbnb Market Data & Overview | USA Kalamazoo, Michigan Airbnb Market Data & Overview USA Is it profitable to do Airbnb in Kalamazoo, …

Read More →
What You Need to Know About the Airbnb Regulations NYC 2022

On the Monday afternoon of December 5, 2022, the New York City officials held a public debate with multiple property owners over the proposed New …

Read More →
Best places to Airbnb in Boston
The 10 Most Profitable Places for Airbnb Investment in Boston, MA

Best places to Airbnb in Boston Key Takeaways Boston’s overall financial stability, student market, & tourism has helped various hosts in the city to earn …

Read More →
How to Short Term Rental Analysis to Find Profitable Airbnb Markets with 425%+ 10-Year Returns [For Property Investors]

How to Short Term Rental Analysis to Find Profitable Airbnb Markets with 425%+ 10-Year Returns [For Property Investors] Residential property investment is one of the …

Read More →

Categories
Guides

How To Monitor Airbnb Demand in My Area?

How to Monitor Airbnb Demand in my Area?: Follow or leverage Airbnb demand in any area with these easy-to-use tips to up your short-term rental game!

Home > Resources > Guides 

airbnb demand in my area

Follow or leverage Airbnb demand in any area with these easy-to-use tips to up your short-term rental game!

Whether you’re a curious host or an investor expanding your horizon, you’ll ask yourself, “Is there Airbnb demand in my area?” In an age where accommodation preferences change rapidly, harnessing the power of insights is of utmost importance. Understanding Airbnb demand in your area allows you to position yourself for short-term rental success. 

With the help of easy-to-use rental data, you can learn to transform insights into actionable steps that set you up for success. This article will cover the following:

  • Defining Airbnb demand
  • Knowing Airbnb demand in your area
  • Factors affecting Airbnb demand
  • Leveraging Airbnb demand

What is Airbnb demand?

Airbnb demand refers to the level of interest measured by booking activity for Airbnb accommodations in a specific area. It represents the number of guests seeking short-term rentals and their willingness to book accommodations through the Airbnb platform.

As an investor or host, you want to keep this demand up. But how can you do it? In the next section, we’ll show you where you are in terms of demand. And later, we’ll teach you how to leverage this to your advantage. 

How Can I Check Airbnb Demand in My Area?

You can use the average occupancy rate of the market to gauge the Airbnb demand in your area. The easiest way to do this is by using rental analytics. Airbtics Insight’s Tool allows you to access valuable data points of any Airbnb market. These include the average occupancy rate, revenue potential, and nightly rate of all short-term rental listings in your area. Simply input your city, and you can instantly see the figures that will inform your Airbnb business plan. 

With 6,099 active listings, Miami is indeed a vast Airbnb market. And if you have or plan to have a short-term rental in the city, you might consider most of these listings as noise. 

Is There A Demand for Airbnb in My Area? (Neighborhood)

Once you have typed in your city, you can zoom into the map on the Insights Tool. As you drag and move the map, the data will update according to all listings visible in the area. The Dynamic Data feature will allow you to compare Airbnb demand in smaller areas like neighborhoods. This is an active approach for Airbnb investors to look for the smaller areas with the highest occupancy rates in their target city.

airbnb demand in my area

If you’re a host or even an investor who wants to ”bookmark” your neighborhood, you can do that with the Custom Market feature of the Insights Tool. Just draw the map of your smaller Airbnb market, and it will be saved in your account. This will allow you to monitor your neighborhood and understand its trends with ease.

airbnb demand in my area
Combining the Dynamic Pricing and Custom Market Features

The powerful Insights Tool allows you to combine these two features. You can make a Custom Market and use the Dynamic Data feature at the same time. It’s just the same drill: Draw a map of your own market and drag it around for more location-specific Airbnb data!

airbnb demand in my area

This duo will help you compare your Airbnb metrics against your closest competitors. And this will allow you to know how the other side of your neighborhood is doing. Plus, you will even see the Airbnb data of your block if you zoom in enough!

What Determines Airbnb Demand in My Area?

The local Airbnb demand in your area is determined by various factors. These shape the travelers’ decisions when choosing an accommodation. So, it’s wise to understand the following factors. They will help choose an Airbnb area or optimize your existing Airbnb listing.

Long-Term Determinants

1. Location – As in all forms of real estate, the proximity to business centers and tourist attractions can affect Airbnb demands. It can attract more guests as proximity offers convenience.
2. Seasonality – This just means the fluctuations of booking patterns throughout the year. Especially in vacation markets, understanding seasonal trends can help you manage your expectations. This may include the changing seasons. Summer is the peak season, while winter is the downtime. Local events such as festivals and international conferences can also affect seasonality, especially when they are held annually.
3. High economic activities – The economic condition of your area can also drive Airbnb demand. Previously we talked about vacation markets, now we are mainly referring to urban markets. Urban markets attract business travelers who come all year round to leading financial districts.
4. Local Regulations – The Airbnb rules and regulations in your area can impact demand. Short-term rental-friendly cities can induce demand for Airbnb. On the other hand, those with stricter laws can shift travelers from Airbnb to hotel accommodations. 

How Can I Leverage Airbnb Demand in My Area?

Leverage this crucial information and make it work to your advantage. Here are a few ways:

1. Finding the Best or Upgrading Your Airbnb

There are markets that have higher occupancy rates because of the amenities of their listings. Whether simply installing a hot tub or digging up a hole in your yard for a swimming pool, any of these can definitely make a dent in your occupancy rate. 

To know which Airbnb feature increases the occupancy rate in your market, the Advanced Filter of the Insights Tool. As you tick the amenity, you will find out which of these has the best impact!

airbnb demand in my area
2. Setting the Most Competitive Nightly Rate: Miami as a Use Case

The good thing about Insight’s Tool is its historical data feature. Therefore, you can see the months when Airbnb demand in your area is high. As an example, let’s take a look at Miami’s Airbnb data.

As you can see, the local demand in Miami was high in December and dropped to its lowest in March.

airbnb demand in my area
Source: Airbtics Insights Tool

After finding out about this trend, you can gain insights from the historical data of the Average Daily Rate in Miami. We can clearly see 50th percentile of ADR in March ($188) is $21 more compared to December ($167). So while March had the lowest occupancy rate, Airbnb hosts were still able to cash in more compared to their high-demand season. 

airbnb demand in my area
ADR in Miami, Dec 2022
airbnb demand in my area
ADR in Miami, March 2023

You can also access the historical data feature in your custom market. And same is the case in our sample market, Wynwood, Miami. December had a 63% occupancy rate, compared to 32% in March (both 50th percentile).

airbnb demand in my area
Occupancy rate in Wynwood, Miami, December 2022

And Wynwood hosts were still able to price more – although not considerably compared to the Miami market.

airbnb demand in my area
ADR in Wynwoods, Mar 2023 vs Dec 2022

LOOKING FOR THE BEST CITIES TO INVEST IN AIRBNB OUTSIDE THE US?

Discover other top grossing Airbnb locations outside the US!

Airbtics for Airbnb Demand in Your Area

Knowing the Airbnb demand in your area is a crucial factor for both hosts and investors wanting success in the short-term rental market. This article has just shown how to leverage Airbnb demand and how it interplays with other factors such as location, seasonality, and local activities.

The Airbtics’ Insights Tool not only empowers you to discern trends at a citywide level. It also zooms in on neighborhoods, providing granular insights that enable you to make informed decisions even at a micro-level. 

Furthermore, the integration of Airbtics’ Historical Data feature equips you with a forward-looking perspective. This empowers you to strategically price your Airbnb listings, avoiding the common pitfall of underpricing during periods of lower demand. 

The case study of Miami’s market fluctuations exemplifies how hosts were able to maintain competitive pricing even during the off-peak season, resulting in maximized revenue.

In a landscape as dynamic as the short-term rental market, staying ahead requires a multifaceted approach. The fusion of data-driven insights, market understanding, and strategic decision-making holds the key to positioning yourself for success. 

By consistently evaluating and responding to Airbnb demand in your area, you can confidently navigate the evolving hospitality landscape and seize opportunities that align with your aspirations. It’s all within reach, whether achieving high occupancy rates, increasing revenue, or enhancing guest experiences. The journey towards short-term rental success begins with understanding and leveraging Airbnb demand to your advantage.

Got a short-term rental, and don’t know its maximum potential? Then check its profitability with the most advanced Airbnb Calculator!

Unlock Worldwide
Short-Term Rental Data
Find unsaturated neighborhoods with the highest occupancy history.

Unlock Worldwide
Short-Term Rental Data
Find unsaturated neighborhoods with the highest occupancy history.

Annual Airbnb Revenue In Helsinki Finland

Helsinki| Airbnb Market Data & Overview | Finland Helsinki Airbnb Market Data & OverviewFinland Is it profitable to do Airbnb in Helsinki, Finland? What is …

Read More →
Annual Airbnb Revenue in Bodega bay california, USA

Bodega Bay, California| Airbnb Market Data & Overview | USA Bodega Bay, California Airbnb Market Data & Overview USA Is it profitable to do Airbnb …

Read More →
Annual Airbnb Revenue in Rutherford new jersey, USA

Rutherford, New Jersey| Airbnb Market Data & Overview | USA Rutherford, New Jersey Airbnb Market Data & Overview USA Is it profitable to do Airbnb …

Read More →
Annual Airbnb Revenue in Johnson city tennessee, USA

Johnson City, Tennessee| Airbnb Market Data & Overview | USA Johnson City, Tennessee Airbnb Market Data & Overview USA Is it profitable to do Airbnb …

Read More →
new york city airbnb occupancy rates
Airbnb Occupancy Rates & Top-ranking Boroughs in New York City

If you have ever heard of Frank Sinatra’s song “New York, New York” or watched films that have been set in New York City, then …

Read More →
Best Airbnb Markets in Wisconsin

Best Airbnb Markets in Wisconsin Best Places to Buy an Airbnb in Wisconsin Last updated on: 12th May, 2024 USA / Wisconsin 82% of American …

Read More →

Free Webinar

Learn Airbtics in 7 Minutes

Revenue and market analysis Tips and Best Practices!
Airbnb Data
Airbnb Data

ARE YOU IN?

Get Access to our weekly data-driven airbnb report!