fbpx
Categories
Others

Annual Airbnb Revenue In Zermatt Switzerland

Zermatt| Airbnb Market Data & Overview | Switzerland

Zermatt
Airbnb Market Data & Overview
Switzerland

Is it profitable to do Airbnb in Zermatt, Switzerland?

What is the occupancy rate of Airbnb in Zermatt, Switzerland?

What is the average daily rate of Airbnb in Zermatt, Switzerland?

Author Image

Zermatt, Switzerland Airbnb Data

Last updated on: 15th May, 2024

Switzerland / Zermatt
Investing in a short-term rental can be highly stable and profitable. It’s stable because housing has been one of the most stable asset classes. Also, when you can’t do an Airbnb anymore, you can still rent it out to a long-term tenant with a lower yield. It is highly profitable because the monthly cash flow from short-term rental investment typically is double the amount of traditional rentals.
Without further ado, let’s see if Zermatt is good for Airbnb.

Is Airbnb Profitable in Zermatt ?

Yes, there is a good short-term rental demand..
Occupancy Rate

68%

€274

Daily Rate

€66K

Revenue (2023)

890

Number of Listings
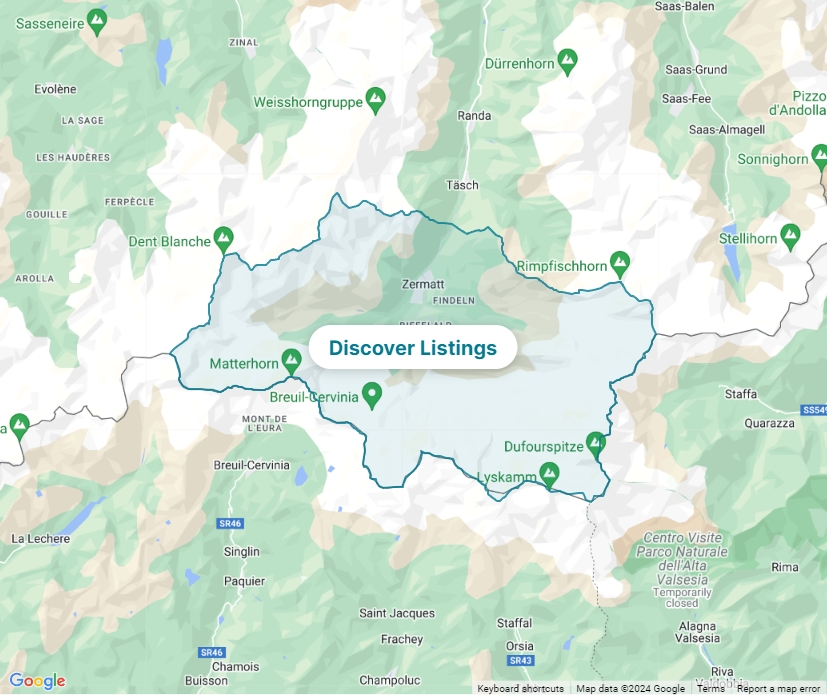
A typical short-term rental listing in Zermatt is booked for 248 nights a year, with a median occupancy rate of 68% and an average daily rate of €274. In Zermatt, A typical host income (annual revenue) was €66K in 2023. There are 890 active Airbnb listings as of 2024-04-15.
A 68% median occupancy rate is considered a good market to do an Airbnb. Take professional photos of your property, get a few good reviews on Airbnb, then you are likely to make good income.

Best Areas in Zermatt for Airbnb

Best Areas in Zermatt for Airbnb Are you wondering where to invest in Zermatt? Look no further! Here are 10 areas travelers often search for. You can find the short-term rental statistics of all of these neighborhoods from Airbtics! Check out which neighborhood has the highest rental demand. 🚀
  1. Matterhorn
  2. Gornergrat Railway
  3. Klein Matterhorn
  4. Gornergrat
  5. Rothorn Paradise
  6. Gorner Gorge
  7. Sunnegga
  8. Zermatt-Breuil-Cervinia Ski Area
  9. Matterhorn Glacier Paradise
  10. Matterhorn Museum
Okay, you might wonder about more specific data. For example, how much can an average listing with 4 bedrooms and a pool make? Or, what is the seasonality in booking? When is the peak month? Click the below button and check out more in-depth vacation rental data for free.
Signup and check out more in-depth vacation rental data for free.
Explore Zermatt‘s Airbnb Data
border-boundary-image
Categories
Others

Annual Airbnb Revenue In Zakopane Poland

Zakopane| Airbnb Market Data & Overview | Poland

Zakopane
Airbnb Market Data & Overview
Poland

Is it profitable to do Airbnb in Zakopane, Poland?

What is the occupancy rate of Airbnb in Zakopane, Poland?

What is the average daily rate of Airbnb in Zakopane, Poland?

Author Image

Zakopane, Poland Airbnb Data

Last updated on: 15th May, 2024

Poland / Zakopane
Investing in a short-term rental can be highly stable and profitable. It’s stable because housing has been one of the most stable asset classes. Also, when you can’t do an Airbnb anymore, you can still rent it out to a long-term tenant with a lower yield. It is highly profitable because the monthly cash flow from short-term rental investment typically is double the amount of traditional rentals.
Without further ado, let’s see if Zakopane is good for Airbnb.

Is Airbnb Profitable in Zakopane ?

Yes, there is a good short-term rental demand..
Occupancy Rate

56%

€119

Daily Rate

€24K

Revenue (2023)

2,519

Number of Listings
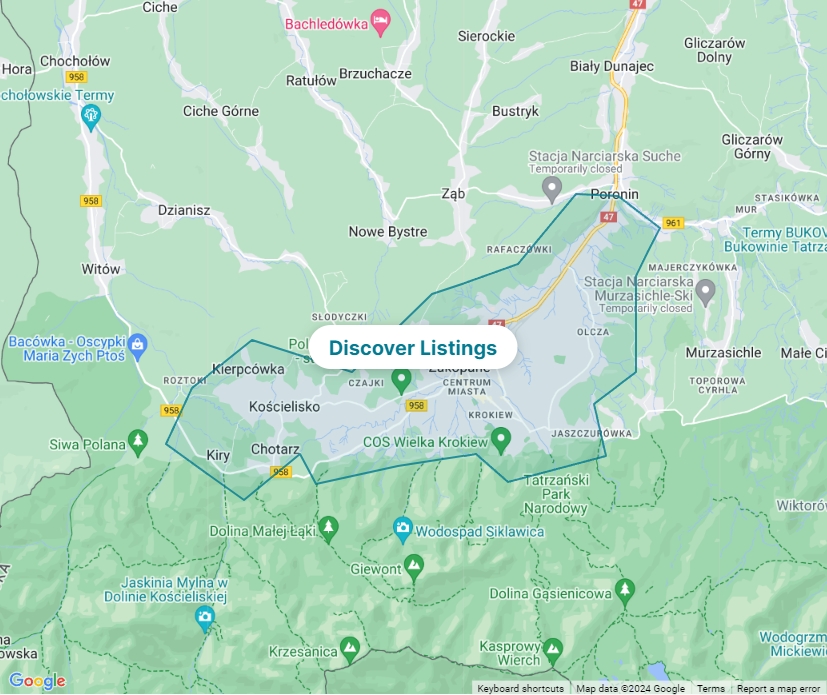
A typical short-term rental listing in Zakopane is booked for 204 nights a year, with a median occupancy rate of 56% and an average daily rate of €119. In Zakopane, A typical host income (annual revenue) was €24K in 2023. There are 2,519 active Airbnb listings as of 2024-04-15.
A 56% median occupancy rate is considered a good market to do an Airbnb. Take professional photos of your property, get a few good reviews on Airbnb, then you are likely to make good income.

Best Areas in Zakopane for Airbnb

Best Areas in Zakopane for Airbnb Are you wondering where to invest in Zakopane? Look no further! Here are 10 areas travelers often search for. You can find the short-term rental statistics of all of these neighborhoods from Airbtics! Check out which neighborhood has the highest rental demand. 🚀
  1. Krupówki Street
  2. Tatra Mountains
  3. Gubałówka Hill
  4. Wielka Krokiew Ski Jump
  5. Droga pod Reglami
  6. Morskie Oko
  7. Kasprowy Wierch
  8. Zakopane Aqua Park
  9. Giewont Mountain
  10. Tatra National Park
Okay, you might wonder about more specific data. For example, how much can an average listing with 4 bedrooms and a pool make? Or, what is the seasonality in booking? When is the peak month? Click the below button and check out more in-depth vacation rental data for free.
Signup and check out more in-depth vacation rental data for free.
Explore Zakopane‘s Airbnb Data
border-boundary-image
Categories
Others

Annual Airbnb Revenue In Zagreb Croatia

Zagreb| Airbnb Market Data & Overview | Croatia

Zagreb
Airbnb Market Data & Overview
Croatia

Is it profitable to do Airbnb in Zagreb, Croatia?

What is the occupancy rate of Airbnb in Zagreb, Croatia?

What is the average daily rate of Airbnb in Zagreb, Croatia?

Author Image

Zagreb, Croatia Airbnb Data

Last updated on: 15th May, 2024

Croatia / Zagreb
Investing in a short-term rental can be highly stable and profitable. It’s stable because housing has been one of the most stable asset classes. Also, when you can’t do an Airbnb anymore, you can still rent it out to a long-term tenant with a lower yield. It is highly profitable because the monthly cash flow from short-term rental investment typically is double the amount of traditional rentals.
Without further ado, let’s see if Zagreb is good for Airbnb.

Is Airbnb Profitable in Zagreb ?

Yes, there is a good short-term rental demand..
Occupancy Rate

64%

€63

Daily Rate

€15K

Revenue (2023)

3,514

Number of Listings
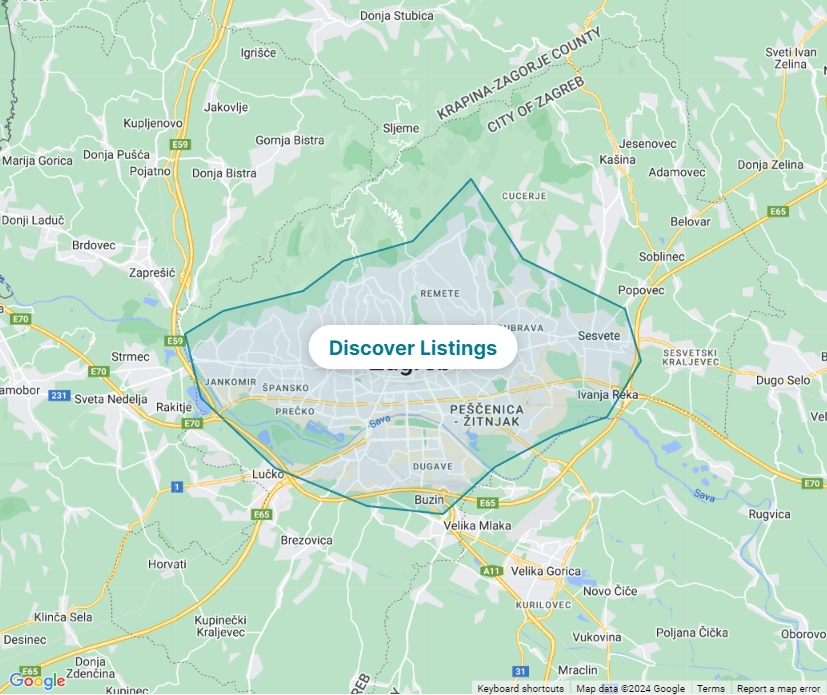
A typical short-term rental listing in Zagreb is booked for 234 nights a year, with a median occupancy rate of 64% and an average daily rate of €63. In Zagreb, A typical host income (annual revenue) was €15K in 2023. There are 3,514 active Airbnb listings as of 2024-04-15.
A 64% median occupancy rate is considered a good market to do an Airbnb. Take professional photos of your property, get a few good reviews on Airbnb, then you are likely to make good income.

Best Areas in Zagreb for Airbnb

Best Areas in Zagreb for Airbnb Are you wondering where to invest in Zagreb? Look no further! Here are 10 areas travelers often search for. You can find the short-term rental statistics of all of these neighborhoods from Airbtics! Check out which neighborhood has the highest rental demand. 🚀
  1. Zagreb Upper Town (Gornji Grad)
  2. Zagreb Lower Town (Donji Grad)
  3. St. Mark’s Church
  4. Ban Jelačić Square
  5. Zagreb Cathedral
  6. Jarun Lake
  7. Maksimir Park
  8. Zagreb City Museum
  9. Museum of Broken Relationships
  10. Zagreb Zoo
Okay, you might wonder about more specific data. For example, how much can an average listing with 4 bedrooms and a pool make? Or, what is the seasonality in booking? When is the peak month? Click the below button and check out more in-depth vacation rental data for free.
Signup and check out more in-depth vacation rental data for free.
Explore Zagreb‘s Airbnb Data
border-boundary-image
Categories
Others

Annual Airbnb Revenue In Zadar Croatia

Zadar| Airbnb Market Data & Overview | Croatia

Zadar
Airbnb Market Data & Overview
Croatia

Is it profitable to do Airbnb in Zadar, Croatia?

What is the occupancy rate of Airbnb in Zadar, Croatia?

What is the average daily rate of Airbnb in Zadar, Croatia?

Author Image

Zadar, Croatia Airbnb Data

Last updated on: 15th May, 2024

Croatia / Zadar
Investing in a short-term rental can be highly stable and profitable. It’s stable because housing has been one of the most stable asset classes. Also, when you can’t do an Airbnb anymore, you can still rent it out to a long-term tenant with a lower yield. It is highly profitable because the monthly cash flow from short-term rental investment typically is double the amount of traditional rentals.
Without further ado, let’s see if Zadar is good for Airbnb.

Is Airbnb Profitable in Zadar ?

Yes, there is a good short-term rental demand..
Occupancy Rate

72%

€92

Daily Rate

€23K

Revenue (2023)

4,310

Number of Listings
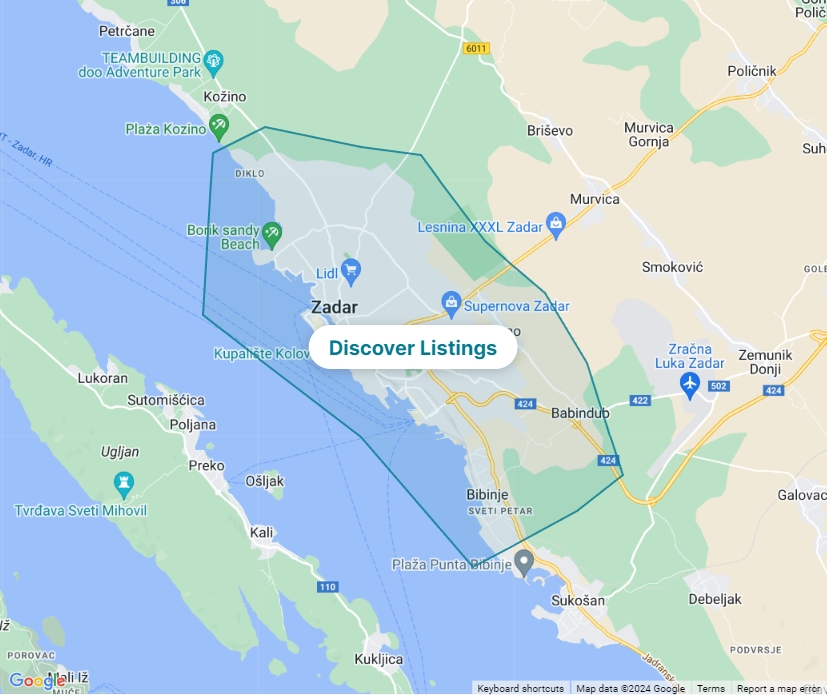
A typical short-term rental listing in Zadar is booked for 263 nights a year, with a median occupancy rate of 72% and an average daily rate of €92. In Zadar, A typical host income (annual revenue) was €23K in 2023. There are 4,310 active Airbnb listings as of 2024-04-15.
A 72% median occupancy rate is considered a good market to do an Airbnb. Take professional photos of your property, get a few good reviews on Airbnb, then you are likely to make good income.

Best Areas in Zadar for Airbnb

Best Areas in Zadar for Airbnb Are you wondering where to invest in Zadar? Look no further! Here are 10 areas travelers often search for. You can find the short-term rental statistics of all of these neighborhoods from Airbtics! Check out which neighborhood has the highest rental demand. 🚀
  1. Old Town (Stari Grad)
  2. Sea Organ
  3. Greeting to the Sun
  4. St. Donatus Church
  5. Roman Forum
  6. Zadar Cathedral
  7. Five Wells Square
  8. Land Gate (Kopnena vrata)
  9. Church of St. Simeon
  10. Kalelarga (Main Street)
Okay, you might wonder about more specific data. For example, how much can an average listing with 4 bedrooms and a pool make? Or, what is the seasonality in booking? When is the peak month? Click the below button and check out more in-depth vacation rental data for free.
Signup and check out more in-depth vacation rental data for free.
Explore Zadar‘s Airbnb Data
border-boundary-image
Categories
Others

Annual Airbnb Revenue In Yokohama Japan

Yokohama| Airbnb Market Data & Overview | Japan

Yokohama
Airbnb Market Data & Overview
Japan

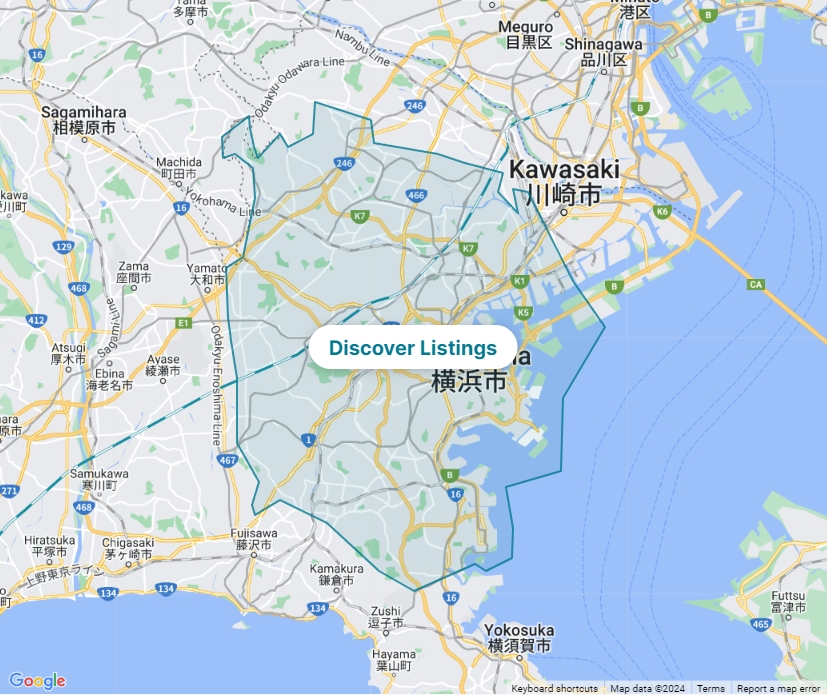
Is it profitable to do Airbnb in Yokohama, Japan?

What is the occupancy rate of Airbnb in Yokohama, Japan?

What is the average daily rate of Airbnb in Yokohama, Japan?

Author Image

Yokohama, Japan Airbnb Data

Last updated on: 15th May, 2024

Japan / Yokohama
Investing in a short-term rental can be highly stable and profitable. It’s stable because housing has been one of the most stable asset classes. Also, when you can’t do an Airbnb anymore, you can still rent it out to a long-term tenant with a lower yield. It is highly profitable because the monthly cash flow from short-term rental investment typically is double the amount of traditional rentals.
Without further ado, let’s see if Yokohama is good for Airbnb.

Is Airbnb Profitable in Yokohama ?

Yes, there is a good short-term rental demand..
Occupancy Rate

80%

JPY12,075

Daily Rate

JPY3M

Revenue (2023)

213

Number of Listings
A typical short-term rental listing in Yokohama is booked for 292 nights a year, with a median occupancy rate of 80% and an average daily rate of JPY12,075. In Yokohama, A typical host income (annual revenue) was JPY3M in 2023. There are 213 active Airbnb listings as of 2024-04-15.
A 80% median occupancy rate is considered a good market to do an Airbnb. Take professional photos of your property, get a few good reviews on Airbnb, then you are likely to make good income.

Best Areas in Yokohama for Airbnb

Best Areas in Yokohama for Airbnb Are you wondering where to invest in Yokohama? Look no further! Here are 10 areas travelers often search for. You can find the short-term rental statistics of all of these neighborhoods from Airbtics! Check out which neighborhood has the highest rental demand. 🚀
  1. Yokohama Landmark Tower
  2. Yokohama Chinatown
  3. Yokohama Red Brick Warehouse
  4. Minato Mirai 21
  5. Yokohama Cosmo World
  6. Sankeien Garden
  7. Yamashita Park
  8. Cupnoodles Museum
  9. Yokohama Museum of Art
  10. Yokohama Port Museum
Okay, you might wonder about more specific data. For example, how much can an average listing with 4 bedrooms and a pool make? Or, what is the seasonality in booking? When is the peak month? Click the below button and check out more in-depth vacation rental data for free.
Signup and check out more in-depth vacation rental data for free.
Explore Yokohama‘s Airbnb Data
border-boundary-image
Categories
Others

Annual Airbnb Revenue In Yogyakarta Indonesia

Yogyakarta| Airbnb Market Data & Overview | Indonesia

Yogyakarta
Airbnb Market Data & Overview
Indonesia

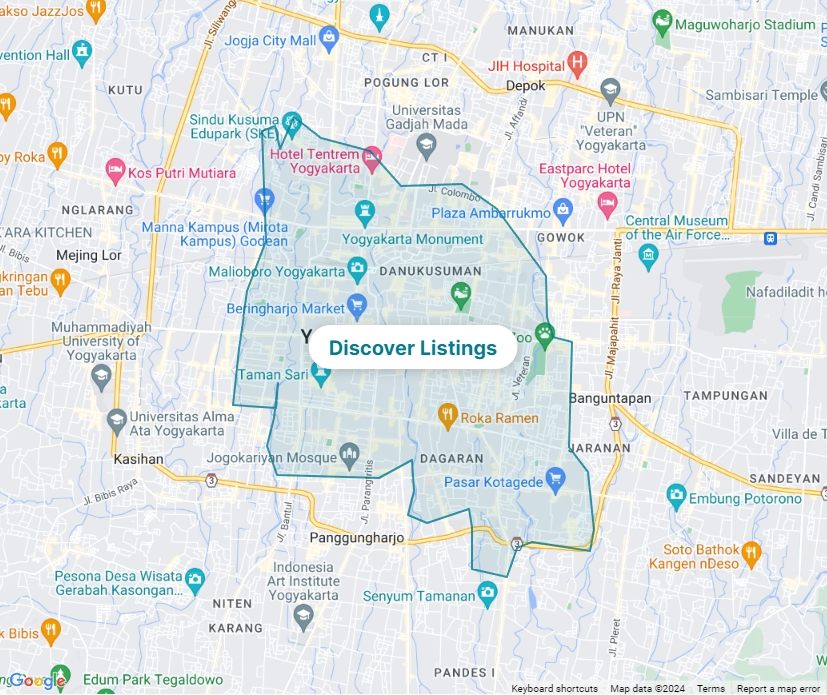
Is it profitable to do Airbnb in Yogyakarta, Indonesia?

What is the occupancy rate of Airbnb in Yogyakarta, Indonesia?

What is the average daily rate of Airbnb in Yogyakarta, Indonesia?

Author Image

Yogyakarta, Indonesia Airbnb Data

Last updated on: 15th May, 2024

Indonesia / Yogyakarta
Investing in a short-term rental can be highly stable and profitable. It’s stable because housing has been one of the most stable asset classes. Also, when you can’t do an Airbnb anymore, you can still rent it out to a long-term tenant with a lower yield. It is highly profitable because the monthly cash flow from short-term rental investment typically is double the amount of traditional rentals.
Without further ado, let’s see if Yogyakarta is good for Airbnb.

Is Airbnb Profitable in Yogyakarta ?

No, at least on a surface level. The short-term rental market is not an exciting thing in Yogyakarta..
Occupancy Rate

41%

IDR519,633

Daily Rate

IDR86M

Revenue (2023)

790

Number of Listings
A typical short-term rental listing in Yogyakarta is booked for 150 nights a year, with a median occupancy rate of 41% and an average daily rate of IDR519,633. In Yogyakarta, A typical host income (annual revenue) was IDR86M in 2023. There are 790 active Airbnb listings as of 2024-04-15.
A 41% median occupancy rate is considered a risky market to do an Airbnb. There are definitely few hosts making good income, but you may struggle to get year-round bookings. We suggest you do further research on this market.

Best Areas in Yogyakarta for Airbnb

Best Areas in Yogyakarta for Airbnb Are you wondering where to invest in Yogyakarta? Look no further! Here are 10 areas travelers often search for. You can find the short-term rental statistics of all of these neighborhoods from Airbtics! Check out which neighborhood has the highest rental demand. 🚀
  1. Borobudur Temple
  2. Prambanan Temple
  3. Kraton Yogyakarta (Yogyakarta Palace)
  4. Taman Sari Water Castle
  5. Malioboro Street
  6. Ratu Boko Temple
  7. Pawon Temple
  8. Kalibiru National Park
  9. Parangtritis Beach
  10. Plaosan Temple
Okay, you might wonder about more specific data. For example, how much can an average listing with 4 bedrooms and a pool make? Or, what is the seasonality in booking? When is the peak month? Click the below button and check out more in-depth vacation rental data for free.
Signup and check out more in-depth vacation rental data for free.
Explore Yogyakarta‘s Airbnb Data
border-boundary-image
Categories
Others

Annual Airbnb Revenue In Wroclaw Poland

Wroclaw| Airbnb Market Data & Overview | Poland

Wroclaw
Airbnb Market Data & Overview
Poland

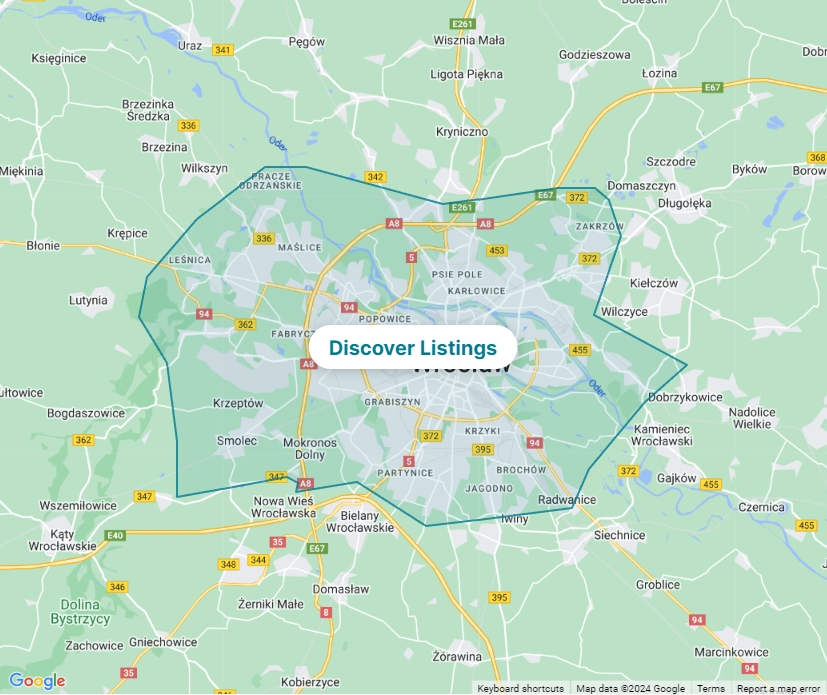
Is it profitable to do Airbnb in Wroclaw, Poland?

What is the occupancy rate of Airbnb in Wroclaw, Poland?

What is the average daily rate of Airbnb in Wroclaw, Poland?

Author Image

Wroclaw, Poland Airbnb Data

Last updated on: 15th May, 2024

Poland / Wroclaw
Investing in a short-term rental can be highly stable and profitable. It’s stable because housing has been one of the most stable asset classes. Also, when you can’t do an Airbnb anymore, you can still rent it out to a long-term tenant with a lower yield. It is highly profitable because the monthly cash flow from short-term rental investment typically is double the amount of traditional rentals.
Without further ado, let’s see if Wroclaw is good for Airbnb.

Is Airbnb Profitable in Wroclaw ?

Yes, there is a good short-term rental demand..
Occupancy Rate

59%

€63

Daily Rate

€14K

Revenue (2023)

3,422

Number of Listings
A typical short-term rental listing in Wroclaw is booked for 215 nights a year, with a median occupancy rate of 59% and an average daily rate of €63. In Wroclaw, A typical host income (annual revenue) was €14K in 2023. There are 3,422 active Airbnb listings as of 2024-04-15.
A 59% median occupancy rate is considered a good market to do an Airbnb. Take professional photos of your property, get a few good reviews on Airbnb, then you are likely to make good income.

Best Areas in Wroclaw for Airbnb

Best Areas in Wroclaw for Airbnb Are you wondering where to invest in Wroclaw? Look no further! Here are 10 areas travelers often search for. You can find the short-term rental statistics of all of these neighborhoods from Airbtics! Check out which neighborhood has the highest rental demand. 🚀
  1. Wrocław Market Square (Rynek)
  2. Wrocław Cathedral
  3. Ostrów Tumski
  4. Wrocław University
  5. Centennial Hall (Hala Stulecia)
  6. Wrocław Zoo
  7. Wrocław Fountain
  8. Racławice Panorama
  9. Wrocław Multimedia Fountain
  10. Wrocław Old Town Hall
Okay, you might wonder about more specific data. For example, how much can an average listing with 4 bedrooms and a pool make? Or, what is the seasonality in booking? When is the peak month? Click the below button and check out more in-depth vacation rental data for free.
Signup and check out more in-depth vacation rental data for free.
Explore Wroclaw‘s Airbnb Data
border-boundary-image
Categories
Others

Annual Airbnb Revenue In Wellington New Zealand

Wellington| Airbnb Market Data & Overview | New Zealand

Wellington
Airbnb Market Data & Overview
New Zealand

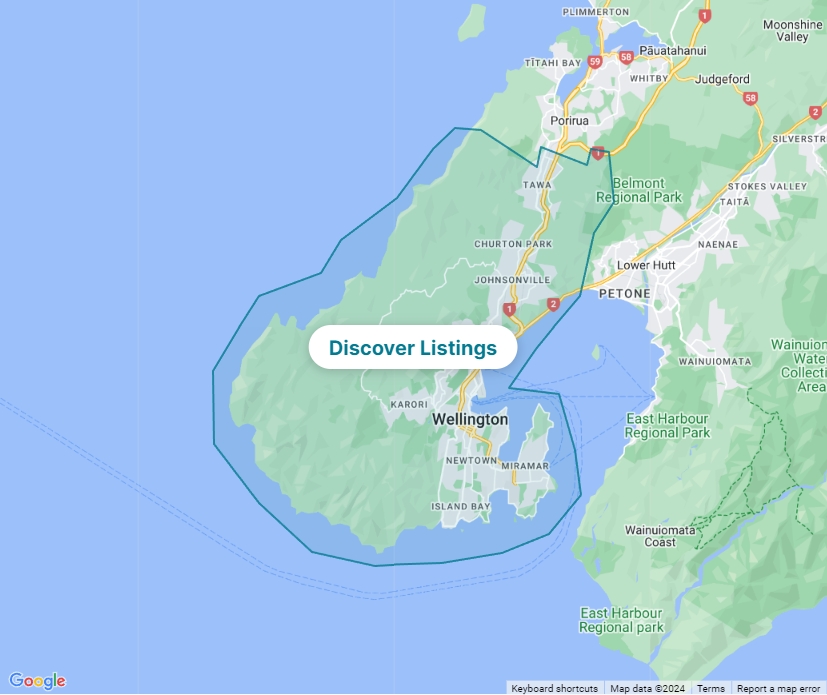
Is it profitable to do Airbnb in Wellington, New Zealand?

What is the occupancy rate of Airbnb in Wellington, New Zealand?

What is the average daily rate of Airbnb in Wellington, New Zealand?

Author Image

Wellington, New Zealand Airbnb Data

Last updated on: 15th May, 2024

New Zealand / Wellington
Investing in a short-term rental can be highly stable and profitable. It’s stable because housing has been one of the most stable asset classes. Also, when you can’t do an Airbnb anymore, you can still rent it out to a long-term tenant with a lower yield. It is highly profitable because the monthly cash flow from short-term rental investment typically is double the amount of traditional rentals.
Without further ado, let’s see if Wellington is good for Airbnb.

Is Airbnb Profitable in Wellington ?

Yes, there is a good short-term rental demand..
Occupancy Rate

80%

NZD164

Daily Rate

NZD48K

Revenue (2023)

1,964

Number of Listings
A typical short-term rental listing in Wellington is booked for 292 nights a year, with a median occupancy rate of 80% and an average daily rate of NZD164. In Wellington, A typical host income (annual revenue) was NZD48K in 2023. There are 1,964 active Airbnb listings as of 2024-04-15.
A 80% median occupancy rate is considered a good market to do an Airbnb. Take professional photos of your property, get a few good reviews on Airbnb, then you are likely to make good income.

Best Areas in Wellington for Airbnb

Best Areas in Wellington for Airbnb Are you wondering where to invest in Wellington? Look no further! Here are 10 areas travelers often search for. You can find the short-term rental statistics of all of these neighborhoods from Airbtics! Check out which neighborhood has the highest rental demand. 🚀
  1. Te Papa Tongarewa (Museum of New Zealand)
  2. Wellington Cable Car
  3. Mount Victoria Lookout
  4. Weta Workshop
  5. Wellington Botanic Garden
  6. Zealandia Ecosanctuary
  7. Wellington Waterfront
  8. Matiu/Somes Island
  9. Cuba Street
  10. Old St Paul’s
Okay, you might wonder about more specific data. For example, how much can an average listing with 4 bedrooms and a pool make? Or, what is the seasonality in booking? When is the peak month? Click the below button and check out more in-depth vacation rental data for free.
Signup and check out more in-depth vacation rental data for free.
Explore Wellington‘s Airbnb Data
border-boundary-image
Categories
Others

Annual Airbnb Revenue In Warsaw Poland

Warsaw| Airbnb Market Data & Overview | Poland

Warsaw
Airbnb Market Data & Overview
Poland

Is it profitable to do Airbnb in Warsaw, Poland?

What is the occupancy rate of Airbnb in Warsaw, Poland?

What is the average daily rate of Airbnb in Warsaw, Poland?

Author Image

Warsaw, Poland Airbnb Data

Last updated on: 15th May, 2024

Poland / Warsaw
Investing in a short-term rental can be highly stable and profitable. It’s stable because housing has been one of the most stable asset classes. Also, when you can’t do an Airbnb anymore, you can still rent it out to a long-term tenant with a lower yield. It is highly profitable because the monthly cash flow from short-term rental investment typically is double the amount of traditional rentals.
Without further ado, let’s see if Warsaw is good for Airbnb.

Is Airbnb Profitable in Warsaw ?

Yes, there is a good short-term rental demand..
Occupancy Rate

65%

€58

Daily Rate

€14K

Revenue (2023)

10,394

Number of Listings
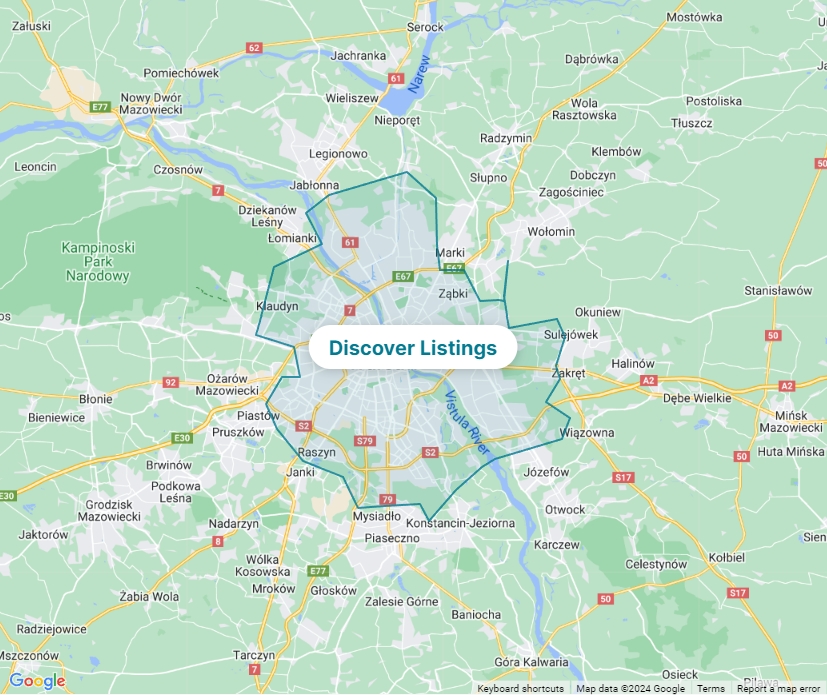
A typical short-term rental listing in Warsaw is booked for 237 nights a year, with a median occupancy rate of 65% and an average daily rate of €58. In Warsaw, A typical host income (annual revenue) was €14K in 2023. There are 10,394 active Airbnb listings as of 2024-04-15.
A 65% median occupancy rate is considered a good market to do an Airbnb. Take professional photos of your property, get a few good reviews on Airbnb, then you are likely to make good income.

Best Areas in Warsaw for Airbnb

Best Areas in Warsaw for Airbnb Are you wondering where to invest in Warsaw? Look no further! Here are 10 areas travelers often search for. You can find the short-term rental statistics of all of these neighborhoods from Airbtics! Check out which neighborhood has the highest rental demand. 🚀
  1. Old Town (Stare Miasto)
  2. Royal Castle
  3. Łazienki Park (Royal Baths Park)
  4. Warsaw Uprising Museum
  5. Palace of Culture and Science
  6. Wilanów Palace
  7. Warsaw Barbican
  8. POLIN Museum of the History of Polish Jews
  9. Nowy Świat Street
  10. Copernicus Science Centre
Okay, you might wonder about more specific data. For example, how much can an average listing with 4 bedrooms and a pool make? Or, what is the seasonality in booking? When is the peak month? Click the below button and check out more in-depth vacation rental data for free.
Signup and check out more in-depth vacation rental data for free.
Explore Warsaw‘s Airbnb Data
border-boundary-image
Categories
Others

Annual Airbnb Revenue In Viña Del Mar Chile

Viña del Mar| Airbnb Market Data & Overview | Chile

Viña del Mar
Airbnb Market Data & Overview
Chile

Is it profitable to do Airbnb in Viña del Mar, Chile?

What is the occupancy rate of Airbnb in Viña del Mar, Chile?

What is the average daily rate of Airbnb in Viña del Mar, Chile?

Author Image

Viña del Mar, Chile Airbnb Data

Last updated on: 15th May, 2024

Chile / Viña del Mar
Investing in a short-term rental can be highly stable and profitable. It’s stable because housing has been one of the most stable asset classes. Also, when you can’t do an Airbnb anymore, you can still rent it out to a long-term tenant with a lower yield. It is highly profitable because the monthly cash flow from short-term rental investment typically is double the amount of traditional rentals.
Without further ado, let’s see if Viña del Mar is good for Airbnb.

Is Airbnb Profitable in Viña del Mar ?

No, at least on a surface level. The short-term rental market is not an exciting thing in Viña del Mar..
Occupancy Rate

48%

CLP65,327

Daily Rate

CLP12M

Revenue (2023)

4,619

Number of Listings
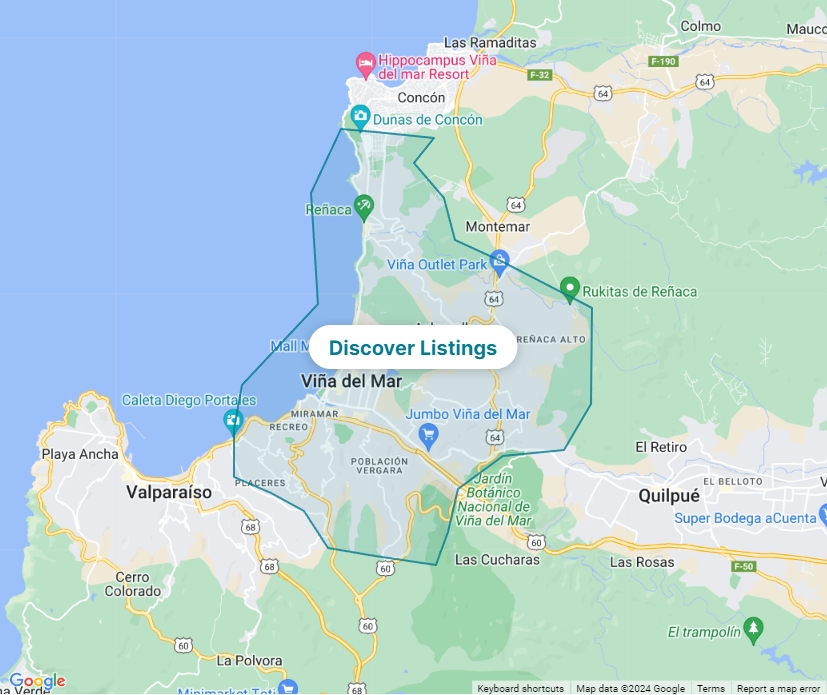
A typical short-term rental listing in Viña del Mar is booked for 175 nights a year, with a median occupancy rate of 48% and an average daily rate of CLP65,327. In Viña del Mar, A typical host income (annual revenue) was CLP12M in 2023. There are 4,619 active Airbnb listings as of 2024-04-15.
A 48% median occupancy rate is considered a risky market to do an Airbnb. There are definitely few hosts making good income, but you may struggle to get year-round bookings. We suggest you do further research on this market.

Best Areas in Viña del Mar for Airbnb

Best Areas in Viña del Mar for Airbnb Are you wondering where to invest in Viña del Mar? Look no further! Here are 10 areas travelers often search for. You can find the short-term rental statistics of all of these neighborhoods from Airbtics! Check out which neighborhood has the highest rental demand. 🚀
  1. Quinta Vergara Park
  2. Viña del Mar Flower Clock
  3. Playa Acapulco
  4. Caleta Abarca Beach
  5. Wulff Castle
  6. Renaca Beach
  7. Valparaiso Sporting Club
  8. El Reloj de Flores
  9. Muelle Vergara
  10. Museum of Archaeology and History Francisco Fonck
Okay, you might wonder about more specific data. For example, how much can an average listing with 4 bedrooms and a pool make? Or, what is the seasonality in booking? When is the peak month? Click the below button and check out more in-depth vacation rental data for free.
Signup and check out more in-depth vacation rental data for free.
Explore Viña del Mar‘s Airbnb Data
border-boundary-image
Airbnb Data
Airbnb Data

Join The Club!

Get a free weekly
Data-DRIVEN REPORT

will only send you value bombs

ARE YOU IN?

Get Access to our weekly data-driven airbnb report!