fbpx
🎉 FREE WEBINAR - July 24th, 11am / 8pm CET - Learn Airbtics in 7 Minutes - Revenue and Market Analysis Tips and Best Practices!
Categories
Airbnb Investment All About Airbnb

Investing in Property for Sale: How to Buy A Profitable Property for Airbnb in Bondi Beach

airbnb property for sale bondi beach

Owning a beachfront property is a dream for the majority of people. If you are eager to make this come true by earning a passive income at the same time, then purchasing a property with a beautiful view of the sea is ideal in Bondi Beach, Australia!

Airbnb rental arbitrage in Australia is preferred by investors who have a limited budget to purchase a property, which means you can do Airbnb by just renting it! However, the main question is: will Airbnb properties be profitable in that area?

Let’s not get carried away by a property’s design or its proximity to major tourist areas because the primary step is to determine profitability. In this article, we’ll discuss the metrics in order to gauge the best property investment, specifically when buying a property investment in Bondi Beach, Australia. This includes the best website recommendations for property investment, the prices and properties for sale in Bondi Beach, along with each property type’s gross rental yield, cash-on-cash return, and annual revenue. 

Bondi Beach is Australia’s most famous beach and has plenty of visitors from across the globe. Known as the jewel of Sydney’s laid-back beach lifestyle, this beautiful city is home to one of the oldest surf lifesaving clubs in the world and one of Australia’s oldest swimming clubs. Airbnb occupancy rates in Australia reveal that the months of September to December are typically the peak seasons with an average occupancy rate of 59%.

In Bondi Beach, the rental yields for houses are currently 1.82 % with an average median rent of $ 1,250 weekly. Aside from this, houses in Bondi Beach have seen 2.68% growth in the past quarter.

Is Property Investment Profitable in Bondi Beach?

Australia is known to be one of the fastest-growing property markets across the globe. This means that the country has a wide variety of profitable property investments offering higher yields. Using a short-term rental calculator, it was discovered that a 2-bedroom apartment in Bondi Beach can generate an annual revenue of A$66,197 with a steady occupancy rate of 66% and a nightly rate of A$238.

airbnb property for sale bondi beach

airbnb property for sale bondi beach

Profitable Properties for Sale in Bondi Beach

Buying a beach house property will not only let you have access to a delightful vacation spot, but it can also bring an excellent return on investment and become a reliable income stream! It may be difficult to find the best properties that have the potential to produce high yields and capital growth, and this article will certainly help you through! 

Here are some of the profitable properties in Bondi Beach along with the calculated gross rental yield, cash-on-cash return, and annual revenue:

airbnb property for sale bondi beach

119/3 Violet Town Road, Mount Hutton, NSW 2290

1. Studio-type Property for Sale Bondi
East-facing city view furnished studio apartment with balcony

Asking Price: A$210,000

GROSS RENTAL YIELD 24.36%
ANNUAL REVENUE A$51,149
CASH ON CASH RETURN 47.30%
airbnb property for sale bondi beach

119/3 Violet Town Road, Mount Hutton, NSW 2290

2. 1-Bedroom Property for Sale Bondi
Located within the Tingira Hills Care Community

Asking Price: A$120,000

GROSS RENTAL YIELD 40.57%
ANNUAL REVENUE A$48,684
CASH ON CASH RETURN 95.94%
2-Bedroom Bondi
2-Bedroom Bondi

833/138 Windang Road, Windang, NSW 2528

3. 2-Bedroom Property for Sale Bondi
Located at South Pacific Park Village

Asking Price: A$255,000

GROSS RENTAL YIELD 24.74%
ANNUAL REVENUE A$63,082
CASH ON CASH RETURN 48.45%
airbnb property for sale bondi beach
3-Bedroom Property for Sale Bondi

7 Short Street, Rylstone, NSW 2849

4. 3-Bedroom Property for Sale Bondi
Near Wollemi Standing Stones

Asking Price: A$300,000

GROSS RENTAL YIELD 31.80%
ANNUAL REVENUE A$95,407
CASH ON CASH RETURN 69.64%
4-Bedroom bondi
3-Bedroom Bondi

 13 Ron Scott Circuit, Greenacre, NSW 2190

5. 4-Bedroom Property for Sale Bondi
Close to local favourites: Valentina Mexico, Al Aseel Restaurant and Cafe Levant

Asking Price: A$780,000

GROSS RENTAL YIELD 26.33%
ANNUAL REVENUE A$205,351
CASH ON CASH RETURN 53.21%

Conclusion

Since Airbnb is rapidly increasing and constantly changing for each city in the world, it is crucial to make decisions based on wild guesses. The data points mentioned in this article for Bondi Beach such as Airbnb occupancy rates, annual revenue, and average daily rate should be the primary basis before investing in a property. 

Hence, if the data presented above has given you ideas to boost your strategic pricing plan for your business, then an Airbnb rental arbitrage calculator is certainly what you need for success in the long run. It’s a fact that some of the STR investors are also considering Airbnb Rental Arbitrage, but they still need to have a reliable data tool on to base their conclusions! 

As we live in a digital era, an accurate data analytics tool can help your business stand out among your surrounding competitors and benchmark your property by tracking the occupancy rates of competing listings in your preferred city.

Airbtics
Categories
Airbnb Investment All About Airbnb

Investing in Property for Sale: How to Buy A Profitable Property for Airbnb in Adelaide City Centre

airbnb property for sale adelaide city centre

Are you looking to invest in a property where you can maximize profitability in a particular region? If yes, then it’s certainly a must to consider the major things to look out for when buying a property for Airbnb. While Airbnb rental arbitrage in Adelaide is fairly popular and does not require you to purchase a property, it’s still the best to learn about buying a property for Airbnb and making sure that it’s profitable.

Aside from a property’s fascinating architectural design, proximity to major tourist areas, and accessibility to the best go-to places, the primary step is to determine profitability. Airbnb occupancy rates in Australia vary according to their respective cities and it’s important to learn more about these metrics before you begin.

In this article, we’ll discuss the Airbnb metrics in order to gauge the best property investment, specifically when buying a property investment in Adelaide, Australia. This includes the best website recommendations for property investment, defining property gross rental yield, cash-on-cash return, and monthly revenue, along with some of the most ideal and profitable properties according to their location.

Adelaide is known for plenty of wondrous festivals and sporting events, its coastline and hills, and of course – food and wine! This city boasts affordable real estate property prices that are almost half of that of major cities such as Sydney. In addition to this, Airbnb rules in Adelaide state that it’s legal to operate as long as it is registered and approved by the commission.

Since Adelaide is crowned as the 3rd most liveable city, it’s no wonder that it has become a haven for property investment.

Is Property Investment Profitable in Adelaide City Centre?

Australia is known to be one of the fastest-growing property markets across the globe. This means that the country has a wide variety of profitable property investments offering higher yields. Using an Airbnb calculator, it was discovered that a 3-bedroom apartment in Adelaide City Centre can generate an annual revenue of A$49,963 with a steady occupancy rate of 42% and a nightly rate of A$309.

airbnb property for sale adelaide city centre

airbnb property for sale adelaide city centre

Profitable Properties for Sale in Adelaide City Centre

Finding the best properties that have the potential to produce high yields and capital growth are certainly some of the preferences of major investors. It’s always best to ask for assistance from real estate agents to access exclusive and unique properties during the development stage. 

At the same time, it’s even better when a property investor like you conducts research about predicted growths and market forecasts. Here are some of the profitable properties in Adelaide City Centre along with the calculated gross rental yield, cash-on-cash return, and annual revenue:

airbnb property for sale adelaide city centre

 301/304 Waymouth Street, Adelaide SA 5000

1. Studio-type Property for Sale Adelaide
2 min walk to the City West Campus of the University of South Australia

Asking Price: A$129,000

GROSS RENTAL YIELD 16.88%
ANNUAL REVENUE A$21,772
CASH ON CASH RETURN 24.87%
airbnb property for sale adelaide city centre

160 Rundle Mall, Adelaide SA 5000

2. 1-Bedroom Property for Sale Adelaide
Near Rundle Mall Shopping Complex

Asking Price: A$125,000

GROSS RENTAL YIELD 34.49%
ANNUAL REVENUE A$43,109
CASH ON CASH RETURN 77.69%
airbnb property for sale adelaide city centre
2-Bedroom Property for Sale Adelaide

111/61 Hindmarsh Square, Adelaide, SA 5000

3. 2-Bedroom Property for Sale Adelaide
Close to Adelaide Convention Centre

Asking Price: A$295,000

GROSS RENTAL YIELD 17.90%
ANNUAL REVENUE A$52,799
CASH ON CASH RETURN 27.93%
3-Bedroom Property for Sale Adelaide

George Crawford Road, Crewe, Cheshire CW1

4. 3-Bedroom Property for Sale Adelaide
3.2 miles to Sandbach

Asking Price: A$240,000

GROSS RENTAL YIELD 25.60%
ANNUAL REVENUE A$61,438
CASH ON CASH RETURN 47.96%
4-Bedroom Property for Sale Adelaide

 1 Rodney Avenue INGLE FARM

5. 4-Bedroom Property for Sale Adelaide
Located just around the corner from Walkley Park Reserve

Asking Price: A$495,000

GROSS RENTAL YIELD 20.96%
ANNUAL REVENUE A$103,767
CASH ON CASH RETURN 37.12%

Conclusion

Since Airbnb is rapidly increasing and constantly changing for each city in the world, it is crucial to make decisions based on wild guesses. The data points mentioned in this article for Adelaide such as Airbnb occupancy rates, annual revenue, and average daily rate should be the primary basis before investing in a property. 

Hence, if the data presented above has given you ideas to boost your strategic pricing plan for your business, then an Airbnb rental arbitrage calculator is certainly what you need for success in the long run. It’s a fact that some of the STR investors are also considering Airbnb Rental Arbitrage, but they still need to have a reliable data tool on to base their conclusions! 

As we live in a digital era, an accurate data analytics tool can help your business stand out among your surrounding competitors and benchmark your property by tracking the occupancy rates of competing listings in your preferred city.

Airbtics
Categories
Airbnb Investment All About Airbnb

Investing in Property for Sale: How to Buy A Profitable Property for Airbnb in Melbourne City Centre

airbnb property for sale melbourne city centre

Melbourne offers plenty of reasons for one to live in and even start a business! Known for its many laneways and cultural diversity, Melbourne also has excellent dining options for all budgets and portrays amazing street art. It’s also known for being the coffee capital of the world and for being regularly voted as the world’s most livable city.  

If you are looking to invest in a property where you can maximize profitability in a particular region, then it’s certainly a must to consider the major things when buying a property for Airbnb. Particularly, Airbnb rules in Melbourne make it easier for those who want to start an Airbnb business because a planning permit is not required. Aside from this, Airbnb rental arbitrage in Melbourne is another option for those who are on a tight budget.

In this article, we’ll discuss the important Airbnb metrics in order to gauge the best property investment in Melbourne, Australia. This includes the best website recommendations for property investment, along with each property’s gross rental yield, cash-on-cash return, and annual revenue.

According to a recent study, vacancy rates for Melbourne apartments remain above +6% in the inner suburbs. With some of these factors easing into 2022, and affordability pressures returning to the housing market, units could become more appealing for many buyers pursuing property investment in Melbourne.

While there are plenty of houses for sale in Melbourne, looking at Airbnb occupancy rates in Australia can also give you a wide overview of profitability in the entire country. Continue reading to learn more about the properties that will generate profit for Airbnb!

Is Property Investment Profitable in Melbourne City Centre?

Australia is currently ranked as the top short-term rental market in Oceania with an impressive occupancy rate of 56%. Using an Airbnb calculator, it was discovered that a 3-bedroom apartment in Melbourne City Centre can generate an annual revenue of A$97,933 with a steady occupancy rate of 67% and a nightly rate of A$387.

airbnb property for sale melbourne city centre

airbnb property for sale melbourne city centre

Profitable Properties for Sale in Melbourne City Centre

Finding the best properties that have the potential to produce high yields and capital growth are certainly some of the preferences of major investors. It’s always best to ask for assistance from real estate agents to access exclusive and unique properties during the development stage. 

At the same time, it’s even better when a property investor like you conducts research about predicted growths and market forecasts. Here are some of the profitable properties in Melbourne City Centre along with the calculated gross rental yield, cash-on-cash return, and annual revenue:

Studio-type Property for Sale Melbourne
Studio-type Melbourne

16A/116-130 Main Drive, Macleod, VIC 3085

1. Studio-type Property for Sale Melbourne
Located within Kingsbury Gardens Apartments

Asking Price: A$114,000

GROSS RENTAL YIELD 23.53%
ANNUAL REVENUE A$26,825
CASH ON CASH RETURN 44.82%
airbnb property for sale melbourne city centre

411/42-50 Barry Street, Carlton, VIC 3053

2. 1-Bedroom Property for Sale Melbourne
0.72 km to University High School

Asking Price: A$128,000

GROSS RENTAL YIELD 24.83%
ANNUAL REVENUE A$32,030
CASH ON CASH RETURN 48.72%
2-Bedroom Melbourne
2-Bedroom Melbourne

136/325 Nepean Highway, Frankston, VIC 3199

3. 2-Bedroom Property for Sale Melbourne
1.11 km to Kananook Primary School

Asking Price: A$185,000

GROSS RENTAL YIELD 24.11%
ANNUAL REVENUE A$44,595
CASH ON CASH RETURN 46.55%
airbnb property for sale melbourne city centre
3-Bedroom Melbourne

3503 Diamond Leaf Ct, Valrico, FL 33594

4. 3-Bedroom Property for Sale Melbourne
Located at City Fridge Arrow Apartments

Asking Price: A$245,000

GROSS RENTAL YIELD 23.03%
ANNUAL REVENUE A$56,413
CASH ON CASH RETURN 43.31%
4-Bedroom Melbourne
4-Bedroom Melbourne

16 Sumac Street, Brookfield, VIC 3338

5. 4-Bedroom Property for Sale Melbourne
1.38 km to Catholic Regional College Melton

Asking Price: A$310,000

GROSS RENTAL YIELD 24.07%
ANNUAL REVENUE A$74,602
CASH ON CASH RETURN 46.43%

Conclusion

Since Airbnb is rapidly increasing and constantly changing for each city in the world, it is crucial to make decisions based on wild guesses. The data points mentioned in this article for Melbourne such as Airbnb occupancy rates, annual revenue, and average daily rate should be the primary basis before investing in a property. 

Hence, if the data presented above has given you ideas to boost your strategic pricing plan for your business, then an Airbnb rental arbitrage calculator is certainly what you need for success in the long run. It’s a fact that some of the STR investors are also considering Airbnb Rental Arbitrage, but they still need to have a reliable data tool on to base their conclusions! 

As we live in a digital era, an accurate data analytics tool can help your business stand out among your surrounding competitors and benchmark your property by tracking the occupancy rates of competing listings in your preferred city.

Airbtics
Categories
Airbnb Investment All About Airbnb

Top 5 Short Term Rental Markets for Investment in Europe + Best Neighborhoods for Airbnb

Short-term rental investments can be profitable if the right market is targeted and Airbnb key metrics have been anticipated beforehand. Particularly in Europe, which currently ranks as the highest Airbnb occupancy rate worldwide. The best short term rental markets for investment in Europe vary according to their respective locations and is crucial for achieving profitability.

United Nations World Tourism Organization (UNWTO) recently confirmed that Europe is responsible for almost 50% of the world’s tourist arrivals, making it the most visited region in the world. Relatively, short-term rental accommodations booked in Europe have exceeded pre-pandemic levels with a breaking record of 138% compared to 2021.

In this article, we’ll feature the top 5 short-term rental markets recommended for investment in Europe, along with the most profitable neighborhoods for Airbnb!

Overview of Airbnb Rules in Europe

While there are various rules for operating short-term rentals, the good news is that Airbnb is legal in Europe and usually requires hosts to register with their city councils or get a permit. Recently, 23 European cities are proposing to the European Commission to limit short-term rentals due to over-tourism. To date, there are still no single rules for regulating vacation rental platforms in Europe. Check out some of the most popular tourist destinations in Europe and a brief overview of their Airbnb rules:

Airbnb rules in Paris

Here are some of the existing short-term rental rules in Paris:

  • Registration is NOT necessary if you’re only offering private rooms for short-term rental, but is necessary if you’re renting an entire property, and if the property is your primary or secondary residence.
  • If you manage multiple listings, you’ll need to register each listing individually, receiving a registration number for each property you intend to list.
  • Rentals with “bail mobilité” (mobility lease) do NOT need to register.
  • If you plan to host guests throughout the year, you will need to convert your accommodation’s destination status by filing an application for urban planning permission to the City Hall.
  • Subsidized housing usually has rules that prohibit subletting without permission.
Airbnb rules in Barcelona

While Spain has general legislation to operate short-term rentals in a specific area, check out some of the existing short-term rental rules in Barcelona:

  • A Tourist Use House license is necessary to operate.
  • Apartment types in Barcelona include anything with a rental duration of fewer than 31 days.
  • Short-term stays are allowed for 30 days or more.
Airbnb rules in London

In the UK, the letting must not be for longer than 31 continuous days, otherwise, it’s considered a long stay. Learn about some of the short-term rental rules in London:

  • It is allowed to operate for 90 days (without a permit) similar to Manchester.
  • There is NO limit on renting out a portion of your home as long as you live there.
  • Hosts are liable to pay council tax and a planning permit is necessary for more than 90 days of rent.

Looking to invest in Airbnb? Go ahead and check the best areas to buy an investment property in London!

Airbnb rules in Florence

Here are some of the existing short-term rental rules in Florence:

  • It is required for hosts to prepare a written short-term rental contract for rentals less than 30 days.
  • Complete and submit an SCIA (Segnalazione Certificata di Inizio Attività) at Impresa Giorno website.
  • Request permission from your town or city council to operate short-term rent.
  • Verify your permission through the Turismo5 online portal to receive your CIR code.
  • Display your CIR code on all listings and advertisements for your short-term rental.

Why Invest in an Airbnb in Europe?

A year after the pandemic started, the majority of tourist destinations have closed and restricted their borders for travel. Surprisingly, despite the restrictions and limitations on flights and local travel, Europe still managed to be booked at 1.8 billion nights by tourists in 2021.  Let’s look closely and identify the reasons why investing in short-term rentals in Europe is a practical decision in 2022:
1. Year-round Tourist Destinations
Without a doubt, Europe is certainly the most popular tourist destination across the globe. Based on recent European statistics, more and more tourists and professionals are visiting the region for various reasons such as business, leisure, and recreational purposes.  To be specific, in Paris, Airbtics shows that 88.2% are domestic travelers while 11.8% international travelers. Next to France, the guests’ top country of origin is the USA.
short term rental markets for investment europe

It was also recently discovered that among all the continents worldwide, Europe has the highest Airbnb occupancy rate worldwide next to North America.

short term rental markets for investment europe
2. Increase in Short-Term Rental Bookings

Since Europe is a year-round favorite tourist destination by many visitors (including me), it’s no doubt that there’s a massive increase in short-term rental bookings! Eurostat confirms that short-term rental bookings in 2022 so far have already a whopping total of 200 million nights – which is about a 138% increase compared to 2021. 

Here’s a great example of the increase in short-term rental supply in Rome, Italy. Because there has been a significant increase in STR bookings, the supply of total available nights in Rome has also increased in 11 months. Based on Airbtics’ data, an average host in Rome such as Nicoletta, who owns 26 listings, earns about €2,199,547 yearly!

short term rental markets for investment europe
3. Strong Economic Growth 

Europe’s strong economic growth is definitely a must-place to invest in for the majority of property investors. Known as the second-largest economy in the world, Statista confirms that some of the European countries with the strongest economies are Germany, the UK, France, Italy, and Spain.

4. Assurance of Profitability

In general, European countries earn more profit in comparison to other continents worldwide due to their popularity and a wide variety of historical landmarks and attractions. While there’s the assurance of profitability in Europe, it’s still best to look into specific markets and neighborhoods to invest in to assure long-term profitability.

5 Top Short Term Rental Markets & Neighborhoods in Europe

It’s certainly a tedious task to manually look for STR markets and neighborhoods in Europe, and it’s almost impossible to get accurate results. Using Airbtics calculator, we were able to get precise data to discover the best short term rental markets for investment in Europe:

 1. Valencia, Spain
  • 4,299 Airbnb listings and 1,049 2-bedroom properties
  • Annual revenue: €26,335
  • Occupancy rate: 81%
  • Average nightly rate: €88

Home to three magnificent UNESCO World Heritage Declarations, Valencia is certainly more than just its famous paella recipe! The city attracts 2.2 million visitors annually for some of its tourist attractions such as the Valencia Cathedral and Old Town. Some of the Airbnb rules in Valencia include submitting an occupation license and responsible declarations to local tourism, it’s certainly legal to operate short-term rentals in the area.

Valencia
Best Neighborhoods for Airbnb in Valencia

1. Ciutat Vella

  • Historical centre with cultural attractions and museums, ceramics, and other craft stores.
Average Home Price Average Rental Price Monthly Revenue
€460,000 €1,250 €3,392

2. Eixample

  • Commercial area with popular shopping centres and accessible public transportation
Average Home Price Average Rental Price Monthly Revenue
€395,000 €1,150 €2,295

3. Extramurs

  • Residential & oldest neighborhoods with fascinating natural attractions.
Average Home Price Average Rental Price Monthly Revenue
€330,000 €950 €3,601
2. Luxembourg, France
  • 920 Airbnb listings and 286 1-bedroom properties
  • Annual revenue: €37,385
  • Occupancy rate: 73%
  • Average nightly rate: €148

Luxembourg has the highest median occupancy rate in the entire European region, which highlights its potential short-term rental profitability. Being the second-richest country in the world, it offers the highest minimum wage in Europe. Some of Luxembourg’s favorite tourist attractions are Palais Grand-Ducal, Vianden Castle, and Bock Casemates.

Luxembourg
Best Neighborhoods for Airbnb in Luxembourg

1. Esch-Sur-Alzette

  • Near the French border and walking distance to entertainment and business premises
Average Home Price Average Rental Price Monthly Revenue
€690,000 €1,500 €2,170

2. Luxembourg City Centre

  • Common tourist areas with luxury boutiques and shopping districts
Average Home Price Average Rental Price Monthly Revenue
€890,000 €1,700 €4,347

3. Bertrange

  • Village-like district in Luxembourg with baroque furnitures and art exhibits
Average Home Price Average Rental Price Monthly Revenue
€950,000 €1,750 €3,047
3. Lagos, Portugal
  • 611 Airbnb listings and 475 2-bedroom properties
  • Annual revenue: €24,983
  • Occupancy rate: 62%
  • Average nightly rate: €99

Lagos is one of the most popular touristic destinations in Europe, hence it has a high potential for strong returns on investments. In Lagos, every kind of tourist can find something for them to do, whether they are interested in historic places or golden beaches, they can find it all here.

Lagos
Best Neighborhoods for Airbnb in Lagos

1. Torralta

  • Located near the main beaches like Praia do Carnaval, Praia Dona Ana and Batata Beach, Torralta is a great spot for family holidays.
Average Home Price Average Rental Price Monthly Revenue
€560,000 €1,150 €2,351

2. Centro

  • This area is near the main historic attractions from Lagos’ Old Town and its attractive beaches. This neighborhood has everything to make all travelers happy all year round.
Average Home Price Average Rental Price Monthly Revenue
€525,000 €1,100 €2,501

3. Porto de Mós

  • This is a quiet neighborhood that is close to all amenities, here you can find the second largest beach in Lagos. It has a great geographical location and is a few kilometers away from Faro International Airport.
Average Home Price Average Rental Price Monthly Revenue
€510,000 €1,200 €3,053
4. Berlin, Germany
  • 1,260 Airbnb listings and 715 2-bedroom properties
  • Annual revenue: €41,702
  • Occupancy rate: 85%
  • Average nightly rate: €127

Berlin has surprisingly a variety of cultural art galleries, classic architecture, and is popular for historical landmarks about World War II. As the capital of Germany, it also has diverse tourist attractions and low-interest rates for properties – a sweet choice for property investors!

Berlin
Best Neighborhoods for Airbnb in Berlin

1. Mitte

  • Situated in the middle part of Berlin, excellent public transport system, and is the most demanded district for international guests.
Average Home Price Average Rental Price Monthly Revenue
€875,000 €1,950 €3,784

2. Charlottenburg-Wilmersdorf

  • Best for property investors who prefer to target student renters (university area) and tourists with close proximity to shopping centres.
Average Home Price Average Rental Price Monthly Revenue
€819,000 €1,180 €3,108

3. Tempelhof-Schöneberg

  • The northern sub-districts have a high demand for properties due to the quality infrastructure, shopping districts, and recreational premises.
Average Home Price Average Rental Price Monthly Revenue
€642,500 €1,550 €3,012
5. Florence, Italy
  • 2,238 Airbnb listings and 1,228 2-bedroom properties
  • Annual revenue: €33,359
  • Occupancy rate: 73%
  • Average nightly rate: €116

Looking for a classic city with exquisite architecture and renaissance art? Florence is one of the best places! The quiet and artsy city with delicious cuisine fills Florence with excitement for travelers across the globe. It is also one of the preferences of some property investors as this city has cheaper costs in comparison to the UK and France.

short term rental markets for investment europe
Best Neighborhoods for Airbnb in Florence

1. Santa Croce

  • This neighborhood is surrounded by historic buildings and offers extensive options when it comes to shopping and relaxing.
Average Home Price Average Rental Price Monthly Revenue
€349,000 €1,250 €3,498

2. Oltrarno

  • Offers the lowest rent prices among the other central areas and is a peaceful neighborhood.
Average Home Price Average Rental Price Monthly Revenue
€310,000 €1,300 €3,425

2. San Marco

  • This neighborhood provides a high quality of life and has a student population with many leisure activities and entertainment available.
Average Home Price Average Rental Price Monthly Revenue
€290,000 €1,600 €3,713

Conclusion

In general, property markets with the highest demand in Europe are usually located in the tourist and economic areas – and it’s always best to invest now while the prices are still affordable! Once you have decided to purchase a property in a particular country in Europe, it’s highly recommended to compare the areas and look at your competitors’ performance to properly understand the market. For instance, if you’re looking for other profitable locations, you can check the Airbnb occupancy rates by city UK

Using an accurate data analytics tool can help your business stand out among your surrounding competitors and benchmark your property by tracking the occupancy rates of competing listings in your preferred city. With the help of our all-in-one analytics service, you can vastly enhance your monthly revenue, create a comparison for each neighborhood, add the appropriate amenities and so many more exciting features. Try Airbtics now and stand out like a pro!

Categories
Airbnb Investment All About Airbnb

Best Places to Airbnb in New York

Before investing in a property in New York, it’s important to analyze your options and gauge your profitability based on Airbnb’s key metrics. In this article, we’ll feature the top 10 best areas to Airbnb in New York along with their respective occupancy rates, monthly & yearly revenue, average daily rates (ADRs), and so much more!

Airbnb’s Trending Cities 

Based on a recently released article about Airbnb’s top cities this summer of 2022, guests have searched for domestic summer destinations in the USA with over 10,000 searches. This simply means that vacationers are super ready to spend money and have fun under the sun! The travel demand has continuously recovered in comparison to pre-pandemic data. 

Is Airbnb Profitable in New York? 

Based on our recent article about Airbnb occupancy rates in New York, particularly in Brooklyn, an​​ average 1 BD / BA apartment has a steady 55% occupancy rate and can generate $3,321 monthly! Short-term rentals in New York can definitely be a source of passive income because of the many tourists visiting annually.

To cut the story short, Airbnb is definitely profitable in New York! For instance, based on an Airbnb income calculator, you can earn a whopping $37,522 annually in Upper West Side alone! This area is attracting millions of visitors from around the globe for attractions such as The Empire State Building, Central Park, NY Times Square, and so much more.

Not yet convinced? Feel free to listen to one of our interviewees from Into The Airbnb Podcast – an Airbnb host consultant & property manager from New York:

Rental Arbitrage in New York

If you want to start an Airbnb investment in New York but are financially limited to purchasing your own property, don’t worry. You can still earn a passive income in two words: Rental Arbitrage! This refers to the practice of renting out properties for the sole purpose of sub-letting them on platforms such as Airbnb or HomeAway.

It may be a challenge to find landlords for Airbnb rental arbitrage since there are certain restrictions in other areas and other landlords simply do not allow it due to insurance policies. In addition to this, you also have to consider major factors in starting a rental arbitrage business in your preferred city. This includes rules & regulations, where to find the most profitable area, & how to find rental arbitrage properties.

Given the fact that South Carolina is a practical investment destination for property investors, you can always have the option to do Rental Arbitrage and earn money while you’re saving up to own a property.

Top 10 Most Profitable Cities & Neighborhoods for Airbnb in New York

New York offers excellent investment opportunities for property investors, so we went ahead and did the heavy work for you! Oftentimes, the struggle is targetting an entire city but missing out on a particular neighborhood that has an even greater chance of profitability!

Best areas for airbnb in New York

Using Airbtics’ market analysis, we were able to accurately get a grasp of Airbnb demand in New York and filtered the top 10 most profitable cities:

1. Manhattan
  • Occupancy Rate: 71%
  • Annual Revenue: $39,017
  • Average Daily Rate: $164

Based on Airbtics’ analytics tool, the best neighborhood in this area is Upper West Side, which has an average occupancy rate of 77%. An average Airbnb host can earn an average daily rate of $137 in this neighborhood!

2. Upper Manhattan
  • Occupancy Rate: 71%
  • Annual Revenue: $37,522
  • Average Daily Rate: $106

Based on Airbtics’ analytics tool, the best neighborhood in this area is Harlem, which has an average occupancy rate of 74%. An average Airbnb host can earn an average daily rate of $103 in this neighborhood!

3. Queens
  • Occupancy Rate: 78%
  • Annual Revenue: $17,333
  • Average Daily Rate: $60

Based on Airbtics’ analytics tool, the best neighborhoods in this area are:

4. Astoria
  • Occupancy Rate: 73%
  • Annual Revenue: $21,705

An average Airbnb host can earn an average daily rate of $79 in this neighborhood!

5. Ridgewood
  •  Occupancy Rate: 73%
  • Annual Revenue: $22,064

An average Airbnb host can earn an average daily rate of $75 in this neighborhood!

6. Brooklyn
  •  Occupancy Rate: 78%
  • Annual Revenue: $30,775
  • Average Daily Rate: $108

Based on Airbtics’ analytics tool, the best neighborhood in this area is:

7. Williamsburg
  •  Occupancy Rate: 87%
  • Annual Revenue: $49,575

An average Airbnb host can earn an average daily rate of $79 in this neighborhood!

8. Staten Islands
  •  Occupancy Rate: 59%
  • Annual Revenue: $20,081
  • Average Daily Rate: $90

Based on Airbtics’ analytics tool, the best neighborhood in this area is Tompkinsville, which has an average occupancy rate of 69%. An average Airbnb host can earn an average daily rate of $91 in this neighborhood!

9. Bronx
  •  Occupancy Rate: 54%
  • Annual Revenue: $15,598
  • Average Daily Rate: $78

Based on Airbtics’ analytics tool, the best neighborhood in this area is Pelham Gardens, which has an average occupancy rate of 72%. An average Airbnb host can earn an average daily rate of $91 in this neighborhood!

10. Long Island
  •  Occupancy Rate: 39%
  • Annual Revenue: $37,005
  • Average Daily Rate: $286

Based on Airbtics’ analytics tool, the best neighborhood in this area is Montauk, which has an average occupancy rate of 40%. An average Airbnb host can earn an average daily rate of $389 in this neighborhood!

General Overview 

Now that you have a deeper understanding of which particular area to target in New York and some of the major Airbnb metrics to consider, don’t miss out on greater opportunities! Since Airbnb is rapidly increasing and constantly changing for each city in the world, it is crucial to make decisions based on wild guesses. The data points mentioned in this article such as Airbnb occupancy rates per city, annual revenue, and average daily rates should be your basis for investing in properties in New York – or other cities with high occupancy rates!

Hence, an accurate data analytics tool can help your business stand out among your surrounding competitors and benchmark your property by tracking the occupancy rates of competing listings in your preferred city. With the help of our all-in-one analytics service, you can vastly enhance your monthly revenue, create a comparison for each neighborhood, add the appropriate amenities and so many more exciting features. Try Airbtics today and think of long-term profitability!

Explore The Most Profitable Airbnb Locations in New York

Categories
Guides

Airbnb Investment Sourcing As A Service

What is property sourcing by Airbtics?

It is a free service for our Enterprise subscription users ($599.95/mo). Our team of data analyst and real estate expert will identify & vet high return Airbnb investment opportunities for you. 

You can expect to receive at least 5 deals with contact addresses of realtors. All deals will be personally selected by our analysts, and we will contact the realtors to understand the hidden costs and feasibility to do Airbnb. Finally, we will use our own data to ensure it will exceed 20% gross rental yield or 50% first year cash return with above 50% LTV mortgage. 

Currently, it is only available in the US, the UK and Spain. If you are from other areas, please let us know.

How does it work? 

Step 1
Once you subscribe to the Enterprise plan, an account manager will reach out to you in 1 working day. You will be asked to fill out a questionnaire to let us know about your property search criteria. (E.g. which areas, budget, mortgage availability etc).

Step 2
Our analysts will do the property search and use our own data to analyze the properties. We will keep you in the loop. 

How can I get started?

Step 1

Go to our app and sign up.

Step 2

Click the plus button located on the top bar.

Step 3

Select the Enterprise plan and complete the payment. Our relationship manager will reach out to you in 1 working day. 

Categories
Airbnb Investment All About Airbnb

Best Places to Airbnb in South Carolina

Before investing in a property in South Carolina, it’s important to analyze your options and gauge your profitability based on Airbnb’s key metrics. In this article, we’ll feature the top 10 best areas to Airbnb in South Carolina along with their respective occupancy rates, monthly & yearly revenue, average daily rates (ADRs), and so much more!

Airbnb’s Trending Cities 

Based on a recently released article about Airbnb’s top cities this summer of 2022, guests have searched for domestic summer destinations in the USA with over 10,000 searches. This simply means that vacationers are super ready to spend money and have fun under the sun! The travel demand has continuously recovered in comparison to pre-pandemic data. 

Is Airbnb Profitable in South Carolina? 

Based on our recent article about Airbnb occupancy rates by city, particularly in Myrtle Beach, an​​ average 1 BD / BA apartment has a steady 48% occupancy rate and can generate $2,751 monthly! Short-term rentals in South Carolina can definitely be a source of passive income because of the many tourists visiting annually for Middleton Place and other tourist destinations.

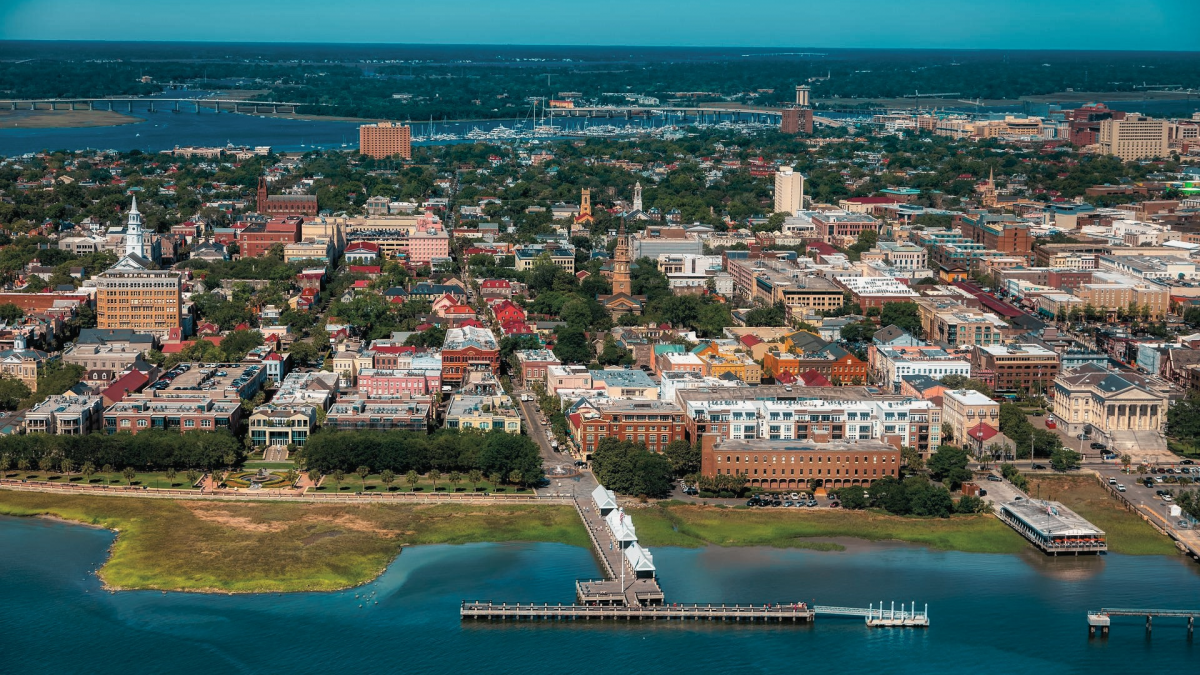
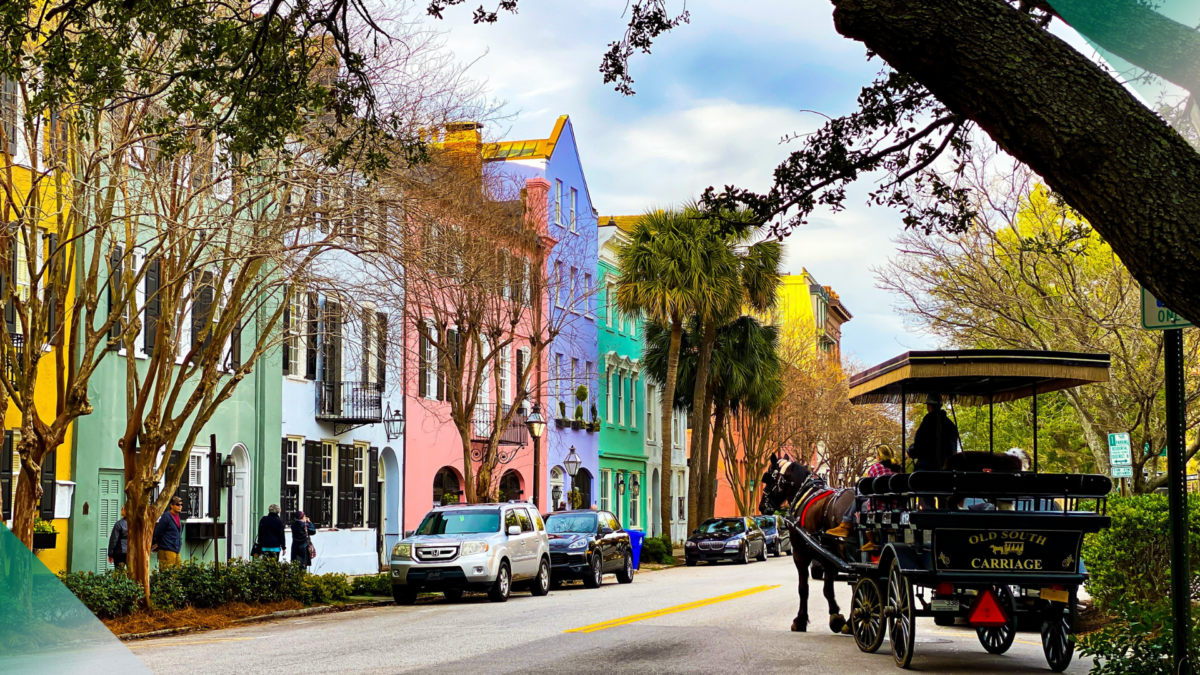
To cut the story short, Airbnb is definitely profitable in South Carolina! For instance, based on an Airbnb income calculator, you can earn a whopping $55,343 annually in Charleston alone! This area is attracting millions of visitors from around the globe for attractions such as Charleston Harbor, The Charleston Museum, South Carolina Aquarium, and many more.Not yet convinced? Feel free to listen to one of our interviewees from Into The Airbnb Podcast – an Airbnb cohost from South Carolina:

Rental Arbitrage in South Carolina

If you want to start an Airbnb investment in South Carolina but are financially limited to purchasing your own property, don’t worry. You can still earn a passive income in two words: Rental Arbitrage! This refers to the practice of renting out properties for the sole purpose of sub-letting them on platforms such as Airbnb or HomeAway.

It may be a challenge to find landlords for Airbnb rental arbitrage since there are certain restrictions in other areas and other landlords simply do not allow it due to insurance policies. In addition to this, you also have to consider major factors in starting a rental arbitrage business in your preferred city. This includes rules & regulations, where to find the most profitable area, & how to find rental arbitrage properties.

Best areas for airbnb in South Carolina

Given the fact that South Carolina is a practical investment destination for property investors, you can always have the option to do Rental Arbitrage and earn money while you’re saving up to own a property.

Top 10 Most Profitable Cities & Neighborhoods for Airbnb in South Carolina

South Carolina offers excellent investment opportunities for property investors, so we went ahead and did the heavy work for you! Oftentimes, the struggle is targetting an entire city but missing out on a particular neighborhood that has an even greater chance of profitability!

Best areas for airbnb in South Carolina

Using Airbtics’ market analysis, we were able to accurately get a grasp of Airbnb demand in South Carolina and filtered the top 10 most profitable cities:

1. Charleston
  • Occupancy Rate: 83%
  • Annual Revenue: $55,343
  • Average Daily Rate: $177

Based on Airbtics’ analytics tool, the best neighborhood in this area is Cannonborough Elliotborough, which has an average occupancy rate of 85%. An average Airbnb host can earn an average daily rate of $244 in this neighborhood!

2. Forest Acres
  • Occupancy Rate: 76%
  • Annual Revenue: $23,419
  • Average Daily Rate: $88

Based on Airbtics’ analytics tool, the best neighborhood in this area is Downtown, which has an average occupancy rate of 86%. An average Airbnb host can earn an average daily rate of $81 in this neighborhood!

3. Sumter
  • Occupancy Rate: 73%
  • Annual Revenue: $18,076
  • Average Daily Rate: $59

Based on Airbtics’ analytics tool, the best neighborhood in this area is Northwest Sumter, which has an average occupancy rate of 82%. An average Airbnb host can earn an average daily rate of $49 in this neighborhood!

4. Florence
  • Occupancy Rate: 70%
  • Annual Revenue: $21,556
  • Average Daily Rate: $71

Based on Airbtics’ analytics tool, the best area in this city is Gregg – King Ave, which has an average occupancy rate of 75%. An average Airbnb host can earn an average daily rate of $72 in this neighborhood!

5. Spartanburg
  •  Occupancy Rate: 70%
  • Annual Revenue: $26,297
  • Average Daily Rate: $85

Based on Airbtics’ analytics tool, the best neighborhood in this area is Converse Heights, which has an average occupancy rate of 77%. An average Airbnb host can earn an average daily rate of $106 in this neighborhood!

6. Hilton Head Island
  •  Occupancy Rate: 70%
  • Annual Revenue: $47,713
  • Average Daily Rate: $161

Based on Airbtics’ analytics tool, the best neighborhood in this area is South Beach, which has an average occupancy rate of 87%. An average Airbnb host can earn an average daily rate of $146 in this neighborhood!

7. Rockhill
  •  Occupancy Rate: 77%
  • Annual Revenue: $19,809
  • Average Daily Rate: $76

Based on Airbtics’ analytics tool, the best neighborhood in this area is Downtown Rockhill, which has an average occupancy rate of 75%. An average Airbnb host can earn an average daily rate of $70 in this neighborhood!

8. Greenville
  •  Occupancy Rate: 67%
  • Annual Revenue: $31,876
  • Average Daily Rate: $120

Based on Airbtics’ analytics tool, the best neighborhood in this area is Downtown Greenville, which has an average occupancy rate of 71%. An average Airbnb host can earn an average daily rate of $104 in this neighborhood!

9. Columbia
  •  Occupancy Rate: 59%
  • Annual Revenue: $24,489
  • Average Daily Rate: $103

Based on Airbtics’ analytics tool, the best neighborhood in this area is Earlewood, which has an average occupancy rate of 71%. An average Airbnb host can earn an average daily rate of $109 in this neighborhood!

10. Myrtle Beach
  •  Occupancy Rate: 46%
  • Annual Revenue: $25,769
  • Average Daily Rate: $125

Based on Airbtics’ analytics tool, the best neighborhood in this area is Downtown Myrtle Beach which has an average occupancy rate of 68%. An average Airbnb host can earn an average daily rate of $145 in this neighborhood!

General Overview 

Now that you have a deeper understanding of which particular area to target in South Carolina and some of the major Airbnb metrics to consider, don’t miss out on greater opportunities! Since Airbnb is rapidly increasing and constantly changing for each city in the world, it is crucial to make decisions based on wild guesses. The data points mentioned in this article such as Airbnb occupancy rates per city, annual revenue, and average daily rates should be your basis for investing in properties in South Carolina – or other cities with high occupancy rates!

Hence, an accurate data analytics tool can help your business stand out among your surrounding competitors and benchmark your property by tracking the occupancy rates of competing listings in your preferred city. With the help of our all-in-one analytics service, you can vastly enhance your monthly revenue, create a comparison for each neighborhood, add the appropriate amenities and so many more exciting features. Try Airbtics today and think of long-term profitability!

Explore The Most Profitable Airbnb Locations in South Carolina

Categories
Airbnb Investment All About Airbnb

Best Places to Airbnb in Arizona

Before investing in a property in Arizona, it’s important to analyze your options and gauge your profitability based on Airbnb’s key metrics. In this article, we’ll feature the top 10 best areas to Airbnb in Arizona along with their respective occupancy rates, monthly & yearly revenue, average daily rates (ADRs), and so much more!

Airbnb’s Trending Cities 

Based on a recently released article about Airbnb’s top cities this summer of 2022, guests have searched for domestic summer destinations in the USA with over 10,000 searches. This simply means that vacationers are super ready to spend money and have fun under the sun! The travel demand has continuously recovered in comparison to pre-pandemic data. 

Is Airbnb Profitable in Arizona? 

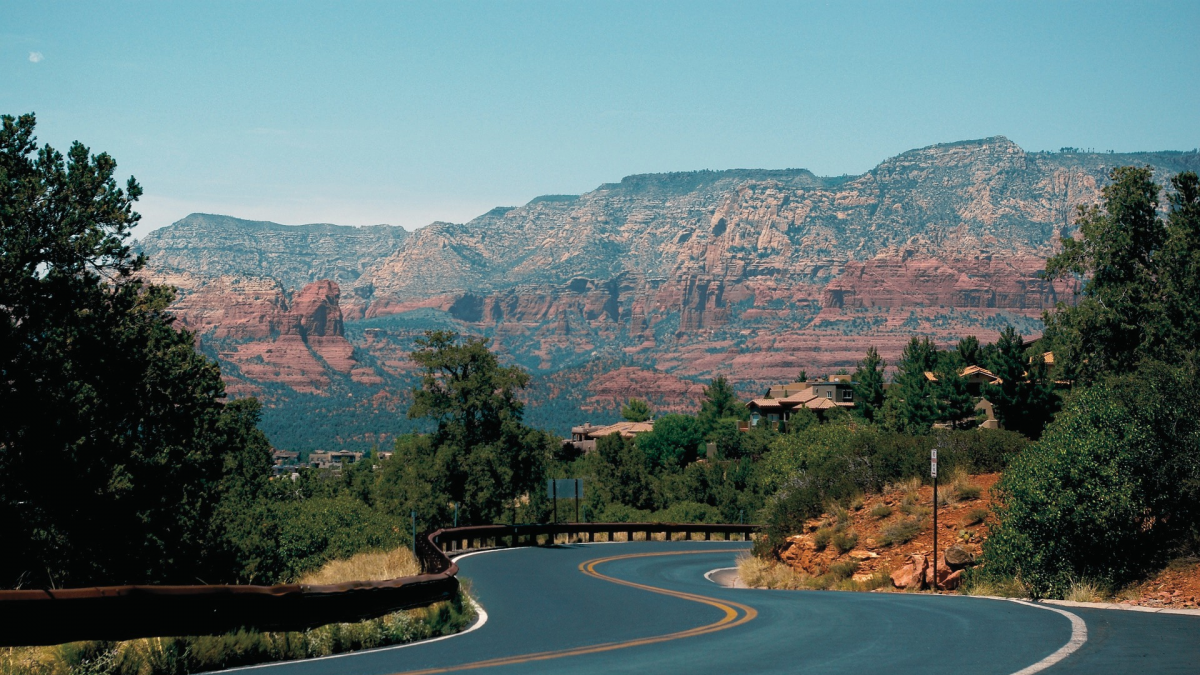
Based on our recent article about Airbnb occupancy rates by city, particularly in Phoenix, an​​ average 1 BD / BA apartment has a steady 61% occupancy rate and can generate $5,379 monthly! Short-term rentals in Arizona can definitely be a source of passive income because of the many tourists visiting annually for Grand Canyon and other tourist destinations.

To cut the story short, Airbnb is definitely profitable in Arizona! For instance, based on an Airbnb income calculator, you can earn a whopping $85,788 annually in Scottsdale alone! This area is attracting millions of visitors from around the globe since it’s known for being the world’s finest golf destination, along with attractions such as Taliesin West, Pinnacle Peak Park, Old Town Scottsdale, and the like.

Not yet convinced? Feel free to listen to our complete walk-through on Into The Airbnb Podcast and learn how you can start your rental arbitrage journey in  Arizona:

Rental Arbitrage in Arizona

If you want to start an Airbnb investment in Arizona but are financially limited to purchasing your own property, don’t worry. You can still earn a passive income in two words: Rental Arbitrage! This refers to the practice of renting out properties for the sole purpose of sub-letting them on platforms such as Airbnb or HomeAway.

It may be a challenge to find landlords for Airbnb rental arbitrage since there are certain restrictions in other areas and other landlords simply do not allow it due to insurance policies. In addition to this, you also have to consider major factors in starting a rental arbitrage business in your preferred city. This includes rules & regulations, where to find the most profitable area, & how to find rental arbitrage properties.

Rental Arbitrage in Arizona is certainly legal and there are ways to predict your listing’s profitability. For instance, a short-term rental analytics tool can assure your nightly revenue of $106 for a 1-bedroom apartment in Tucson with a steady occupancy rate of 72%. These Airbnb key metrics should be strictly monitored as your business’ profitability depends on them!  

Best areas for airbnb in arizona

Given the fact that Arizona is a practical investment destination for property investors, you can always have the option to do rental arbitrage and earn money while you’re saving up to own a property.

Top 10 Most Profitable Cities & Neighborhoods for Airbnb in Arizona

Arizona offers excellent investment opportunities for property investors, so we went ahead and did the heavy work for you! Oftentimes, the struggle is targetting an entire city but missing out on a particular neighborhood that has an even greater chance of profitability. 

Best areas for airbnb in arizona

Using Airbtics’ market analysis, we were able to accurately get a grasp of Airbnb demand in Arizona and filtered the top 10 most profitable cities:

1. Sedona
  • Occupancy Rate: 82%
  • Annual Revenue: $51,810
  • Average Daily Rate: $168

Based on Airbtics’ analytics tool, the best neighborhood in this area is South West Sedona, which has an average occupancy rate of 88%. An average Airbnb host can earn the same daily rate of $168 in this neighborhood!

2. Flagstaff
  • Occupancy Rate: 67%
  • Annual Revenue: $34,149
  • Average Daily Rate: $118

Based on Airbtics’ analytics tool, the best neighborhood in this area is University Heights, which has an average occupancy rate of 84%. An average Airbnb host can earn an average daily rate of $104 in this neighborhood!

3. Chandler
  • Occupancy Rate: 66%
  • Annual Revenue: $52,977
  • Average Daily Rate: $149

Based on Airbtics’ analytics tool, the best neighborhood in this area is Downtown Chandler, which has an average occupancy rate of 74%. An average Airbnb host can earn an average daily rate of $162 in this neighborhood!

4. Tempe
  • Occupancy Rate: 73%
  • Annual Revenue: $28,320
  • Average Daily Rate: $102

Based on Airbtics’ analytics tool, the best neighborhood in this area is Downtown Tempe, which has an average occupancy rate of 75%. An average Airbnb host can earn an average daily rate of $126 in this neighborhood!

5. Gilbert
  •  Occupancy Rate: 71%
  • Annual Revenue: $23,021
  • Average Daily Rate: $76

Based on Airbtics’ analytics tool, the best neighborhood in this area is The Islands, which has an average occupancy rate of 65%. An average Airbnb host can earn an average daily rate of $75 in this neighborhood!

6. Tucson
  •  Occupancy Rate: 70%
  • Annual Revenue: $25,588
  • Average Daily Rate: $90

Based on Airbtics’ analytics tool, the best neighborhood in this area is Sam Hughes, which has an average occupancy rate of 72%. An average Airbnb host can earn an average daily rate of $113 in this neighborhood!

7. Scottsdale
  •  Occupancy Rate: 69%
  • Annual Revenue: $41,329
  • Average Daily Rate: $137

Based on Airbtics’ analytics tool, the best neighborhood in this area is Chateau de Vie, which has an average occupancy rate of 76%. An average Airbnb host can earn an average daily rate of $90 in this neighborhood!

8. Phoenix
  •  Occupancy Rate: 68%
  • Annual Revenue: $26,435
  • Average Daily Rate: $100

Based on Airbtics’ analytics tool, the best neighborhood in this area is Midtown, which has an average occupancy rate of 73%. An average Airbnb host can earn an average daily rate of $104 in this neighborhood!

9. Yuma
  •  Occupancy Rate: 64%
  • Annual Revenue: $20,843
  • Average Daily Rate: $77

Based on Airbtics’ analytics tool, the best neighborhood in this area is Yuma Heights, which has an average occupancy rate of 69%. An average Airbnb host can earn an average daily rate of $86 in this neighborhood!

10. Glendale
  •  Occupancy Rate: 53%
  • Annual Revenue: $$15,538
  • Average Daily Rate: $73

Based on Airbtics’ analytics tool, the best neighborhood in this area is Las Brisa Pointe, which has an average occupancy rate of 65%. An average Airbnb host can earn an average daily rate of $45 in this neighborhood!

General Overview 

Now that you have a deeper understanding of which particular area to target in Arizona and some of the major Airbnb metrics to consider, don’t miss out on greater opportunities! 

Since Airbnb is rapidly increasing and constantly changing for each city in the world, it is crucial to make decisions based on wild guesses. The data points mentioned in this article such as Airbnb occupancy rates per city, annual revenue, and average daily rates should be your basis for investing in properties in Arizona – or other cities with high occupancy rates!

Hence, an accurate data analytics tool can help your business stand out among your surrounding competitors and benchmark your property by tracking the occupancy rates of competing listings in your preferred city. With the help of our all-in-one analytics service, you can vastly enhance your monthly revenue, create a comparison for each neighborhood, add the appropriate amenities and so many more exciting features. Try Airbtics today and think of long-term profitability!

Explore The Most Profitable Airbnb Locations in Arizona

Categories
Airbnb Investment All About Airbnb

10 Best Places to Airbnb in California: With Free Airbnb Data

Best Places to Airbnb in California: Looking for the best profitable Airbnb areas in California? Check out the top cities & neighborhoods where property investors are targetting!

Looking for the best profitable Airbnb areas in California? Check out the top cities & neighborhoods where property investors are targetting!

Before investing in a property in California, it’s important to analyze your options and gauge your profitability based on Airbnb’s key metrics. In this article, we’ll feature the top 10 best areas for Airbnb in California along with their respective occupancy rates, monthly & yearly revenue, average daily rates (ADRs), and so much more!

Is Airbnb Profitable in California? 

Short-term rentals in California can definitely be a source of passive income because of the many tourists visiting annually. For example,​​ a typical 1 BD apartment has a steady 50% occupancy rate and can generate $30,500 annually! 

To cut the story short, Airbnb is definitely profitable in California! For instance, based on an Airbnb income calculator, you can earn a whopping $6,612 monthly in San Diego alone! This area is attracting millions of visitors from around the globe for attractions such as The San Diego Zoo, San Diego Zoo Safari Park, SeaWorld San Diego, and LEGOLAND California.

Not yet convinced? Feel free to listen to one of our interviewees from Into The Airbnb Podcast – an Airbnb host consultant & property manager from California:

Rental Arbitrage in California

If you want to start an Airbnb investment in California but are financially limited to purchasing your own property, don’t worry. You can still earn a passive income in two words: Rental Arbitrage! This refers to the practice of renting out properties for the sole purpose of sub-letting them on platforms such as Airbnb or HomeAway.

However, if you only want to do Airbnb during your free time and are worried about not having to manage your listings properly, then it’s best to take a look at the best property management companies in California to lessen the burden!

It may be a challenge to find landlords for Airbnb rental arbitrage since there are certain restrictions in other areas and other landlords simply do not allow it due to insurance policies. In addition to this, you also have to consider major factors in starting a rental arbitrage business in your preferred city. This includes rules & regulations, where to find the most profitable area, & how to find rental arbitrage properties.

Rental Arbitrage in San Diego is certainly legal and there are ways to predict your listing’s profitability. For instance, a short-term rental analytics tool can assure your nightly revenue of $276 for a 1-bedroom apartment in San Diego with a steady occupancy rate of 72%. These Airbnb key metrics should be strictly monitored as your business’ profitability depends on them!  

best areas for airbnb in california

Given the fact that California is a practical investment destination for property investors, you can always have the option to do Rental Arbitrage in California and earn money while you’re saving up to own a property.

Top 10 Most Profitable Cities & Neighborhoods for Airbnb in California

California offers excellent investment opportunities for property investors, so we went ahead and did the heavy work for you! Oftentimes, the struggle is targeting an entire city but missing out on a particular neighborhood that has an even greater chance of profitability!

best areas for airbnb in california

Using Airbtics’ market analysis, we were able to accurately get a grasp of Airbnb demand in California and filtered the top 10 most profitable cities:

1. Santa Barbara
Santa Barbara data
  • Annual Revenue: $58,334
  • Occupancy Rate: 56%
  • Average Daily Rate: $312

Based on Airbtics’ analytics tool, the best neighborhood in this area is Santa Barbara Downtown. It has an average occupancy rate of 53%. The average daily rate in this neighborhood is $281.

2. Yosemite
Yosemite data
  • Annual Revenue: $100,984
  • Occupancy Rate: 52%
  • Average Daily Rate: $424

Based on Airbtics’ analytics tool, the best neighborhood in this area is Yosemite West. It has an average occupancy rate of 65%. The average daily rate in this neighborhood is $323.

3. San Francisco
San francisco data
  • Annual Revenue: $32,607
  • Occupancy Rate: 56%
  • Average Daily Rate: $152

Based on Airbtics’ analytics tool, the best neighborhood in this area is North Beach. It has an average occupancy rate of 30%. The average daily rate in this neighborhood is $136.

4. San Diego
best areas for airbnb in california
  • Annual Revenue: $36,739
  • Occupancy Rate: 49%
  • Average Daily Rate: $199

Based on Airbtics’ analytics tool, the best neighborhood in this area is North Park. It has an average occupancy rate of 50%. The average daily rate in this neighborhood is $178.

5. Los Angeles
best areas for airbnb in california
  • Annual Revenue: $30,868
  • Occupancy Rate: 56%
  • Average Daily Rate: $155

Based on Airbtics’ analytics tool, the best neighborhood in this area is Malibu. It has an average occupancy rate of 35%. The average daily rate in this neighborhood is $1,106.

6. Joshua Tree
best areas for airbnb in california
  • Annual Revenue: $36,684
  • Occupancy Rate: 44%
  • Average Daily Rate: $200

Based on Airbtics’ analytics tool, the best neighborhood in this area is Yucca Valley. It has an average occupancy rate of 37%. The average daily rate in this neighborhood is $239.

7. Riverside
best areas for airbnb in california
  • Annual Revenue: $12,372
  • Occupancy Rate: 29%
  • Average Daily Rate: $93

Based on Airbtics’ analytics tool, the best neighborhood in this area is Mission Inn Downtown. It has an average occupancy rate of 35%. The average daily rate in this neighborhood is $125.

8. Palm Springs
best areas for airbnb in california
  • Annual Revenue: $41,612
  • Occupancy Rate: 40%
  • Average Daily Rate: $306

Based on Airbtics’ analytics tool, the best neighborhood in this area is Coachella Valley. It has an average occupancy rate of 36%. The average daily rate in this neighborhood is $449.

9. Lake Tahoe
best areas for airbnb in california
  • Annual Revenue: $61,838
  • Occupancy Rate: 50%
  • Average Daily Rate: $312

Based on Airbtics’ analytics tool, the best neighborhood in this area is Incline Village. It has an average occupancy rate of 43%. The average daily rate in this neighborhood is $314.

10. San Bernardino
best areas for airbnb in california
  • Annual Revenue: $31,628
  • Occupancy Rate: 36%
  • Average Daily Rate: $221

Based on Airbtics’ analytics tool, the best neighborhood in this area is Crestline. It has an average occupancy rate of 42%. The average daily rate in this neighborhood is $199.

General Overview 

Now that you have a deeper understanding of the best short-term rental markets in California, , don’t just stop here and miss out on greater opportunities. 

Since Airbnb is rapidly increasing and constantly changing for each city in the world, it is crucial not to make decisions based on wild guesses. The data points mentioned in this article such as Airbnb occupancy rates per city, annual revenue, and average daily rates should be your basis for investing in properties in California – or other cities with high occupancy rates.

Hence, an accurate data analytics tool can help your business stand out among your surrounding competitors and benchmark your property by tracking the occupancy rates of competing listings in your preferred city. With the help of our all-in-one analytics service, you can vastly enhance your monthly revenue, create a comparison for each neighborhood, add the appropriate amenities and so many more exciting features. Try Airbtics today and think of long-term profitability!

Explore The Most Profitable Airbnb Locations in California

Pro Book

Deeper STR Insights. Broader Investment Opportunities.

Want to go deeper, broader, and faster? Supercharge your Airbnb Investment by accessing the most in-depth Airbnb & real estate insights with our exclusive STR report.

Unlock Worldwide
Short-Term Rental Data
Find unsaturated neighborhoods with the highest occupancy history.

Unlock Worldwide
Short-Term Rental Data
Find unsaturated neighborhoods with the highest occupancy history.

rental arbitrage calculator
Airbtics Rental Arbitrage Calculator

Is it legal to Start an Airbnb Rental Arbitrage? To cut the story short, starting a rental arbitrage business is certainly legal! As long as …

Read More →
Annual Airbnb Revenue in Edison new jersey, USA

Edison, New Jersey| Airbnb Market Data & Overview | USA Edison, New Jersey Airbnb Market Data & Overview USA Is it profitable to do Airbnb …

Read More →
Annual Airbnb Revenue in Tunbridge wells, UK

Tunbridge Wells| Airbnb Market Data & Overview | UK Tunbridge Wells Airbnb Market Data & Overview UK Is it profitable to do Airbnb in Tunbridge …

Read More →
Top Property Management Companies Geelong, Australia

Top 13 Property Management Companies in Geelong Top 13 Property Management Companies in Geelong Last updated on: 14th June, 2024 This list aims to provide …

Read More →
Annual Airbnb Revenue in colmar-france-fr

Colmar| statistiques airbnb & simulateur airbnb | France Colmar statistiques airbnb & simulateur airbnbFrance Est-il rentable de faire de l’Airbnb à Colmar, France? Quel est …

Read More →
Annual Airbnb Revenue in Greater hobart tas, Australia

Greater Hobart TAS| Airbnb Market Data & Overview | Australia Greater Hobart TAS Airbnb Market Data & Overview Australia Is it profitable to do Airbnb …

Read More →

Categories
Airbnb Investment All About Airbnb

100 Best Places for Airbnb in 10 regions [2024]

Discover the 100 best places for Airbnb in 2024. Find out essential metrics and start paving the way for lucrative opportunities!

best places for airbnb

Discover the 100 best places for Airbnb in 2024. Find out essential metrics and start paving the way for lucrative opportunities!

100 Best Places for Airbnb in 10 regions [2024]

Looking for the best places for Airbnb has always been a persistent challenge for many investors. And it will undoubtedly remain a top consideration in the future. 

The revolution that Airbnb started in the hospitality industry gave birth to another one. 

No longer a mere luxury, Airbnb analytics has proven itself to be a necessity in short-term rental investing. 

You no longer have to go high and low to know your next Airbnb city. Armed with precise Airbnb data, we’ll uncover the cities that promise unparalleled returns. Get ready for an exhilarating journey into the heart of strategic Airbnb investing!

What to Look for in an Airbnb Location?

Knowing the best places for Airbnb is important to maximize ROI. In fact, location can either make or break your investment.  Believe it or not, the best Airbnb cities share one or a few things. So, here’s what you have to look out for.

1. High Tourist Traffic

In general, short-term rentals are the best alternative to expensive hotels.  So, tourism should be the number one consideration when starting an Airbnb. The most profitable Airbnb locations are close to tourist attractions such as beaches, mountains, historical sites, and national parks. Urban business districts are underrated Airbnb hotspots. Bustling cities with financial centers are often overlooked as top Airbnb locations. 

All these sites should be accessible via reliable public transportation.  Consider that your guests are only in town for a very short time. And nobody wants to spend their precious time shuttling back and forth between tourist sites. 

2. Airbnb Metrics

Airbnb KPIs are essential for any hosts, investors, and property managers. In fact, you can easily identify the Best Airbnb cities just by looking at the KPIs. So, take note of the following:

  • Airbnb Occupancy Rate – Guage the success of the market by calculating the ratio of the total booked nights to the total available nights of all listed properties.
  • Average Daily Rate – This is the daily average amount that hosts can earn in a market. You can compute this by dividing the total booking revenue by the total number of nights booked for all listed properties. 
  • Revenue Per Available Listings – RevPAL measures the profitability of individual short-term rental properties. It can assess the overall health of an Airbnb market, going beyond a mere snapshot of individual listings.
  • Airbnb Average Length of Stay – This metric refers to the average number of nights that have been booked by individual guests. This can be calculated by dividing the total nights booked by the total number of individual guest bookings.

3. Airbnb Rules and Regulations

Navigate the path to success with a clear understanding of local short-term rental rules and regulations in your preferred area. Each city has its unique set of guidelines, and some locations enforce stringent measures in compliance with local laws. You should always prioritize compliance to safeguard your investment and foster positive relationships with the local community.

Methodology

Finding profitable locations for short-term rentals can be quite a challenge as there are many aspects that investors should consider. Having said that, it’s crucial to conduct thorough market research considering factors like high-demand areas, affordability, and what type of competitors you will have around you. Additionally, it’s essential to understand local regulations and tax implications in the area where you want to host Airbnb guests. 

To pinpoint the best locations for Airbnb listings, we considered the market proximity to tourist attractions, its popularity as a travel destination, its infrastructure and accessibility, and of course, the area’s potential revenue, median occupancy rates, and seasonality. For the last few metrics, we relied on the Airbtics Dashboard to get reliable insights into the different markets and choose the best areas that can generate a good cash-on-cash return. 

Thanks to this, we could come up with the 10 best cities for STR listings in countries where Airbnb is considered a major economic force: 

The Best Places for Airbnb in 2024

United States

airbtics-logo-300x87
City Airbnb Listings Airbnb Annual Revenue Median Occupancy Rate Average Daily Rate Median Property Price
Paris 10,639 €52,745 95% €166 €763,741
Nice 10,087 €34,682 91% €109 €386,319
Annecy 2,628 €27,247 77% €98 €467,884
Bordeaux 4,152 €26,601 83% €90 €355,918
Aix-en-Provence 2,720 €23,570 77% €88 €402,632
Strasbourg 2,283 €23,430 80% €83 €299,564
Marseille 11,326 €22,542 76% €85 €283,251
La Rochelle 3,841 €22,109 77% €80 €377,421
Lyon 5,430 €21,036 78% €76 €384,095
Nantes 2,678 €17,073 77% €63 €262,537

Spain

airbtics-logo-300x87
City Airbnb Listings Airbnb Annual Revenue Median Occupancy Rate Average Daily Rate Median Property Price
Barcelona 12,926 €38,964 87% €131 €440,000
Madrid 2,651 €37,869 85% €87 €523,146
Girona 460 €31,465 84% €101 €278,294
Malaga 7,209 €30,792 86% €102 €369,309
Bilbao 1,531 €29,032 78% €100 €364,120
Valencia 7,524 €28,661 87% €94 €305,995
Sevilla 6,438 €25,462 73% €97 €248,206
Alicante 3,713 €25,090 79% €88 €260,265
Costa Teguise 701 €24,244 90% €73 €188,830
Tarragona 655 €24,110 67% €98 €162,341

Italy

airbtics-logo-300x87
City Airbnb Listings Airbnb Annual Revenue Median Occupancy Rate Average Daily Rate Median Property Price
Venice 6,835 €45,255 85% €146 €480,000
Como 1,186 €44,784 87% €144 €476,600
Florence 9,188 €40,690 92% €125 €495,000
Rome 3,056 €36,331 96% €109 €599,600
Verona 2,290 €33,584 81% €120 €425,000
Bergamo 912 €28,047 89% €91 €420,000
Bologna 3,630 €27,274 86% €95 €480,000
Pisa 1,139 €26,363 86% €91 €460,000
Naples 7,665 €25,486 84% €88 €440,000
Palermo 5,084 €21,268 81% €75 €264,000

United Kingdom

airbtics-logo-300x87
City Airbnb Listings Airbnb Annual Revenue Median Occupancy Rate Average Daily Rate Median Property Price
Edinburgh 6,730 £42,964 91% £135 £335,486
London 10,164 £31,418 86% £110 £724,718
Glasgow 2,289 £28,047 77% £104 £209,618
Bristol 2,182 £24,987 78% £90 £388,242
Manchester 2,166 £21,663 66% £93 £292,298
Newcastle 734 £21,582 62% £98 £211,374
Leeds 1,376 £20,115 69% £85 £250,680
Aberdeen 680 £19,816 73% £74 £182,766
Nottingham 1,106 £18,789 64% £91 £254,681
Sheffield 1,046 £18,107 64% £81 £238,222

Australia

airbtics-logo-300x87
City Airbnb Listings Airbnb Annual Revenue Median Occupancy Rate Average Daily Rate Median Property Price
Byron Bay 1,106 A$100,445 62% A$451 A$238,222
Esperance 142 A$65,215 71% A$255 A$500,000
Hobart 1,019 A$61,122 74% A$227 A$841,500
Busselton 495 A$61,111 67% A$245 A$682,500
Newcastle 1,063 A$55,245 62% A$255 A$791,000
Adelaide 3,596 A$53,382 73% A$199 A$900,000
Perth 4,079 A$52,608 90% A$160 A$855,000
Melbourne 413 A$50,609 78% A$190 A$918,350
Launceston 506 A$50,555 70% A$119 A$655,000
Brisbane 4,500 A$49,780 85% A$163 A$742,500

Canada

airbtics-logo-300x87
City Airbnb Listings Airbnb Annual Revenue Median Occupancy Rate Average Daily Rate Median Property Price
Whitehorse, YT 233 C$51,082 81% C$169 C$625,000
Victoria, BC 1,227 C$48,286 82% C$159 C$721,000
Quebec City, QC 1,390 C$46,892 75% C$162 C$466,319
Chilliwack, BC 348 C$42,915 74% C$165 C$853,000
Montreal, QC 7,170 C$37,152 74% C$143 C$539,000
St. Chaterines, ON 359 C$35,187 66% C$146 C$571,000
Winnipeg, M 1,495 C$24,955 72% C$95 C$370,000
Saskatoon, SK 656 C$24,296 80% C$82 C$380,000
Edmonton, AB 2,765 C$24,266 71% C$88 C$380,827
Ottawa, ON 585 C$21,579 69% C$91 C$635,000

Japan

airbtics-logo-300x87
City Airbnb Listings Airbnb Annual Revenue Median Occupancy Rate Average Daily Rate Median Property Price
Tokyo 11,464 ¥4,459,204 ($31,789) 91% ¥14,038 ($98) ¥62,510,000 ($429,116)
Kyoto 3,435 ¥3,823,505 ($26,693) 73% ¥14,897 ($104) ¥34,190,000 ($234,706)
Yokohama 171 ¥3,506,229 ($24,478) 75% ¥11,889 ($83) ¥34,520,000 ($236,971)
Kobe 144 ¥3,454,089 ($24,114) 61% ¥14,324 ($100) ¥23,590,000 ($161,939)
Sapporo 1,176 ¥3,452,084 ($24,100) 69% ¥11,746 ($82) ¥20,010,000 ($137,364)
Fukuoka 979 ¥3,302,828 ($23,058) 81% ¥11,316 ($109) ¥21,850,000 ($149,995)
Hiroshima 391 ¥3,076,365 ($21,477) 62% ¥511,316 ($79) ¥22,670,000 ($155,624)
Osaka 6,902 ¥2,853,198 ($19,919) 79% ¥10,027 ($70) ¥30,000,000 ($205,943)
Nagoya 453 ¥2,676,439 ($18,685) 66% ¥10,313 ($72) ¥23,170,000 ($159,056)
Okinawa 109 ¥2,454,131 ($17,133) 53% ¥10,600 ($74) ¥34,300,000 ($235,461)

Mexico

airbtics-logo-300x87
City Airbnb Listings Airbnb Annual Revenue Median Occupancy Rate Average Daily Rate Median Property Price
Puerto Peñasco 1,831 MXN467,765 ($26,945) 42% MXN2,899 ($167) MXN3,326,197 ($191,923)
Puerto Vallarta 6,579 MXN398,169 ($22,936) 60% MXN1,840 ($106) MXN4,000,000 ($230,802)
San Miguel de Allende 261 MXN297,186 ($17,119) 44% MXN1,805 ($104) MXN6,100,000 ($351,973)
Tulum 6,893 MXN245,071 ($14,117) 48% MXN1,371 ($79) MXN6,585,731 ($380,000)
Playa del Carmen 10,685 MXN232,155 ($13,373) 56% MXN1,128 ($65) MXN6,000,000 ($346,203)
Mexico City (CDMX) 14,998 MXN222,677 ($12,827) 68% MXN885 ($51) MXN6,400,000 ($369,283)
Cancun 6,866 MXN210,473 ($12,124) 60% MXN1,007 ($58) MXN7,900,000 ($455,834)
Merida 4,698 MXN158,028 ($9,103) 55% MXN816 ($47) MXN4,600,000 ($265,422)
Guadalajara 5,072 MXN152,490 ($8,784) 57% MXN764 ($44) MXN4,600,000 ($265,422)
Oaxaca 3,767 MXN137,908 ($7,944) 47% MXN833 ($48) MXN3,194,080 ($184,300)

Portugal

airbtics-logo-300x87
City Airbnb Listings Airbnb Annual Revenue Median Occupancy Rate Average Daily Rate Median Property Price
Cascais 829 €40,862 82% €141 €690,000
Lagos 2,725 €34,319 84% €116 €575,000
Lisbon 13,044 €34,094 95% €101 €600,000
Funchal 1,880 €31,425 100% €93 €550,000
Olhao 551 €30,203 80% €104 €340,000
Ericeira 742 €29,932 77% €108 €525,000
Oeiras 340 €27,258 85% €95 €450,000
Sintra 552 €26,894 75% €98 €399,000
Porto 8,603 €25,655 88% €81 €485,000
Faro 914 €25,359 82% €87 €390,000

How To Find the Best Places for Airbnb

Use only the best analytics tool to find the top Airbnb locations. As a tip, we recommend you focus on those that can provide Airbnb dynamic data, which not all platforms have. In the past, it was quite a challenge to find apps that offer this type of dataset, but sites like Airbtics have taken the helm to provide this resourceful service to investors!

Imagine exploring the best Airbnb cities while getting useful dynamic data that can make things easier for you. It’s possible with the Airbtics Dashboard since you can easily collect important information such as the average revenue, occupancy rates, nightly rates, and seasonality, among others.

Your search begins by simply typing the name of your target Airbnb city. As you go along, you can use this Airbnb Property Search Spreadsheet to help you make informed and data-backed investment decisions.

You will now have a better view of your target Airbnb location. And if you happen to have a list of Airbnb cities, then the one with the highest gross rental yield is your best Airbnb location!

best places for airbnb

The Best Places for Airbnb Never End in Cities

Being more specific with the most profitable Airbnb locations leads you EXACTLY where the money is. 

Navigating the map is the best part of dynamic data! By simply moving and zooming in and out of your map, the data will also update accordingly!  And in less than five minutes, you can identify the most lucrative part or neighborhood within your Airbnb city. 

Then, save the most profitable neighborhoods by creating an Airbnb custom market. You’re already creating an Airbnb submarket. 

Let me reiterate: With the Airbtics Dashboard, you can effortlessly create and access your city or submarket without unlocking them separately. And since this is a custom market feature, you decide whether or not you want to follow formal geographical boundaries!

Have fun playing around with the filters to go the extra mile with less effort in your property search. We put them there for a reason!

Use filters to figure out the best Airbnb property type, the best number of Airbnb bedrooms and many more in very specific locations. 

Unlock Profitable Markets with Rental Analytics

Guided by short-term rental analytics, we have learned the best places for Airbnb investment. However, the search should not end with the most profitable Airbnb locations. 

You can further optimize your ROI by adding additional steps that will take you to higher earnings. This includes finding the best neighborhoods, property types, and the number of bedrooms. In more formal terms, these are called Airbnb submarket.

This does not have to be complicated. You can find them all as long as you have a reliable Airbnb analytics tool. Airbtics puts ease of use and accuracy together. So you’re assured that you will easily maximize the most comprehensive and accurate Airbnb data.

Imagine answering a lot of important questions in Airbnb investing:

  • The “Where?” – Airbnb City
  • The “Where Exactly?” – The Most Profitable Neighborhood in the Airbnb City
  • The “What?” – The House or Condo Dilemma
  • And “The How Many” – The Best Number of Bedrooms

Find the answers to all of these crucial questions using Airbtics Dashboard! Go and try it for FREE!

Unlock Worldwide
Short-Term Rental Data
Find unsaturated neighborhoods with the highest occupancy history.

Unlock Worldwide
Short-Term Rental Data
Find unsaturated neighborhoods with the highest occupancy history.

Annual Airbnb Revenue in South san francisco california, USA

South San Francisco, California| Airbnb Market Data & Overview | USA South San Francisco, California Airbnb Market Data & Overview USA Is it profitable to …

Read More →
Annual Airbnb Revenue in Clarksville indiana, USA

Clarksville, Indiana| Airbnb Market Data & Overview | USA Clarksville, Indiana Airbnb Market Data & Overview USA Is it profitable to do Airbnb in Clarksville, …

Read More →
Annual Airbnb Revenue in Hilton head island south carolina, USA

Hilton Head Island, South Carolina| Airbnb Market Data & Overview | USA Hilton Head Island, South Carolina Airbnb Market Data & Overview USA Is it …

Read More →
airbnb occupancy selden kansas
Interview with an Airbnb Host from Selden, Kansas – S2 EP35

Welcome back to another episode of Into The Airbnb, where we chat with Airbnb hosts about their short-term rental experience. Today’s guest is Maureen Bruggeman, …

Read More →
Annual Airbnb Revenue in Naperville illinois, USA

Naperville, Illinois| Airbnb Market Data & Overview | USA Naperville, Illinois Airbnb Market Data & Overview USA Is it profitable to do Airbnb in Naperville, …

Read More →
what is ltm
What is LTM in Airbnb? Tips and Tools to Leverage It

What is LTM in Airbnb data? Learn from this article what it means and how you can leverage it for your Airbnb success! Home > …

Read More →

Free Webinar

Learn Airbtics in 7 Minutes

Revenue and market analysis Tips and Best Practices!
Airbnb Data
Airbnb Data

ARE YOU IN?

Get Access to our weekly data-driven airbnb report!