








Die besten Airbnb-Märkte in Germany (2026)

Basierend auf Airbtics-Daten aus dem Zeitraum September 2025 to August 2026 zeigt diese Seite die besten Airbnb-Standorte für Investitionen in Germany, ergänzt durch wichtige Kennzahlen wie Regulierungen für Kurzzeitvermietungen, Anzahl der Inserate, Auslastungsraten, durchschnittliche Tagespreise und Jahresumsätze. Entdecken Sie die profitabelsten Städte zum Investieren, Kaufen und Besitzen von Airbnb-Mietobjekten in Germany.

Die Märkte auf dieser Seite sind nach der Airbtics-Marktnote sortiert, nicht nach der Anzahl der Inserate. Die Note vergleicht Rendite, Umsatzwachstum und Auslastung (Nachfrage) mit den anderen Märkten dieser Rangliste und passt das Ergebnis an die Kurzzeitvermietungsregeln an.

  1. Rendite: Jahresumsatz aus Kurzzeitvermietung geteilt durch den Immobilienpreis. Eine höhere Rendite steht weiter oben.
  2. Wachstum: Veränderung des Umsatzes gegenüber dem Vorjahr. Schnelleres Wachstum steht weiter oben.
  3. Nachfrage: Durchschnittliche Auslastung der letzten 12 Monate. Eine höhere Auslastung steht weiter oben.
Erfahren Sie mehr über unsere Datenerhebung und Genauigkeit

Zuletzt aktualisiert: 16th October, 2026

Überblick Kurzzeitmietmarkt Germany (Analyse 2025)

Nationale Durchschnittswerte über alle Märkte in Germany
Durchschn. Auslastung i
59.41%
Durchschn. Jahresumsatz i
€25,597
Durchschn. Tagespreis (ADR) i
€116
Angebot-Wachstum (YoY) i
35.22%
Umsatzveränderung (YoY) i
6.35%

Top 27 Städte in Germany für Airbnb im Jahr 2026

Merken Rang Markt-Bewertung Marktname Regulierung Inserate Durchschn. Auslastung Durchschn. Tagespreis Umsatz STR-Rendite Umsatzwachstum
1ADresden
Lenient
1,44768%€94€24,35215.3%+11.6%
2AErfurt
Lenient
59967%€102€26,06214.0%+18.6%
3BBerlin
Strict
6,52274% 🚀€128€35,70812.9%+9.5%
4BCologne
Strict
2,51465%€121€29,445Unlock in Market ExplorerUnlock in Market Explorer
5BHamburg
Strict
2,49572%€127€34,424Unlock in Market ExplorerUnlock in Market Explorer
6BHochsauerlandkreis
Lenient
1,64150%€124€24,004Unlock in Market ExplorerUnlock in Market Explorer
7BMayen-Koblenz
Lenient
1,59761%€97€22,417Unlock in Market ExplorerUnlock in Market Explorer
8BBremen
Lenient
97765%€90€22,088Unlock in Market ExplorerUnlock in Market Explorer
9BMosel Valley
Lenient
94660%€116€26,508Unlock in Market ExplorerUnlock in Market Explorer
10B+Dortmund
Strict
46957%€92€20,089Unlock in Market ExplorerUnlock in Market Explorer
11CMunich
Lenient
3,32659%€134€29,484Unlock in Market ExplorerUnlock in Market Explorer
12CLeipzig
Lenient
1,85560%€94€21,387Unlock in Market ExplorerUnlock in Market Explorer
13COrtenaukreis
Lenient
1,76259%€115€25,819Unlock in Market ExplorerUnlock in Market Explorer
14CRostock
Lenient
1,64650%€132€25,058Unlock in Market ExplorerUnlock in Market Explorer
15CLubeck
Lenient
1,02066%€115€28,686Unlock in Market ExplorerUnlock in Market Explorer
16CGarmisch-Partenkirchen
Lenient
67063%€178€42,485Unlock in Market ExplorerUnlock in Market Explorer
17C+Rugen Island
Lenient
2,80152%€142€28,320Unlock in Market ExplorerUnlock in Market Explorer
18C+Dusseldorf
Strict
1,56057%€115€24,594Unlock in Market ExplorerUnlock in Market Explorer
19C+Nurnberg
Lenient
1,08761%€102€23,470Unlock in Market ExplorerUnlock in Market Explorer
20C+Essen
Lenient
96556%€96€20,496Unlock in Market ExplorerUnlock in Market Explorer
21C+Freiburg im breisgau
Lenient
45876% 🚀€105€29,772Unlock in Market ExplorerUnlock in Market Explorer
22DBodenseekreis
Lenient
1,57054%€129€26,218Unlock in Market ExplorerUnlock in Market Explorer
23D+Region Hannover
Lenient
2,35750%€108€20,361Unlock in Market ExplorerUnlock in Market Explorer
24D+Karlsruhe
Lenient
52769%€83€21,890Unlock in Market ExplorerUnlock in Market Explorer
25E+Sylt
Lenient
1,28226%€205€21,278Unlock in Market ExplorerUnlock in Market Explorer
26E+Stuttgart
Lenient
95058%€87€19,083Unlock in Market ExplorerUnlock in Market Explorer
27E+Frankfurt am Main
Lenient
87649%€95€17,614Unlock in Market ExplorerUnlock in Market Explorer

Data Seen By

Finden Sie die besten Airbnb-Märkte mit unserem interaktiven Tool

Nutzen Sie unseren interaktiven Market Explorer, um die besten Orte für einen Airbnb-Start in Germany zu finden. Vergleichen Sie Märkte direkt miteinander, filtern Sie nach Regulierungen, Budget (Immobilienpreise oder Mieten) sowie Marktgröße und exportieren Sie die Ergebnisse nach Excel.

Interaktives Tool ausprobieren

Warum im Jahr 2026 in Airbnb in Germany investieren?

In den letzten Jahren hat sich Germany dank seiner beliebten Touristenattraktionen, florierenden Geschäftsaktivitäten, wachsenden Anzahl von digitalen Nomaden und pulsierenden Städten wie Dresden, Erfurt and Berlin zu einem der Top-Standorte für Investitionen in Kurzzeitmieten entwickelt. Mit Millionen von internationalen Besuchern jedes Jahr steigt die Nachfrage nach Unterkünften stetig an, was Airbnb in Germany zu einer lukrativen Option für lokale und ausländische Investoren macht.

Dank der starken Nachfrage bietet Germany wettbewerbsfähige durchschnittliche Tagespreise (ADR), gesunde Auslastungsraten und attraktive Umsatzpotenziale in den Top-Märkten. Egal, ob Sie Ihr erstes Airbnb-Business mit einem kleinen Budget starten oder ein Luxus-Objekt in Ihr Portfolio aufnehmen möchten – Germany bietet profitable Standorte für jedes Budget und jede Investoren-Strategie.

Top 3 Airbnb markets in Germany by Market Grade

These are the three highest-graded Airbnb markets in Germany. Market Grade compares yield, revenue growth, and occupancy (demand) with the other markets on this page, then adjusts for short-term rental regulation. The chart repeats those three percentiles in text so the ranking is readable without the graphic.

Rank 1 — Dresden (Grade A)

Dresden is rank 1 of 27 markets in this Germany ranking by Airbtics Market Grade A, with 15.3% short-term rental yield, 68.0% occupancy, and +11.6% year-over-year revenue growth.

Compared with the other markets on this page, Dresden ranks top 2% for yield, top 17% for growth, and top 17% for demand. The market shows an average daily rate of €94, annual revenue of €24,352, a rent gap of 3376.9%, 1,447 active listings, lenient short-term rental regulation, and a typical 2-bedroom property price of €223,025.

  • Market gradeA
  • Yield15.3%
  • Revenue growth+11.6%
  • Occupancy68.0%
  • Average daily rate€94
  • Annual revenue€24,352
  • Rent gap3376.9%
  • Active listings1,447
  • 2-bedroom price€223,025
  • RegulationLenient
top 2%Yieldtop 17%Growthtop 17%Demand

Percentile versus other Germany markets on this page. Farther from the center is stronger.

  • Yield: top 2%
  • Growth: top 17%
  • Demand: top 17%

Rank 2 — Erfurt (Grade A)

Erfurt is rank 2 of 27 markets in this Germany ranking by Airbtics Market Grade A, with 14.0% short-term rental yield, 67.0% occupancy, and +18.6% year-over-year revenue growth.

Compared with the other markets on this page, Erfurt ranks top 6% for yield, top 2% for growth, and top 20% for demand. The market shows an average daily rate of €102, annual revenue of €26,062, a rent gap of 3594.4%, 599 active listings, lenient short-term rental regulation, and a typical 2-bedroom property price of €223,025.

  • Market gradeA
  • Yield14.0%
  • Revenue growth+18.6%
  • Occupancy67.0%
  • Average daily rate€102
  • Annual revenue€26,062
  • Rent gap3594.4%
  • Active listings599
  • 2-bedroom price€223,025
  • RegulationLenient
top 6%Yieldtop 2%Growthtop 20%Demand

Percentile versus other Germany markets on this page. Farther from the center is stronger.

  • Yield: top 6%
  • Growth: top 2%
  • Demand: top 20%

Rank 3 — Berlin (Grade B)

Berlin is rank 3 of 27 markets in this Germany ranking by Airbtics Market Grade B, with 12.9% short-term rental yield, 74.0% occupancy, and +9.5% year-over-year revenue growth.

Compared with the other markets on this page, Berlin ranks top 28% for yield, top 31% for growth, and top 6% for demand. The market shows an average daily rate of €128, annual revenue of €35,708, a rent gap of 4199.2%, 6,522 active listings, strict short-term rental regulation, and a typical 2-bedroom property price of €446,050.

  • Market gradeB
  • Yield12.9%
  • Revenue growth+9.5%
  • Occupancy74.0%
  • Average daily rate€128
  • Annual revenue€35,708
  • Rent gap4199.2%
  • Active listings6,522
  • 2-bedroom price€446,050
  • RegulationStrict
top 28%Yieldtop 31%Growthtop 6%Demand

Percentile versus other Germany markets on this page. Farther from the center is stronger.

  • Yield: top 28%
  • Growth: top 31%
  • Demand: top 6%

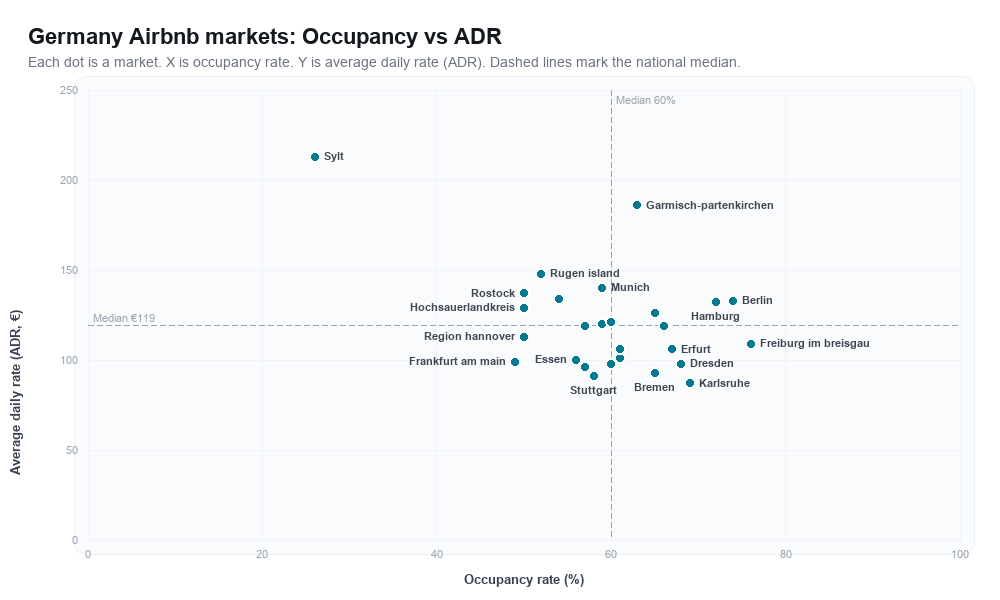
Marktsättigungsanalyse: Germany

Each dot is a vacation rental market in Germany, plotted by occupancy rate (x-axis) and average daily rate (ADR) (y-axis). Dashed lines mark the national median.

Germany Airbnb markets rankboard scatter chart showing occupancy rate versus average daily rate (ADR)
Occupancy rate and average daily rate for each Germany market plotted in the chart above, in Market Grade order.
MarketOccupancy rateAverage daily rate
Dresden68.0%€94
Erfurt67.0%€102
Berlin74.0%€128
Cologne65.0%€121
Hamburg72.0%€127
Hochsauerlandkreis50.0%€124
Mayen-Koblenz61.0%€97
Bremen65.0%€90
Mosel Valley60.0%€116
Dortmund57.0%€92
Munich59.0%€134
Leipzig60.0%€94
Ortenaukreis59.0%€115
Rostock50.0%€132
Lubeck66.0%€115
Garmisch-Partenkirchen63.0%€178
Rugen Island52.0%€142
Dusseldorf57.0%€115
Nurnberg61.0%€102
Essen56.0%€96
Freiburg im breisgau76.0%€105
Bodenseekreis54.0%€129
Region Hannover50.0%€108
Karlsruhe69.0%€83
Sylt26.0%€205
Stuttgart58.0%€87
Frankfurt am Main49.0%€95

Compare property prices, short-term rental yield, rent gap, annual revenue, and supply growth in the Airbtics Market Explorer watchlist.


Schätzen Sie Ihre Airbnb-Einnahmen in Germany


Bereit, nach den profitabelsten Investitionsmöglichkeiten für Kurzzeitmieten in Germany zu suchen?

Nutzen Sie unseren Airbnb-Rechner, um schnell und präzise das Umsatz- und Rentabilitätspotenzial jeder Stadt oder Nachbarschaft einzuschätzen.

Airbnb-Rechner testen

Trends, Angebot und Veränderungen zum Vorjahr stehen im Marktbericht 2025 für Germany.