fbpx
Categories
Others

Annual Airbnb Revenue In Verona Italy

Verona| Airbnb Market Data & Overview | Italy

Verona
Airbnb Market Data & Overview
Italy

Is it profitable to do Airbnb in Verona, Italy?

What is the occupancy rate of Airbnb in Verona, Italy?

What is the average daily rate of Airbnb in Verona, Italy?

Author Image

Verona, Italy Airbnb Data

Last updated on: 15th May, 2024

Italy / Verona
Investing in a short-term rental can be highly stable and profitable. It’s stable because housing has been one of the most stable asset classes. Also, when you can’t do an Airbnb anymore, you can still rent it out to a long-term tenant with a lower yield. It is highly profitable because the monthly cash flow from short-term rental investment typically is double the amount of traditional rentals.
Without further ado, let’s see if Verona is good for Airbnb.

Is Airbnb Profitable in Verona ?

Yes, there is a good short-term rental demand..
Occupancy Rate

65%

€119

Daily Rate

€27K

Revenue (2023)

2,883

Number of Listings
A typical short-term rental listing in Verona is booked for 237 nights a year, with a median occupancy rate of 65% and an average daily rate of €119. In Verona, A typical host income (annual revenue) was €27K in 2023. There are 2,883 active Airbnb listings as of 2024-04-15.
A 65% median occupancy rate is considered a good market to do an Airbnb. Take professional photos of your property, get a few good reviews on Airbnb, then you are likely to make good income.

Best Areas in Verona for Airbnb

Best Areas in Verona for Airbnb Are you wondering where to invest in Verona? Look no further! Here are 10 areas travelers often search for. You can find the short-term rental statistics of all of these neighborhoods from Airbtics! Check out which neighborhood has the highest rental demand. 🚀
  1. Verona Arena
  2. Piazza delle Erbe
  3. Juliet’s House (Casa di Giulietta)
  4. Castelvecchio Museum
  5. Ponte Pietra
  6. Verona Cathedral (Cattedrale Santa Maria Matricolare)
  7. Basilica of San Zeno Maggiore
  8. Giardino Giusti
  9. Piazza dei Signori
  10. Scaliger Tombs (Arche Scaligere)
Okay, you might wonder about more specific data. For example, how much can an average listing with 4 bedrooms and a pool make? Or, what is the seasonality in booking? When is the peak month? Click the below button and check out more in-depth vacation rental data for free.
Signup and check out more in-depth vacation rental data for free.
Explore Verona‘s Airbnb Data
border-boundary-image
Categories
Others

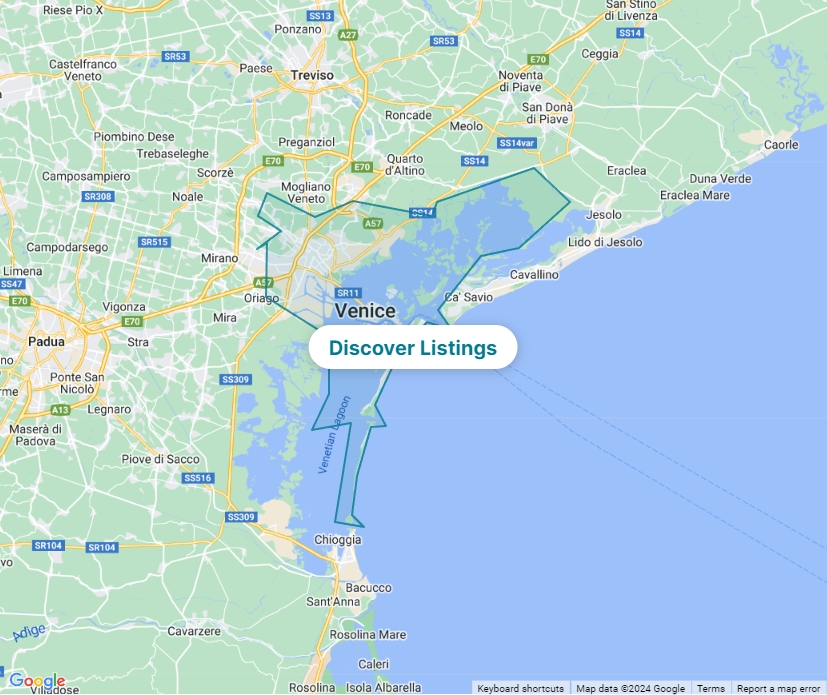
Annual Airbnb Revenue In Venice Italy

Venice| Airbnb Market Data & Overview | Italy

Venice
Airbnb Market Data & Overview
Italy

Is it profitable to do Airbnb in Venice, Italy?

What is the occupancy rate of Airbnb in Venice, Italy?

What is the average daily rate of Airbnb in Venice, Italy?

Author Image

Venice, Italy Airbnb Data

Last updated on: 15th May, 2024

Italy / Venice
Investing in a short-term rental can be highly stable and profitable. It’s stable because housing has been one of the most stable asset classes. Also, when you can’t do an Airbnb anymore, you can still rent it out to a long-term tenant with a lower yield. It is highly profitable because the monthly cash flow from short-term rental investment typically is double the amount of traditional rentals.
Without further ado, let’s see if Venice is good for Airbnb.

Is Airbnb Profitable in Venice ?

Yes, there is a good short-term rental demand..
Occupancy Rate

74%

€151

Daily Rate

€41K

Revenue (2023)

7,666

Number of Listings
A typical short-term rental listing in Venice is booked for 270 nights a year, with a median occupancy rate of 74% and an average daily rate of €151. In Venice, A typical host income (annual revenue) was €41K in 2023. There are 7,666 active Airbnb listings as of 2024-04-15.
A 74% median occupancy rate is considered a good market to do an Airbnb. Take professional photos of your property, get a few good reviews on Airbnb, then you are likely to make good income.

Best Areas in Venice for Airbnb

Best Areas in Venice for Airbnb Are you wondering where to invest in Venice? Look no further! Here are 10 areas travelers often search for. You can find the short-term rental statistics of all of these neighborhoods from Airbtics! Check out which neighborhood has the highest rental demand. 🚀
  1. St. Mark’s Square (Piazza San Marco)
  2. Grand Canal
  3. Rialto Bridge
  4. Doge’s Palace (Palazzo Ducale)
  5. St. Mark’s Basilica (Basilica di San Marco)
  6. Murano Island
  7. Burano Island
  8. Venetian Ghetto
  9. Peggy Guggenheim Collection
  10. Ca’ d’Oro
Okay, you might wonder about more specific data. For example, how much can an average listing with 4 bedrooms and a pool make? Or, what is the seasonality in booking? When is the peak month? Click the below button and check out more in-depth vacation rental data for free.
Signup and check out more in-depth vacation rental data for free.
Explore Venice‘s Airbnb Data
border-boundary-image
Categories
Others

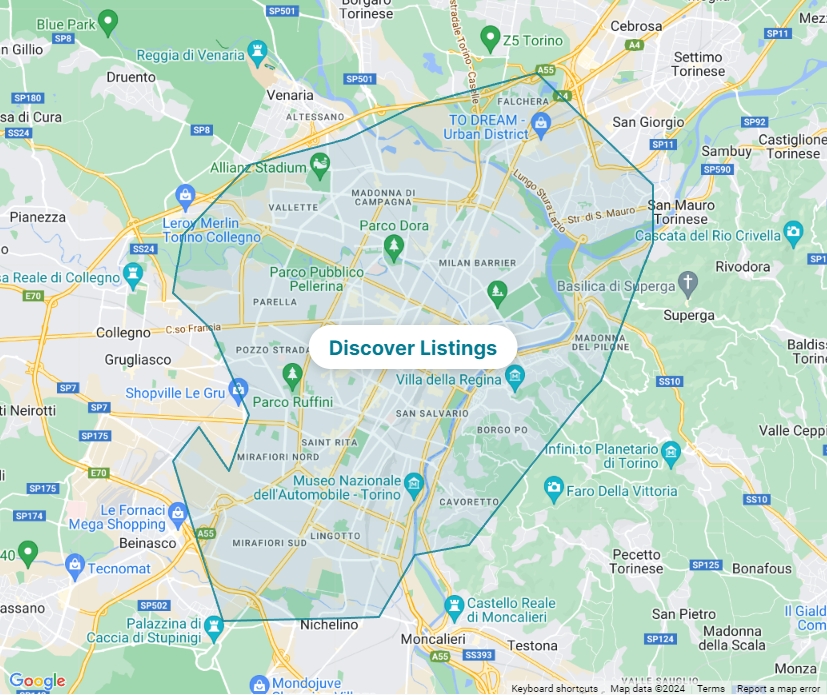
Annual Airbnb Revenue In Turin Italy

Turin| Airbnb Market Data & Overview | Italy

Turin
Airbnb Market Data & Overview
Italy

Is it profitable to do Airbnb in Turin, Italy?

What is the occupancy rate of Airbnb in Turin, Italy?

What is the average daily rate of Airbnb in Turin, Italy?

Author Image

Turin, Italy Airbnb Data

Last updated on: 15th May, 2024

Italy / Turin
Investing in a short-term rental can be highly stable and profitable. It’s stable because housing has been one of the most stable asset classes. Also, when you can’t do an Airbnb anymore, you can still rent it out to a long-term tenant with a lower yield. It is highly profitable because the monthly cash flow from short-term rental investment typically is double the amount of traditional rentals.
Without further ado, let’s see if Turin is good for Airbnb.

Is Airbnb Profitable in Turin ?

Yes, there is a good short-term rental demand..
Occupancy Rate

67%

€70

Daily Rate

€16K

Revenue (2023)

5,935

Number of Listings
A typical short-term rental listing in Turin is booked for 245 nights a year, with a median occupancy rate of 67% and an average daily rate of €70. In Turin, A typical host income (annual revenue) was €16K in 2023. There are 5,935 active Airbnb listings as of 2024-04-15.
A 67% median occupancy rate is considered a good market to do an Airbnb. Take professional photos of your property, get a few good reviews on Airbnb, then you are likely to make good income.

Best Areas in Turin for Airbnb

Best Areas in Turin for Airbnb Are you wondering where to invest in Turin? Look no further! Here are 10 areas travelers often search for. You can find the short-term rental statistics of all of these neighborhoods from Airbtics! Check out which neighborhood has the highest rental demand. 🚀
  1. Mole Antonelliana
  2. Egyptian Museum of Turin
  3. Palazzo Reale
  4. Piazza Castello
  5. Porta Palatina
  6. Basilica of Superga
  7. Parco del Valentino
  8. Museum of Cinema
  9. Museo Egizio
  10. Basilica di Superga
Okay, you might wonder about more specific data. For example, how much can an average listing with 4 bedrooms and a pool make? Or, what is the seasonality in booking? When is the peak month? Click the below button and check out more in-depth vacation rental data for free.
Signup and check out more in-depth vacation rental data for free.
Explore Turin‘s Airbnb Data
border-boundary-image
Categories
Others

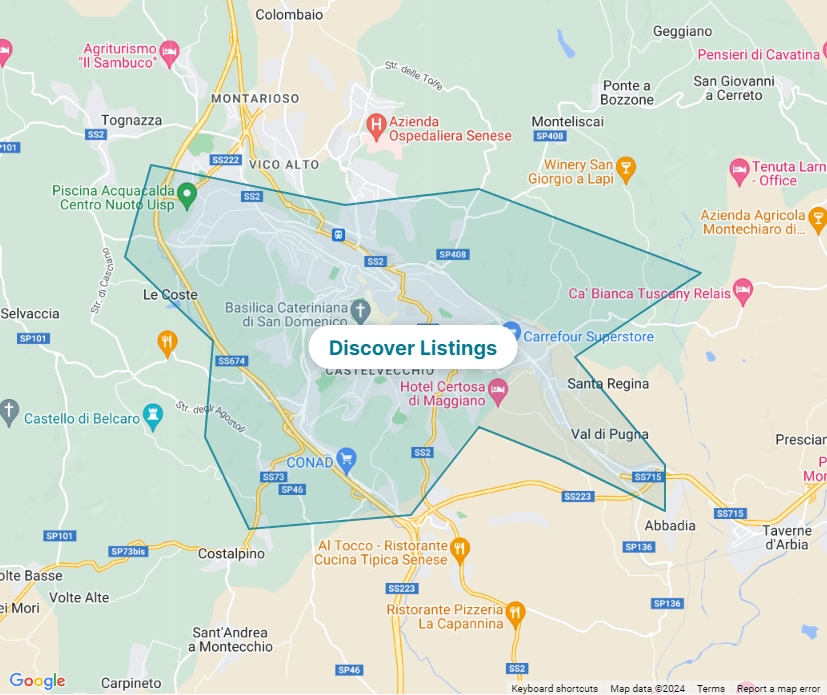
Annual Airbnb Revenue In Siena Italy

Siena| Airbnb Market Data & Overview | Italy

Siena
Airbnb Market Data & Overview
Italy

Is it profitable to do Airbnb in Siena, Italy?

What is the occupancy rate of Airbnb in Siena, Italy?

What is the average daily rate of Airbnb in Siena, Italy?

Author Image

Siena, Italy Airbnb Data

Last updated on: 15th May, 2024

Italy / Siena
Investing in a short-term rental can be highly stable and profitable. It’s stable because housing has been one of the most stable asset classes. Also, when you can’t do an Airbnb anymore, you can still rent it out to a long-term tenant with a lower yield. It is highly profitable because the monthly cash flow from short-term rental investment typically is double the amount of traditional rentals.
Without further ado, let’s see if Siena is good for Airbnb.

Is Airbnb Profitable in Siena ?

Yes, there is a good short-term rental demand..
Occupancy Rate

68%

€107

Daily Rate

€26K

Revenue (2023)

1,027

Number of Listings
A typical short-term rental listing in Siena is booked for 248 nights a year, with a median occupancy rate of 68% and an average daily rate of €107. In Siena, A typical host income (annual revenue) was €26K in 2023. There are 1,027 active Airbnb listings as of 2024-04-15.
A 68% median occupancy rate is considered a good market to do an Airbnb. Take professional photos of your property, get a few good reviews on Airbnb, then you are likely to make good income.

Best Areas in Siena for Airbnb

Best Areas in Siena for Airbnb Are you wondering where to invest in Siena? Look no further! Here are 10 areas travelers often search for. You can find the short-term rental statistics of all of these neighborhoods from Airbtics! Check out which neighborhood has the highest rental demand. 🚀
  1. Piazza del Campo
  2. Siena Cathedral (Duomo di Siena)
  3. Torre del Mangia
  4. Palazzo Pubblico
  5. Basilica of San Domenico
  6. Siena Baptistery of San Giovanni
  7. Piccolomini Library
  8. Museo dell’Opera del Duomo
  9. Santa Maria della Scala
  10. Palazzo Salimbeni
Okay, you might wonder about more specific data. For example, how much can an average listing with 4 bedrooms and a pool make? Or, what is the seasonality in booking? When is the peak month? Click the below button and check out more in-depth vacation rental data for free.
Signup and check out more in-depth vacation rental data for free.
Explore Siena‘s Airbnb Data
border-boundary-image
Categories
Others

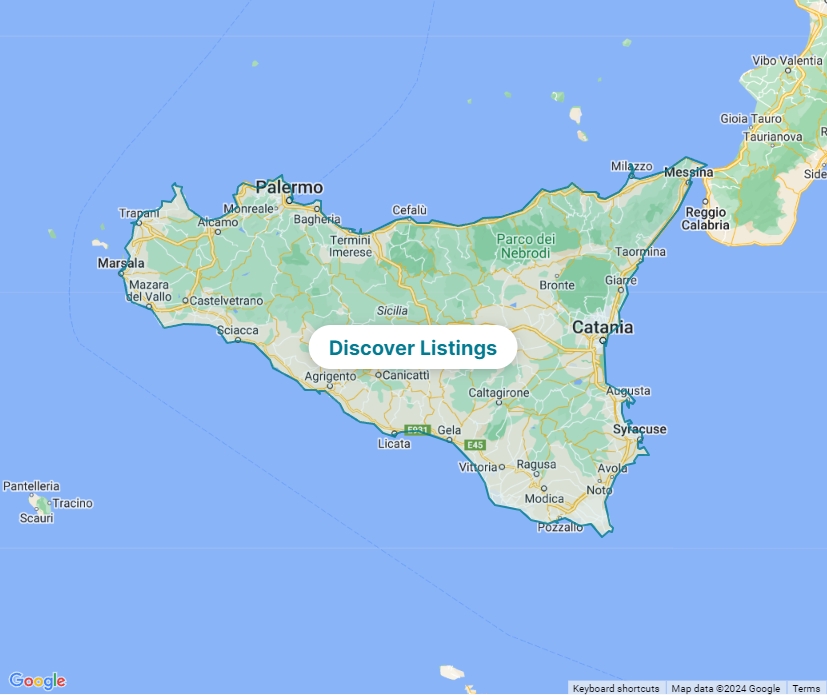
Annual Airbnb Revenue In Sicily Italy

Sicily| Airbnb Market Data & Overview | Italy

Sicily
Airbnb Market Data & Overview
Italy

Is it profitable to do Airbnb in Sicily, Italy?

What is the occupancy rate of Airbnb in Sicily, Italy?

What is the average daily rate of Airbnb in Sicily, Italy?

Author Image

Sicily, Italy Airbnb Data

Last updated on: 15th May, 2024

Italy / Sicily
Investing in a short-term rental can be highly stable and profitable. It’s stable because housing has been one of the most stable asset classes. Also, when you can’t do an Airbnb anymore, you can still rent it out to a long-term tenant with a lower yield. It is highly profitable because the monthly cash flow from short-term rental investment typically is double the amount of traditional rentals.
Without further ado, let’s see if Sicily is good for Airbnb.

Is Airbnb Profitable in Sicily ?

Yes, there is a good short-term rental demand..
Occupancy Rate

58%

€80

Daily Rate

€17K

Revenue (2023)

40,785

Number of Listings
A typical short-term rental listing in Sicily is booked for 212 nights a year, with a median occupancy rate of 58% and an average daily rate of €80. In Sicily, A typical host income (annual revenue) was €17K in 2023. There are 40,785 active Airbnb listings as of 2024-04-15.
A 58% median occupancy rate is considered a good market to do an Airbnb. Take professional photos of your property, get a few good reviews on Airbnb, then you are likely to make good income.

Best Areas in Sicily for Airbnb

Best Areas in Sicily for Airbnb Are you wondering where to invest in Sicily? Look no further! Here are 10 areas travelers often search for. You can find the short-term rental statistics of all of these neighborhoods from Airbtics! Check out which neighborhood has the highest rental demand. 🚀
  1. Mount Etna
  2. Valley of the Temples (Valle dei Templi)
  3. Taormina
  4. Syracuse (Siracusa)
  5. Palermo
  6. Agrigento
  7. Cefalù
  8. Catania
  9. Trapani
  10. Noto
Okay, you might wonder about more specific data. For example, how much can an average listing with 4 bedrooms and a pool make? Or, what is the seasonality in booking? When is the peak month? Click the below button and check out more in-depth vacation rental data for free.
Signup and check out more in-depth vacation rental data for free.
Explore Sicily‘s Airbnb Data
border-boundary-image
Categories
Others

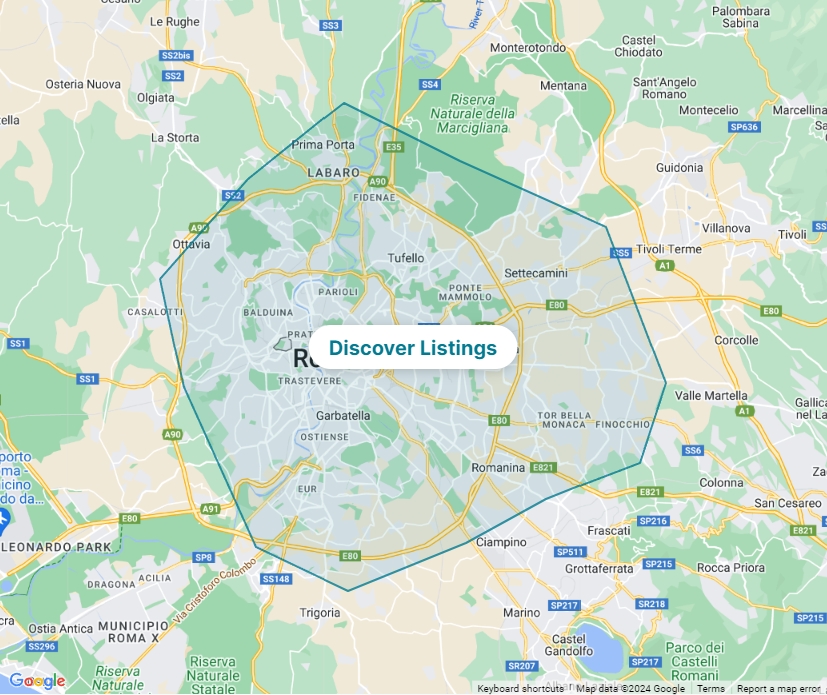
Annual Airbnb Revenue In Rome Italy

Rome| Airbnb Market Data & Overview | Italy

Rome
Airbnb Market Data & Overview
Italy

Is it profitable to do Airbnb in Rome, Italy?

What is the occupancy rate of Airbnb in Rome, Italy?

What is the average daily rate of Airbnb in Rome, Italy?

Author Image

Rome, Italy Airbnb Data

Last updated on: 15th May, 2024

Italy / Rome
Investing in a short-term rental can be highly stable and profitable. It’s stable because housing has been one of the most stable asset classes. Also, when you can’t do an Airbnb anymore, you can still rent it out to a long-term tenant with a lower yield. It is highly profitable because the monthly cash flow from short-term rental investment typically is double the amount of traditional rentals.
Without further ado, let’s see if Rome is good for Airbnb.

Is Airbnb Profitable in Rome ?

Yes, there is a good short-term rental demand..
Occupancy Rate

82%

€131

Daily Rate

€37K

Revenue (2023)

26,843

Number of Listings
A typical short-term rental listing in Rome is booked for 299 nights a year, with a median occupancy rate of 82% and an average daily rate of €131. In Rome, A typical host income (annual revenue) was €37K in 2023. There are 26,843 active Airbnb listings as of 2024-04-15.
A 82% median occupancy rate is considered a good market to do an Airbnb. Take professional photos of your property, get a few good reviews on Airbnb, then you are likely to make good income.

Best Areas in Rome for Airbnb

Best Areas in Rome for Airbnb Are you wondering where to invest in Rome? Look no further! Here are 10 areas travelers often search for. You can find the short-term rental statistics of all of these neighborhoods from Airbtics! Check out which neighborhood has the highest rental demand. 🚀
  1. Colosseum
  2. Vatican City
  3. Trevi Fountain
  4. Pantheon
  5. Roman Forum
  6. Spanish Steps
  7. St. Peter’s Basilica
  8. Piazza Navona
  9. Villa Borghese Gardens
  10. Trastevere
Okay, you might wonder about more specific data. For example, how much can an average listing with 4 bedrooms and a pool make? Or, what is the seasonality in booking? When is the peak month? Click the below button and check out more in-depth vacation rental data for free.
Signup and check out more in-depth vacation rental data for free.
Explore Rome‘s Airbnb Data
border-boundary-image
Categories
Others

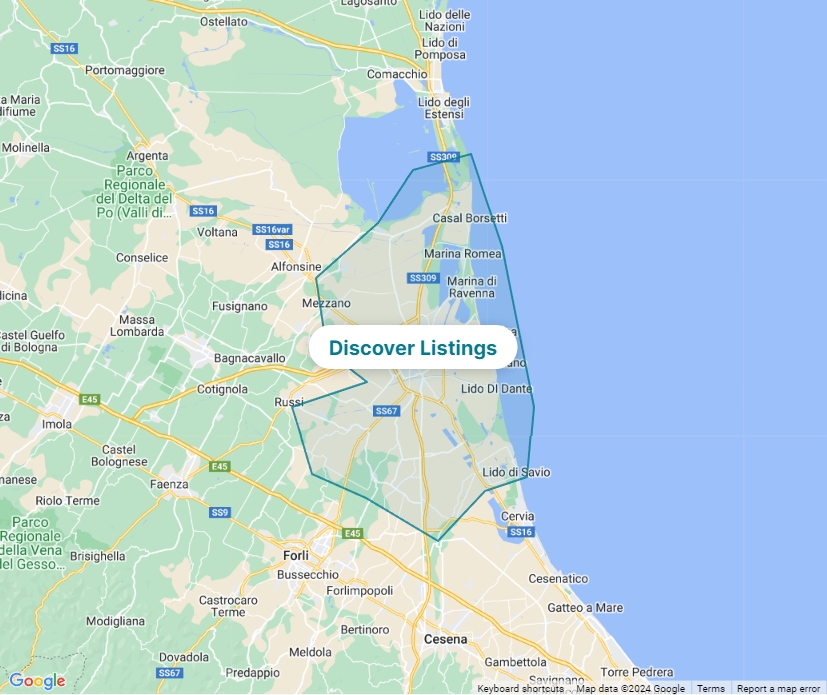
Annual Airbnb Revenue In Ravenna Italy

Ravenna| Airbnb Market Data & Overview | Italy

Ravenna
Airbnb Market Data & Overview
Italy

Is it profitable to do Airbnb in Ravenna, Italy?

What is the occupancy rate of Airbnb in Ravenna, Italy?

What is the average daily rate of Airbnb in Ravenna, Italy?

Author Image

Ravenna, Italy Airbnb Data

Last updated on: 15th May, 2024

Italy / Ravenna
Investing in a short-term rental can be highly stable and profitable. It’s stable because housing has been one of the most stable asset classes. Also, when you can’t do an Airbnb anymore, you can still rent it out to a long-term tenant with a lower yield. It is highly profitable because the monthly cash flow from short-term rental investment typically is double the amount of traditional rentals.
Without further ado, let’s see if Ravenna is good for Airbnb.

Is Airbnb Profitable in Ravenna ?

Yes, there is a good short-term rental demand..
Occupancy Rate

60%

€90

Daily Rate

€20K

Revenue (2023)

827

Number of Listings
A typical short-term rental listing in Ravenna is booked for 219 nights a year, with a median occupancy rate of 60% and an average daily rate of €90. In Ravenna, A typical host income (annual revenue) was €20K in 2023. There are 827 active Airbnb listings as of 2024-04-15.
A 60% median occupancy rate is considered a good market to do an Airbnb. Take professional photos of your property, get a few good reviews on Airbnb, then you are likely to make good income.

Best Areas in Ravenna for Airbnb

Best Areas in Ravenna for Airbnb Are you wondering where to invest in Ravenna? Look no further! Here are 10 areas travelers often search for. You can find the short-term rental statistics of all of these neighborhoods from Airbtics! Check out which neighborhood has the highest rental demand. 🚀
  1. Basilica of San Vitale
  2. Mausoleum of Galla Placidia
  3. Basilica of Sant’Apollinare Nuovo
  4. Mausoleum of Theodoric
  5. Battistero Neoniano (Neon Baptistry)
  6. Dante’s Tomb
  7. Archiepiscopal Museum
  8. Mausoleo di Teodorico
  9. Domus dei Tappeti di Pietra
  10. Mausoleum of Dante Alighieri
Okay, you might wonder about more specific data. For example, how much can an average listing with 4 bedrooms and a pool make? Or, what is the seasonality in booking? When is the peak month? Click the below button and check out more in-depth vacation rental data for free.
Signup and check out more in-depth vacation rental data for free.
Explore Ravenna‘s Airbnb Data
border-boundary-image
Categories
Others

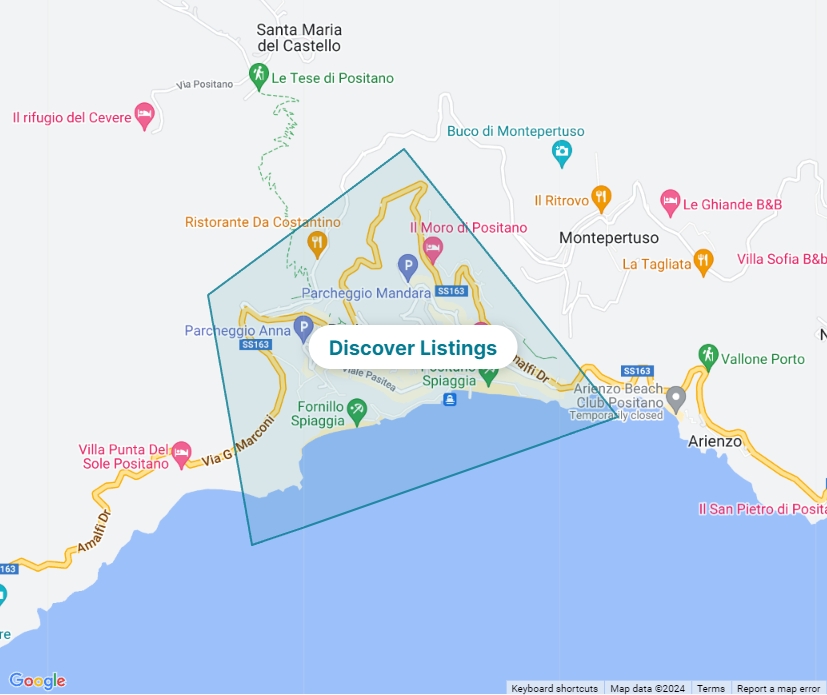
Annual Airbnb Revenue In Positano Italy

Positano| Airbnb Market Data & Overview | Italy

Positano
Airbnb Market Data & Overview
Italy

Is it profitable to do Airbnb in Positano, Italy?

What is the occupancy rate of Airbnb in Positano, Italy?

What is the average daily rate of Airbnb in Positano, Italy?

Author Image

Positano, Italy Airbnb Data

Last updated on: 15th May, 2024

Italy / Positano
Investing in a short-term rental can be highly stable and profitable. It’s stable because housing has been one of the most stable asset classes. Also, when you can’t do an Airbnb anymore, you can still rent it out to a long-term tenant with a lower yield. It is highly profitable because the monthly cash flow from short-term rental investment typically is double the amount of traditional rentals.
Without further ado, let’s see if Positano is good for Airbnb.

Is Airbnb Profitable in Positano ?

Yes, there is a good short-term rental demand..
Occupancy Rate

84%

€435

Daily Rate

€121K

Revenue (2023)

654

Number of Listings
A typical short-term rental listing in Positano is booked for 307 nights a year, with a median occupancy rate of 84% and an average daily rate of €435. In Positano, A typical host income (annual revenue) was €121K in 2023. There are 654 active Airbnb listings as of 2024-04-15.
A 84% median occupancy rate is considered a good market to do an Airbnb. Take professional photos of your property, get a few good reviews on Airbnb, then you are likely to make good income.

Best Areas in Positano for Airbnb

Best Areas in Positano for Airbnb Are you wondering where to invest in Positano? Look no further! Here are 10 areas travelers often search for. You can find the short-term rental statistics of all of these neighborhoods from Airbtics! Check out which neighborhood has the highest rental demand. 🚀
  1. Spiaggia Grande
  2. Path of the Gods
  3. Church of Santa Maria Assunta
  4. Positano Harbor
  5. Fornillo Beach
  6. Positano Viewpoint
  7. Montepertuso
  8. Villa Rufolo
  9. Gavitella Beach
  10. Chiesa Nuova
Okay, you might wonder about more specific data. For example, how much can an average listing with 4 bedrooms and a pool make? Or, what is the seasonality in booking? When is the peak month? Click the below button and check out more in-depth vacation rental data for free.
Signup and check out more in-depth vacation rental data for free.
Explore Positano‘s Airbnb Data
border-boundary-image
Categories
Others

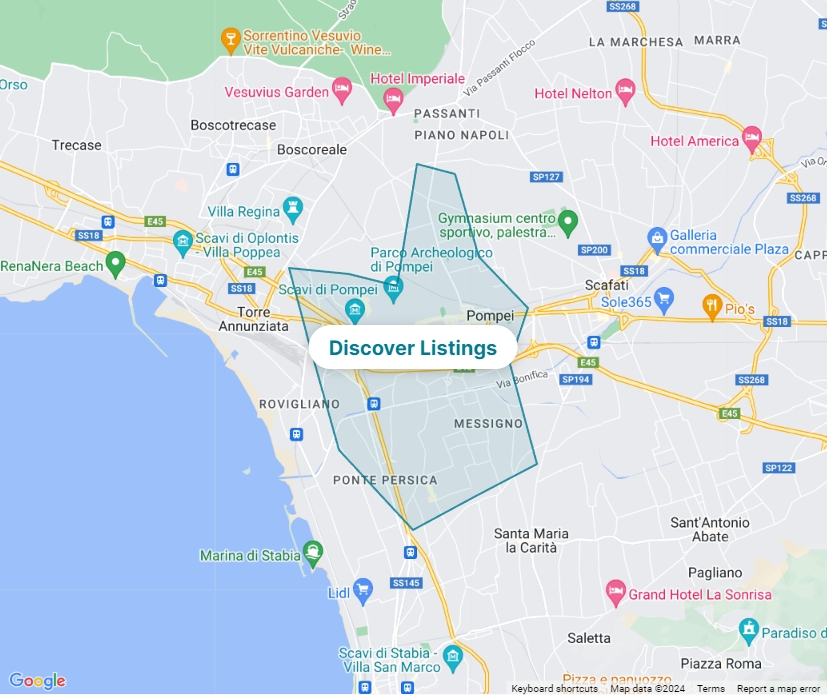
Annual Airbnb Revenue In Pompeii Italy

Pompeii| Airbnb Market Data & Overview | Italy

Pompeii
Airbnb Market Data & Overview
Italy

Is it profitable to do Airbnb in Pompeii, Italy?

What is the occupancy rate of Airbnb in Pompeii, Italy?

What is the average daily rate of Airbnb in Pompeii, Italy?

Author Image

Pompeii, Italy Airbnb Data

Last updated on: 15th May, 2024

Italy / Pompeii
Investing in a short-term rental can be highly stable and profitable. It’s stable because housing has been one of the most stable asset classes. Also, when you can’t do an Airbnb anymore, you can still rent it out to a long-term tenant with a lower yield. It is highly profitable because the monthly cash flow from short-term rental investment typically is double the amount of traditional rentals.
Without further ado, let’s see if Pompeii is good for Airbnb.

Is Airbnb Profitable in Pompeii ?

Yes, there is a good short-term rental demand..
Occupancy Rate

54%

€73

Daily Rate

€14K

Revenue (2023)

543

Number of Listings
A typical short-term rental listing in Pompeii is booked for 197 nights a year, with a median occupancy rate of 54% and an average daily rate of €73. In Pompeii, A typical host income (annual revenue) was €14K in 2023. There are 543 active Airbnb listings as of 2024-04-15.
A 54% median occupancy rate is considered a good market to do an Airbnb. Take professional photos of your property, get a few good reviews on Airbnb, then you are likely to make good income.

Best Areas in Pompeii for Airbnb

Best Areas in Pompeii for Airbnb Are you wondering where to invest in Pompeii? Look no further! Here are 10 areas travelers often search for. You can find the short-term rental statistics of all of these neighborhoods from Airbtics! Check out which neighborhood has the highest rental demand. 🚀
  1. Pompeii Archaeological Park
  2. Villa of the Mysteries
  3. House of the Faun
  4. Forum of Pompeii
  5. Amphitheatre of Pompeii
  6. Temple of Apollo
  7. House of the Vettii
  8. Garden of the Fugitives
  9. House of the Tragic Poet
  10. Temple of Jupiter
Okay, you might wonder about more specific data. For example, how much can an average listing with 4 bedrooms and a pool make? Or, what is the seasonality in booking? When is the peak month? Click the below button and check out more in-depth vacation rental data for free.
Signup and check out more in-depth vacation rental data for free.
Explore Pompeii‘s Airbnb Data
border-boundary-image
Categories
Others

Annual Airbnb Revenue In Pisa Italy

Pisa| Airbnb Market Data & Overview | Italy

Pisa
Airbnb Market Data & Overview
Italy

Is it profitable to do Airbnb in Pisa, Italy?

What is the occupancy rate of Airbnb in Pisa, Italy?

What is the average daily rate of Airbnb in Pisa, Italy?

Author Image

Pisa, Italy Airbnb Data

Last updated on: 15th May, 2024

Italy / Pisa
Investing in a short-term rental can be highly stable and profitable. It’s stable because housing has been one of the most stable asset classes. Also, when you can’t do an Airbnb anymore, you can still rent it out to a long-term tenant with a lower yield. It is highly profitable because the monthly cash flow from short-term rental investment typically is double the amount of traditional rentals.
Without further ado, let’s see if Pisa is good for Airbnb.

Is Airbnb Profitable in Pisa ?

Yes, there is a good short-term rental demand..
Occupancy Rate

72%

€90

Daily Rate

€22K

Revenue (2023)

1,371

Number of Listings
A typical short-term rental listing in Pisa is booked for 263 nights a year, with a median occupancy rate of 72% and an average daily rate of €90. In Pisa, A typical host income (annual revenue) was €22K in 2023. There are 1,371 active Airbnb listings as of 2024-04-15.
A 72% median occupancy rate is considered a good market to do an Airbnb. Take professional photos of your property, get a few good reviews on Airbnb, then you are likely to make good income.

Best Areas in Pisa for Airbnb

Best Areas in Pisa for Airbnb Are you wondering where to invest in Pisa? Look no further! Here are 10 areas travelers often search for. You can find the short-term rental statistics of all of these neighborhoods from Airbtics! Check out which neighborhood has the highest rental demand. 🚀
  1. Leaning Tower of Pisa
  2. Piazza dei Miracoli (Square of Miracles)
  3. Pisa Cathedral (Duomo di Pisa)
  4. Baptistery of Pisa
  5. Campo Santo Monumentale
  6. Piazza dei Cavalieri
  7. Palazzo Blu
  8. Palazzo della Carovana
  9. Church of Santa Maria della Spina
  10. Palazzo dei Cavalieri
Okay, you might wonder about more specific data. For example, how much can an average listing with 4 bedrooms and a pool make? Or, what is the seasonality in booking? When is the peak month? Click the below button and check out more in-depth vacation rental data for free.
Signup and check out more in-depth vacation rental data for free.
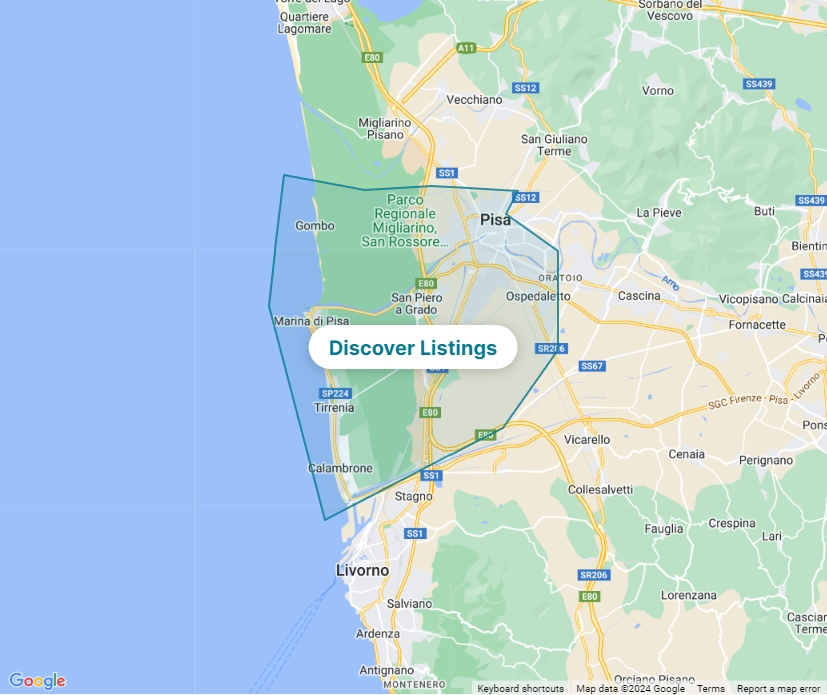
Explore Pisa‘s Airbnb Data
border-boundary-image
Airbnb Data
Airbnb Data

Join The Club!

Get a free weekly
Data-DRIVEN REPORT

will only send you value bombs

ARE YOU IN?

Get Access to our weekly data-driven airbnb report!